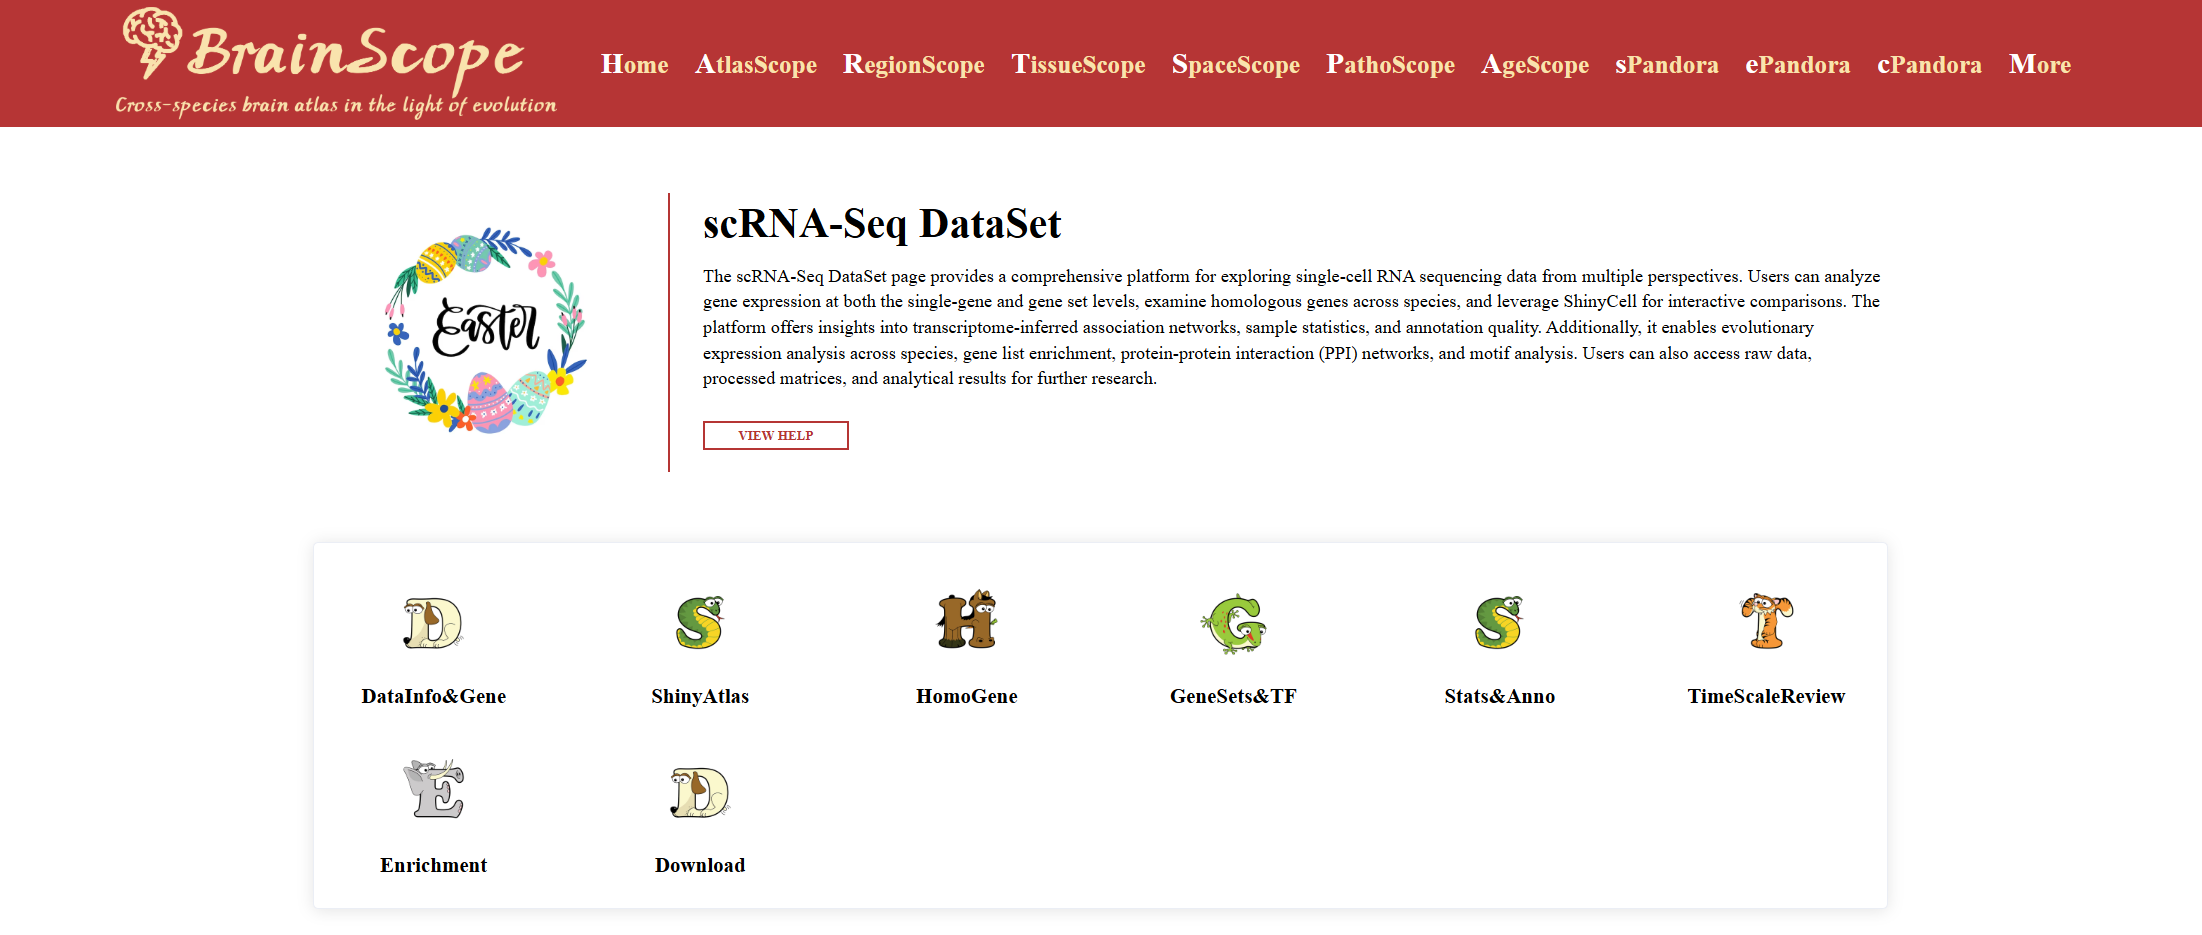
The scRNA-Seq DataSet page provides a comprehensive platform for exploring single-cell RNA sequencing data from multiple perspectives. Users can analyze gene expression at both the single-gene and gene set levels, examine homologous genes across species, and leverage ShinyCell for interactive comparisons. The platform offers insights into transcriptome-inferred association networks, sample statistics, and annotation quality. Additionally, it enables evolutionary expression analysis across species, gene list enrichment, protein-protein interaction (PPI) networks, and motif analysis. Users can also access raw data, processed matrices, and analytical results for further research.
When users click “ViewData”, they are directed to the scRNA-Seq DataSet page, where they can conduct a more in-depth exploration of the selected dataset.
The scRNA-Seq DataSet page presents data from eight perspectives, allowing users to analyze gene expression, cellular relationships, and dataset statistics comprehensively.
Overview of the Eight Exploration Sections
Part1: DataInfo&Gene – Gene-level expression atlas.
Part2: ShinyAtlas – Interactive dataset exploration using ShinyCell.
Part3: HomoGene – Homologous gene conversion files.
Part4: GeneSets&TF – Association networks inferred from transcriptomic data.
Part5: Stats&Anno – Sample-wise statistics and annotations.
Part6: TimeScaleReview – Evolutionary analysis of gene expression across species.
Part7: Enrichment – Functional enrichment analysis of differentially expressed genes.
Part8: Download – Access to raw data, expression matrices, and analysis results.
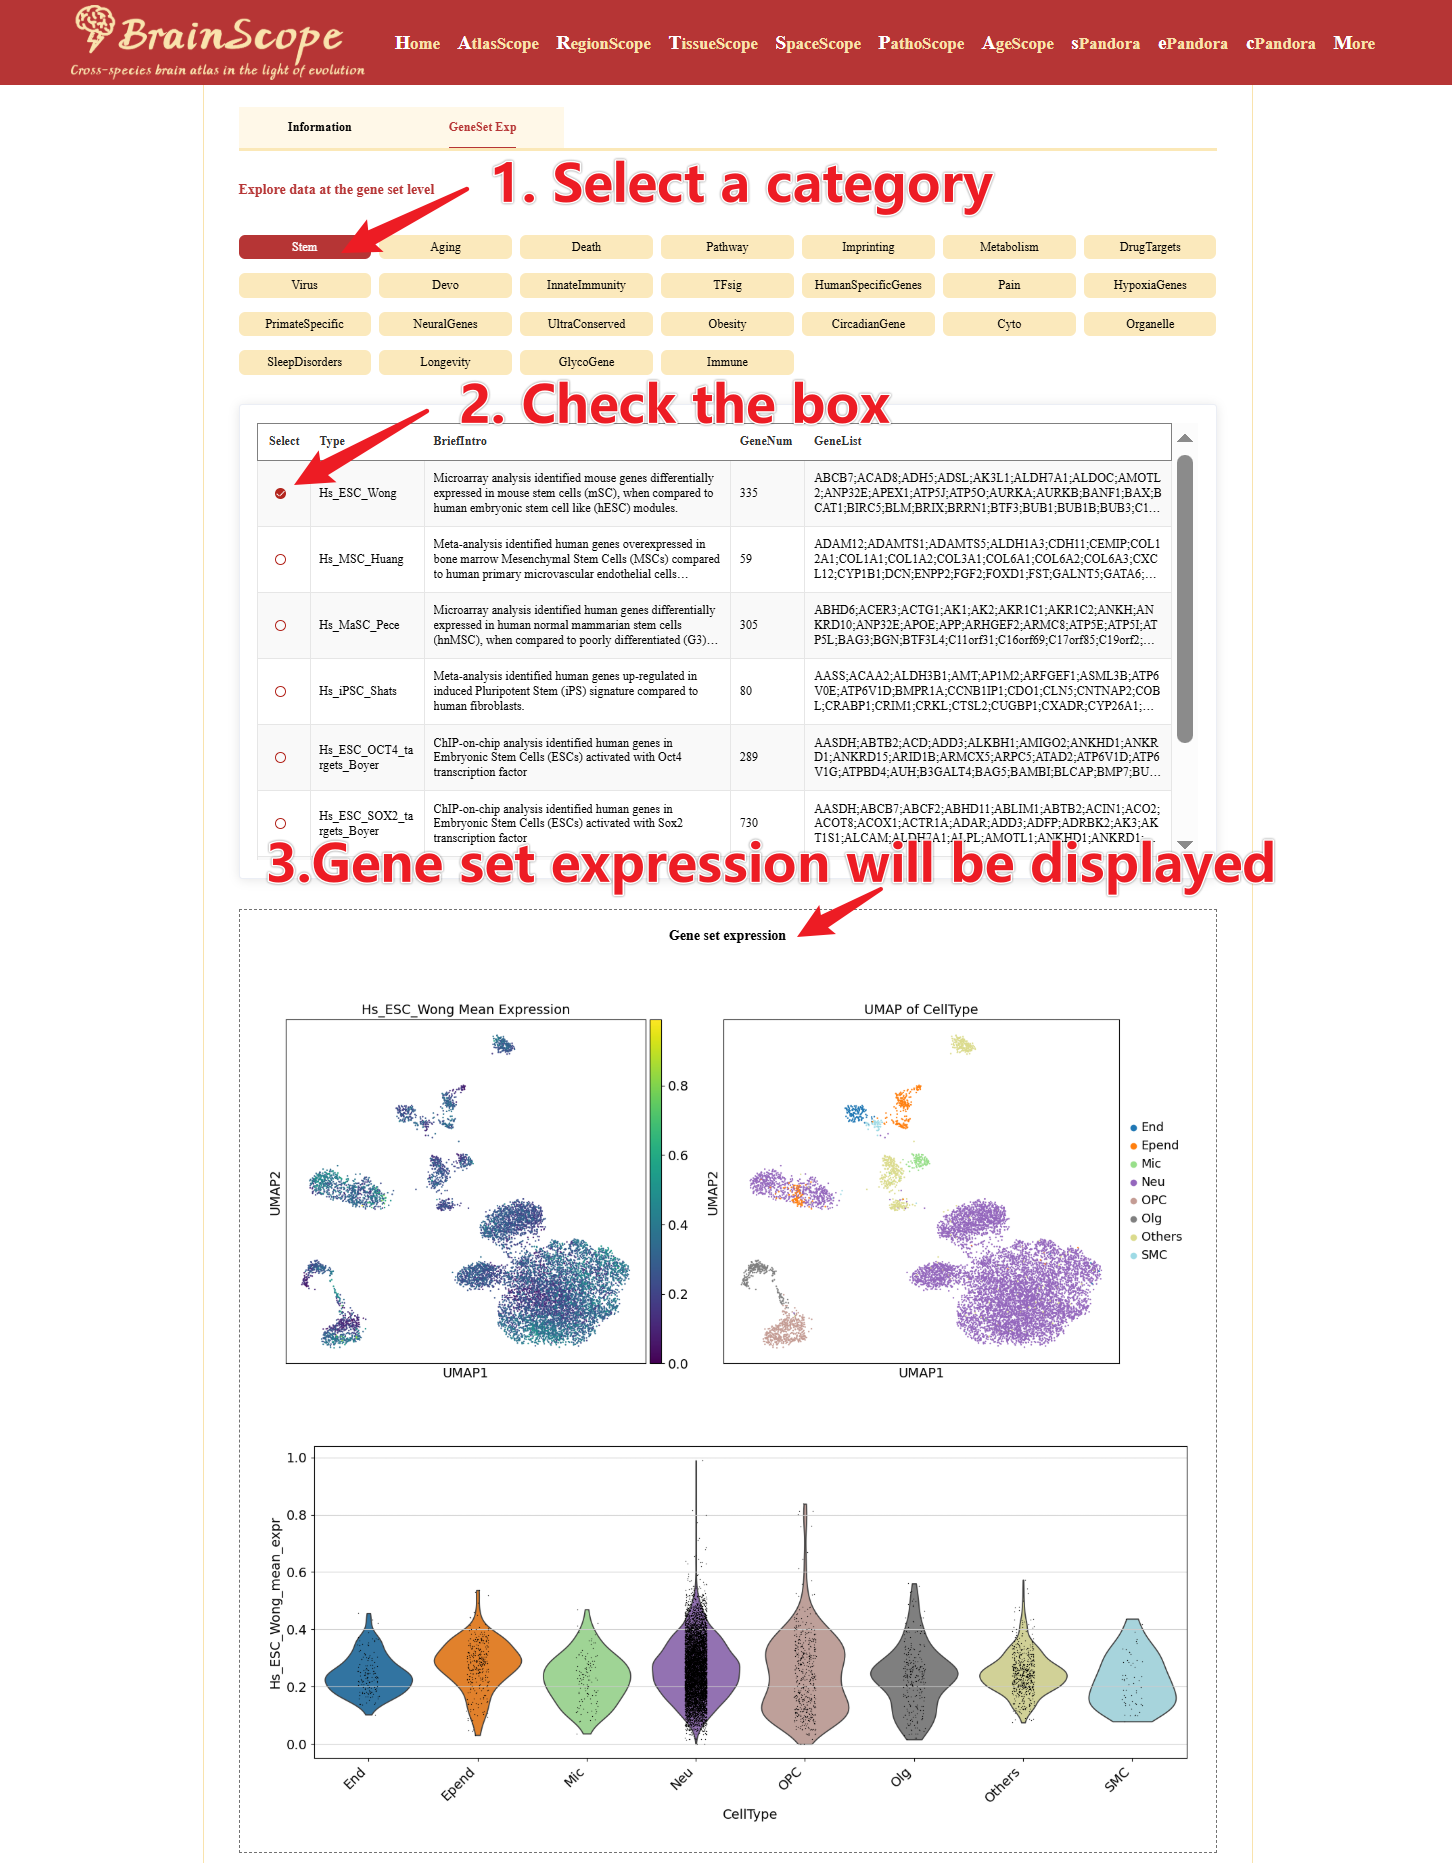
Part1: DataInfo&Gene – Gene-level expression atlas.
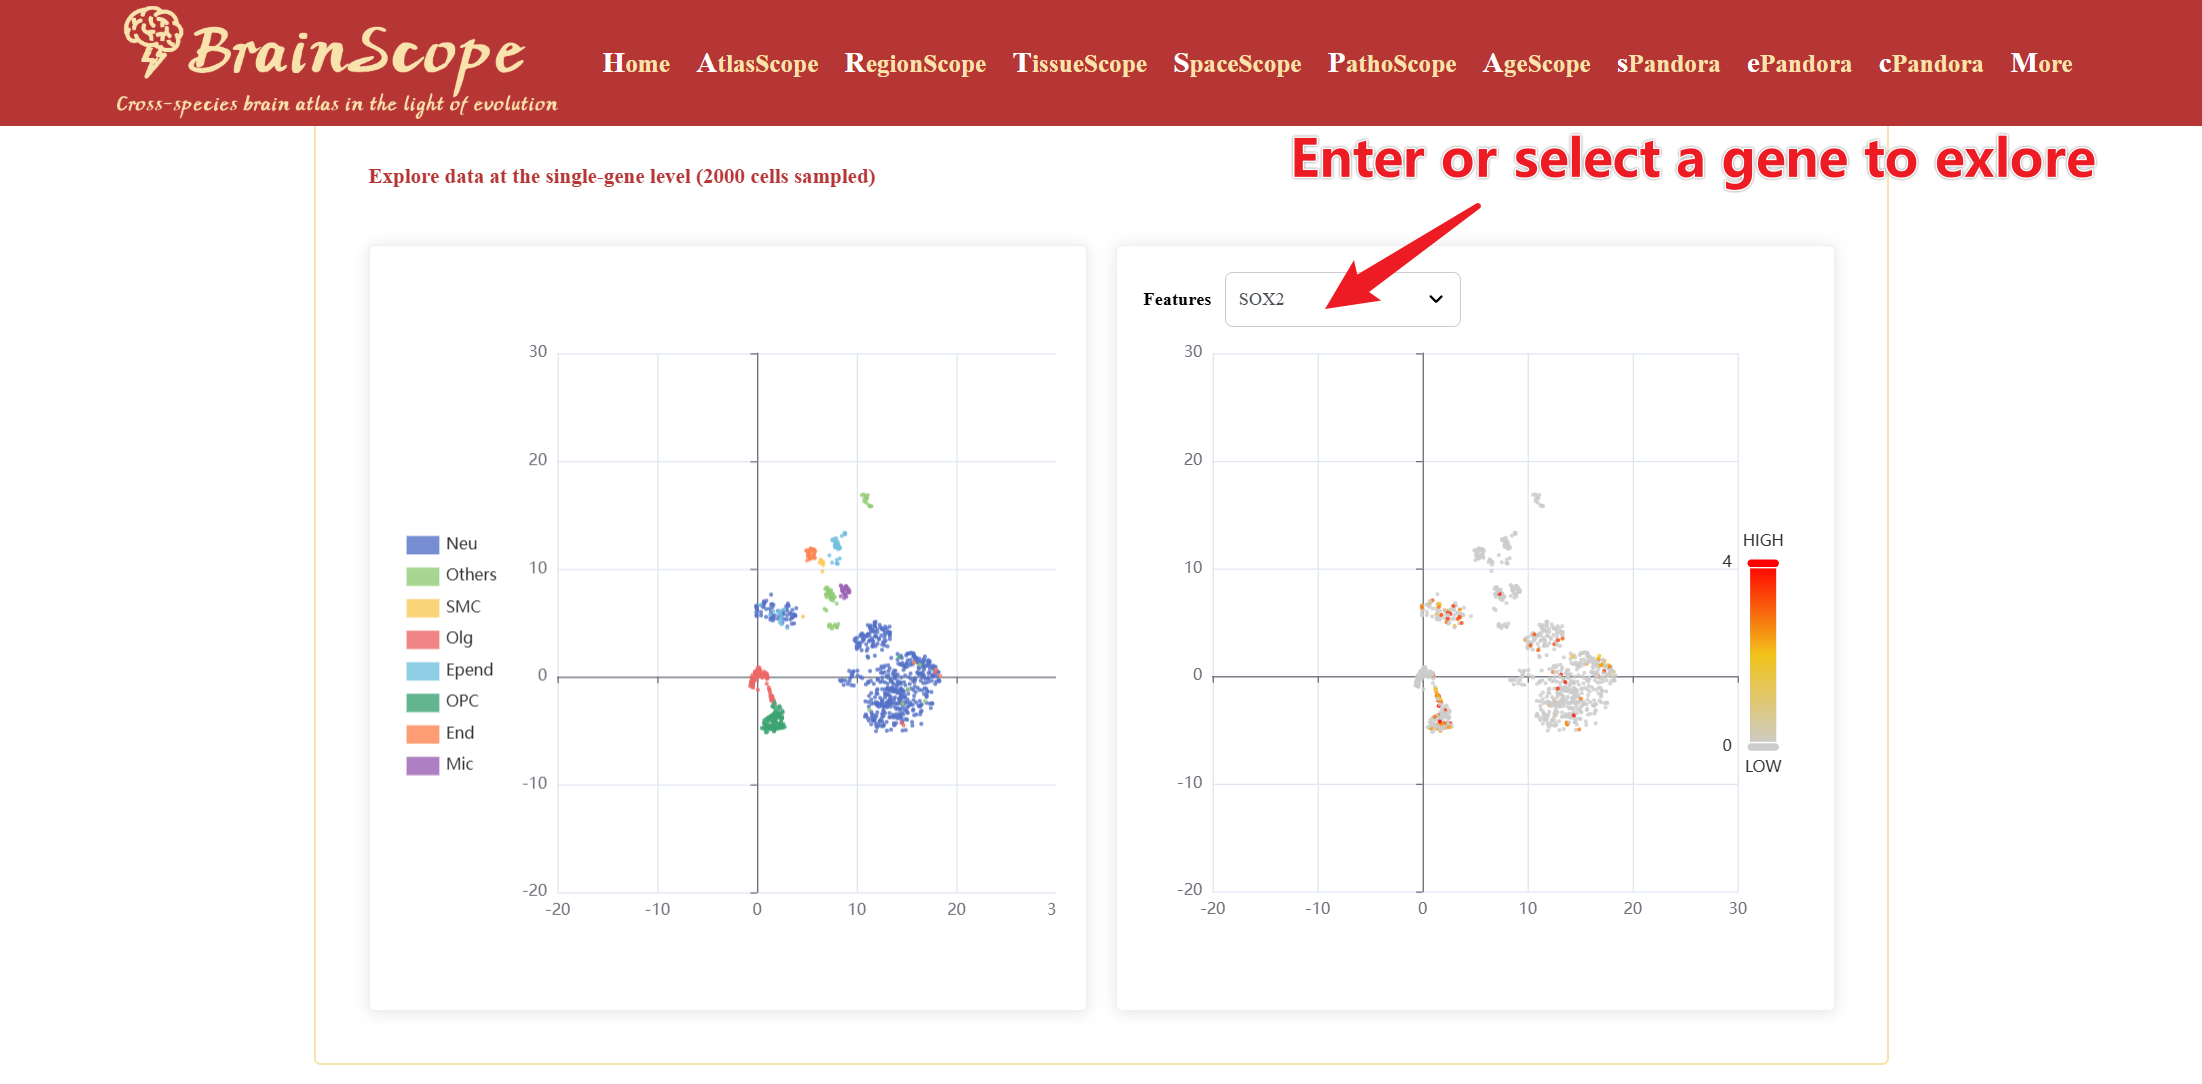
DataInfo&Gene provides an overview of the dataset’s basic information.
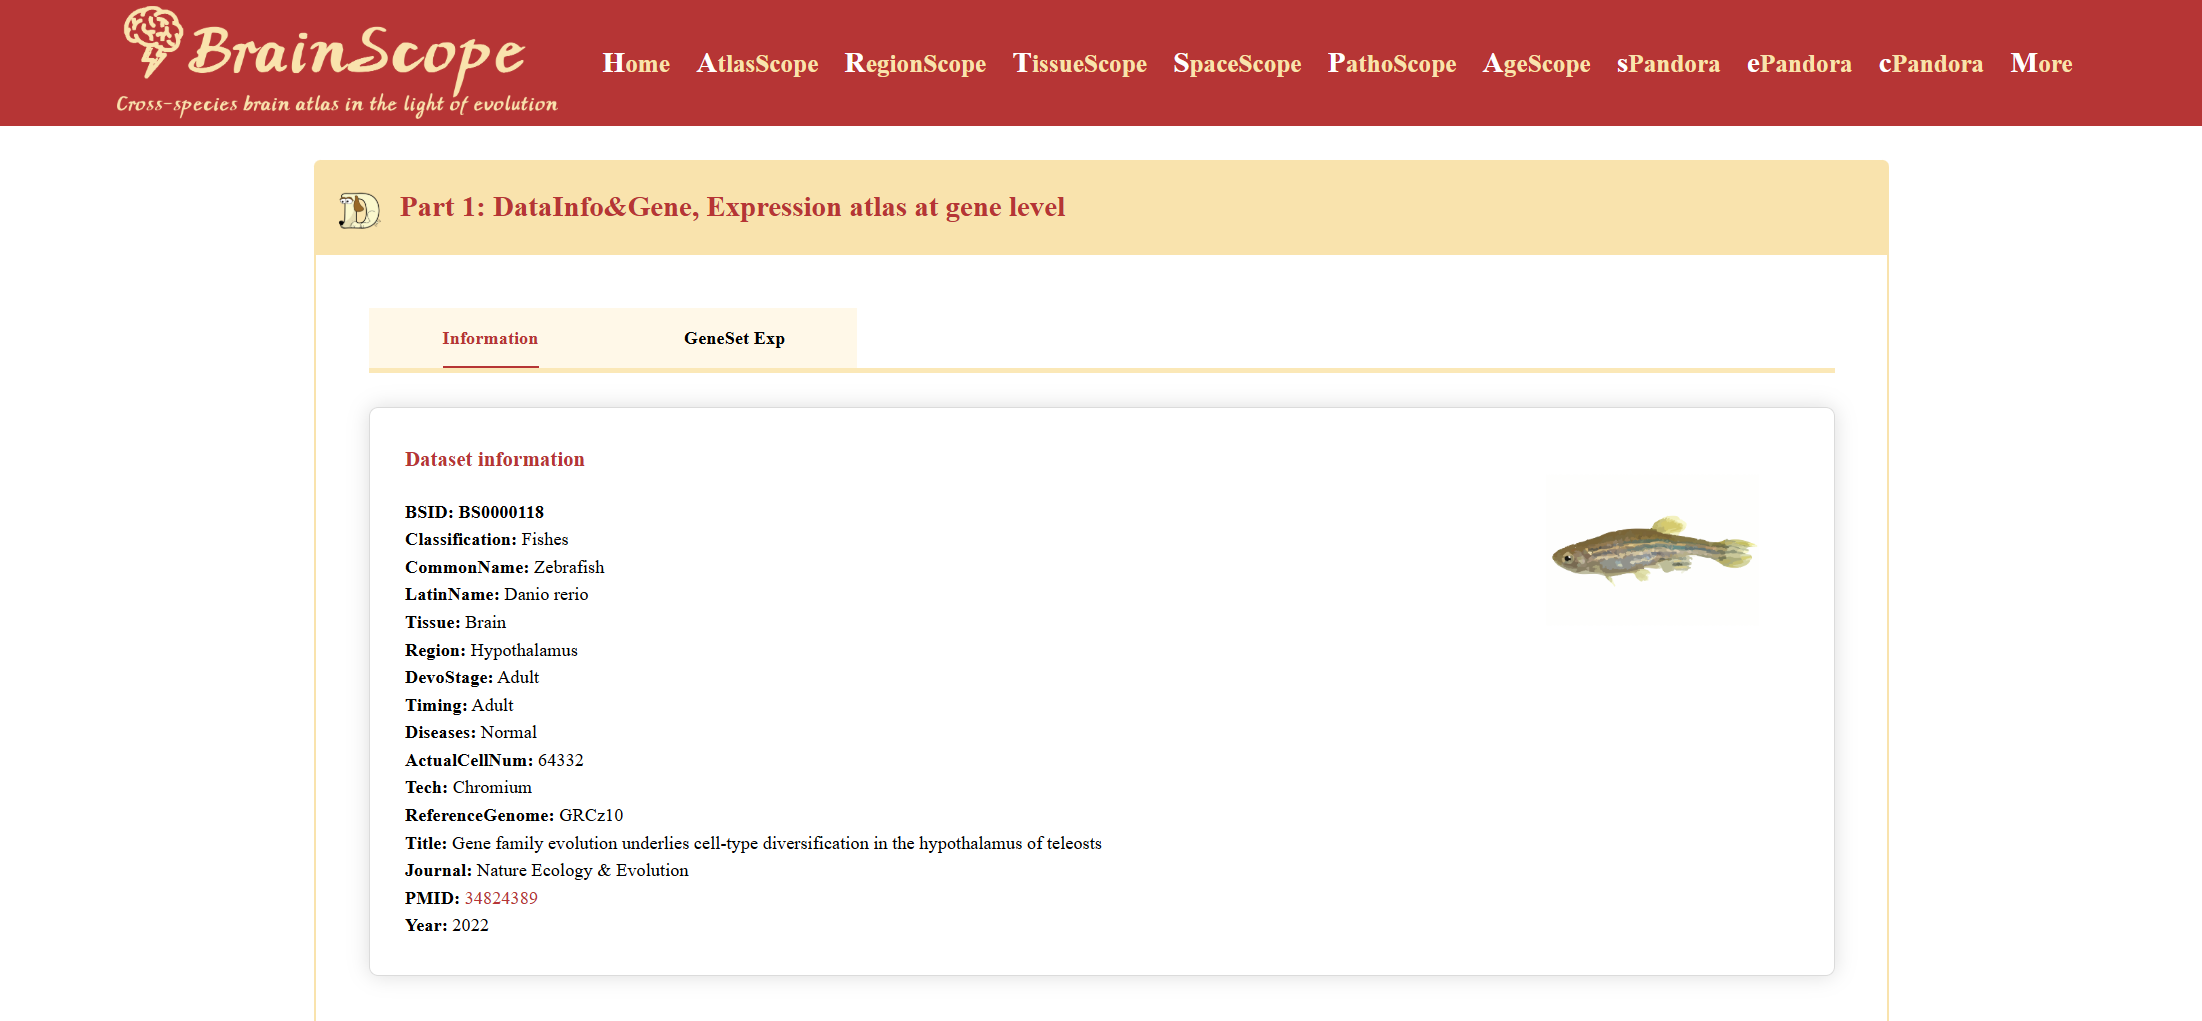
Below the information card, users can query and visualize the expression of an individual gene.
Click “GeneSet Exp”, users can explore the expression of predefined gene sets.
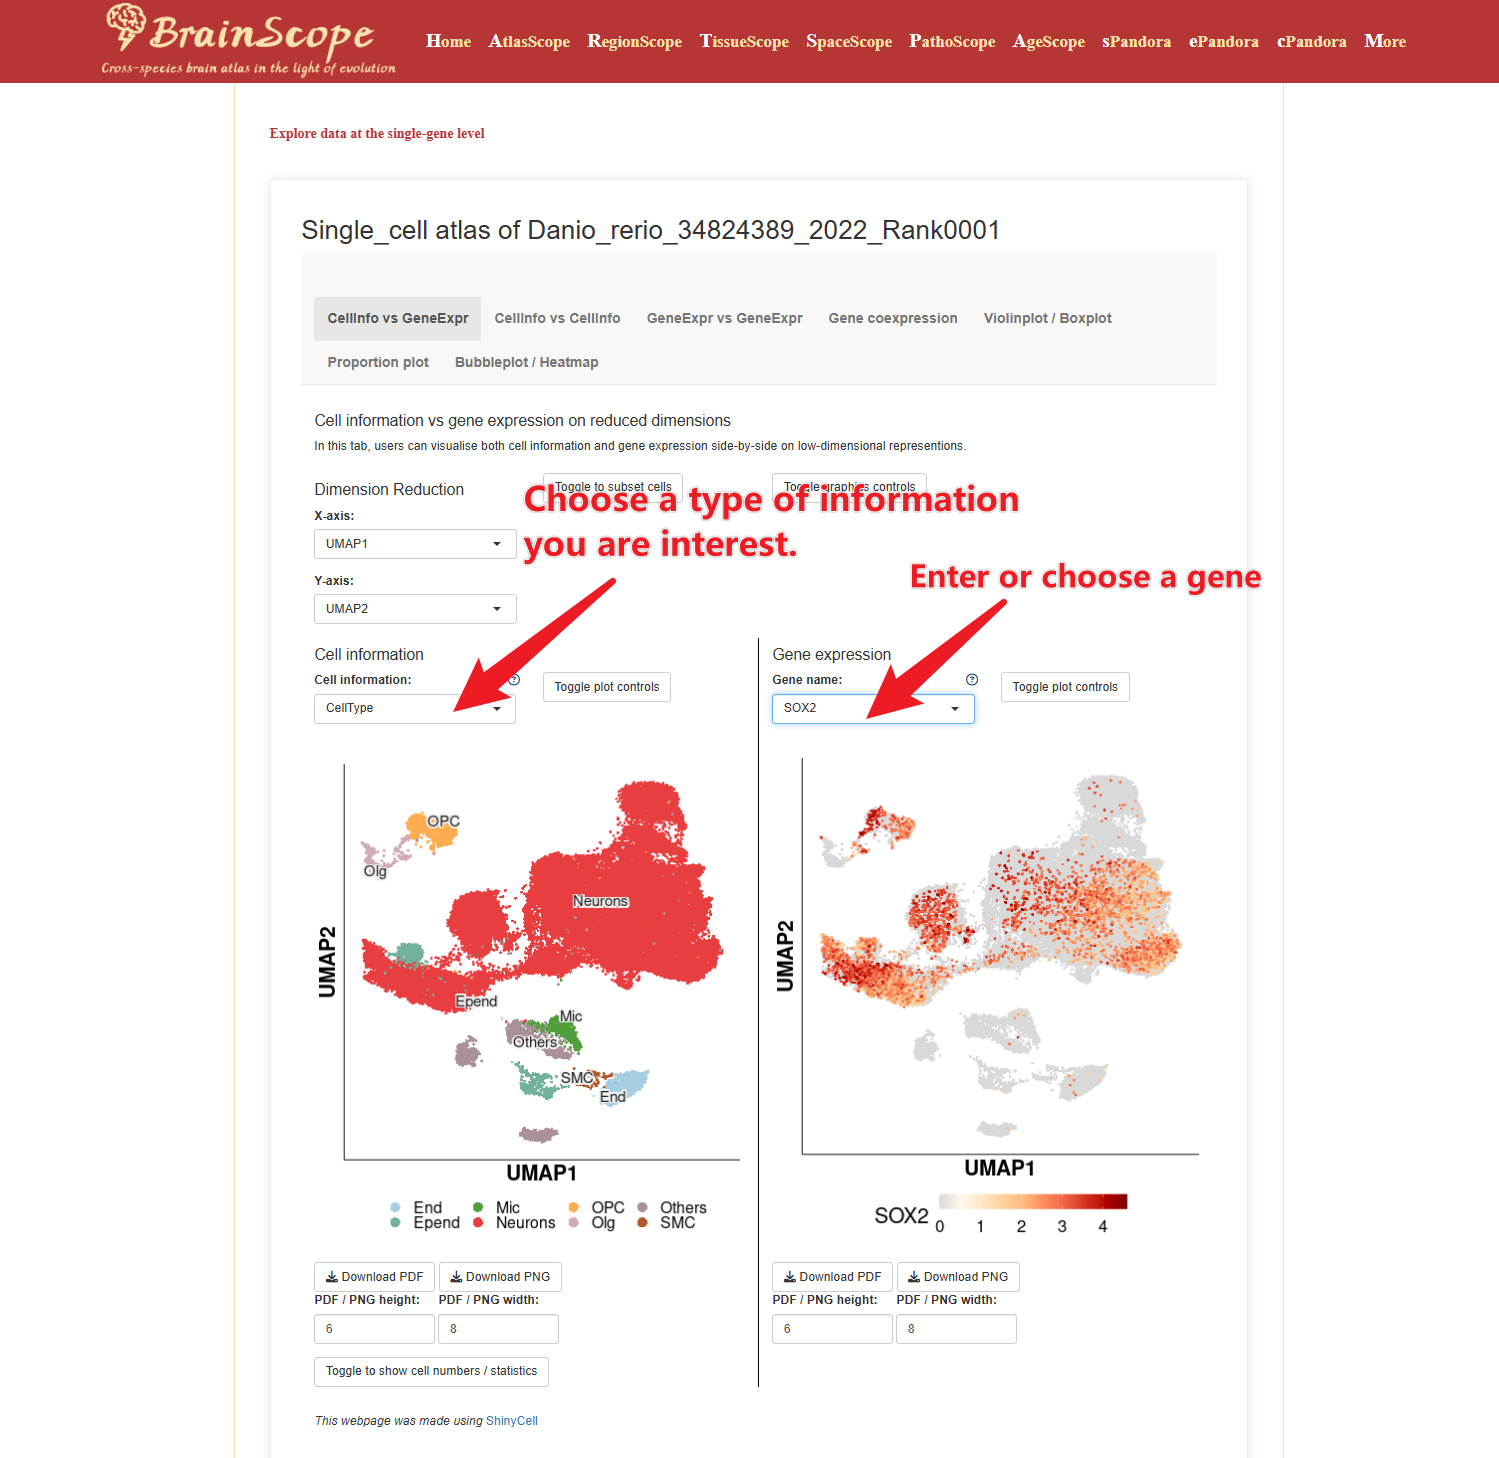
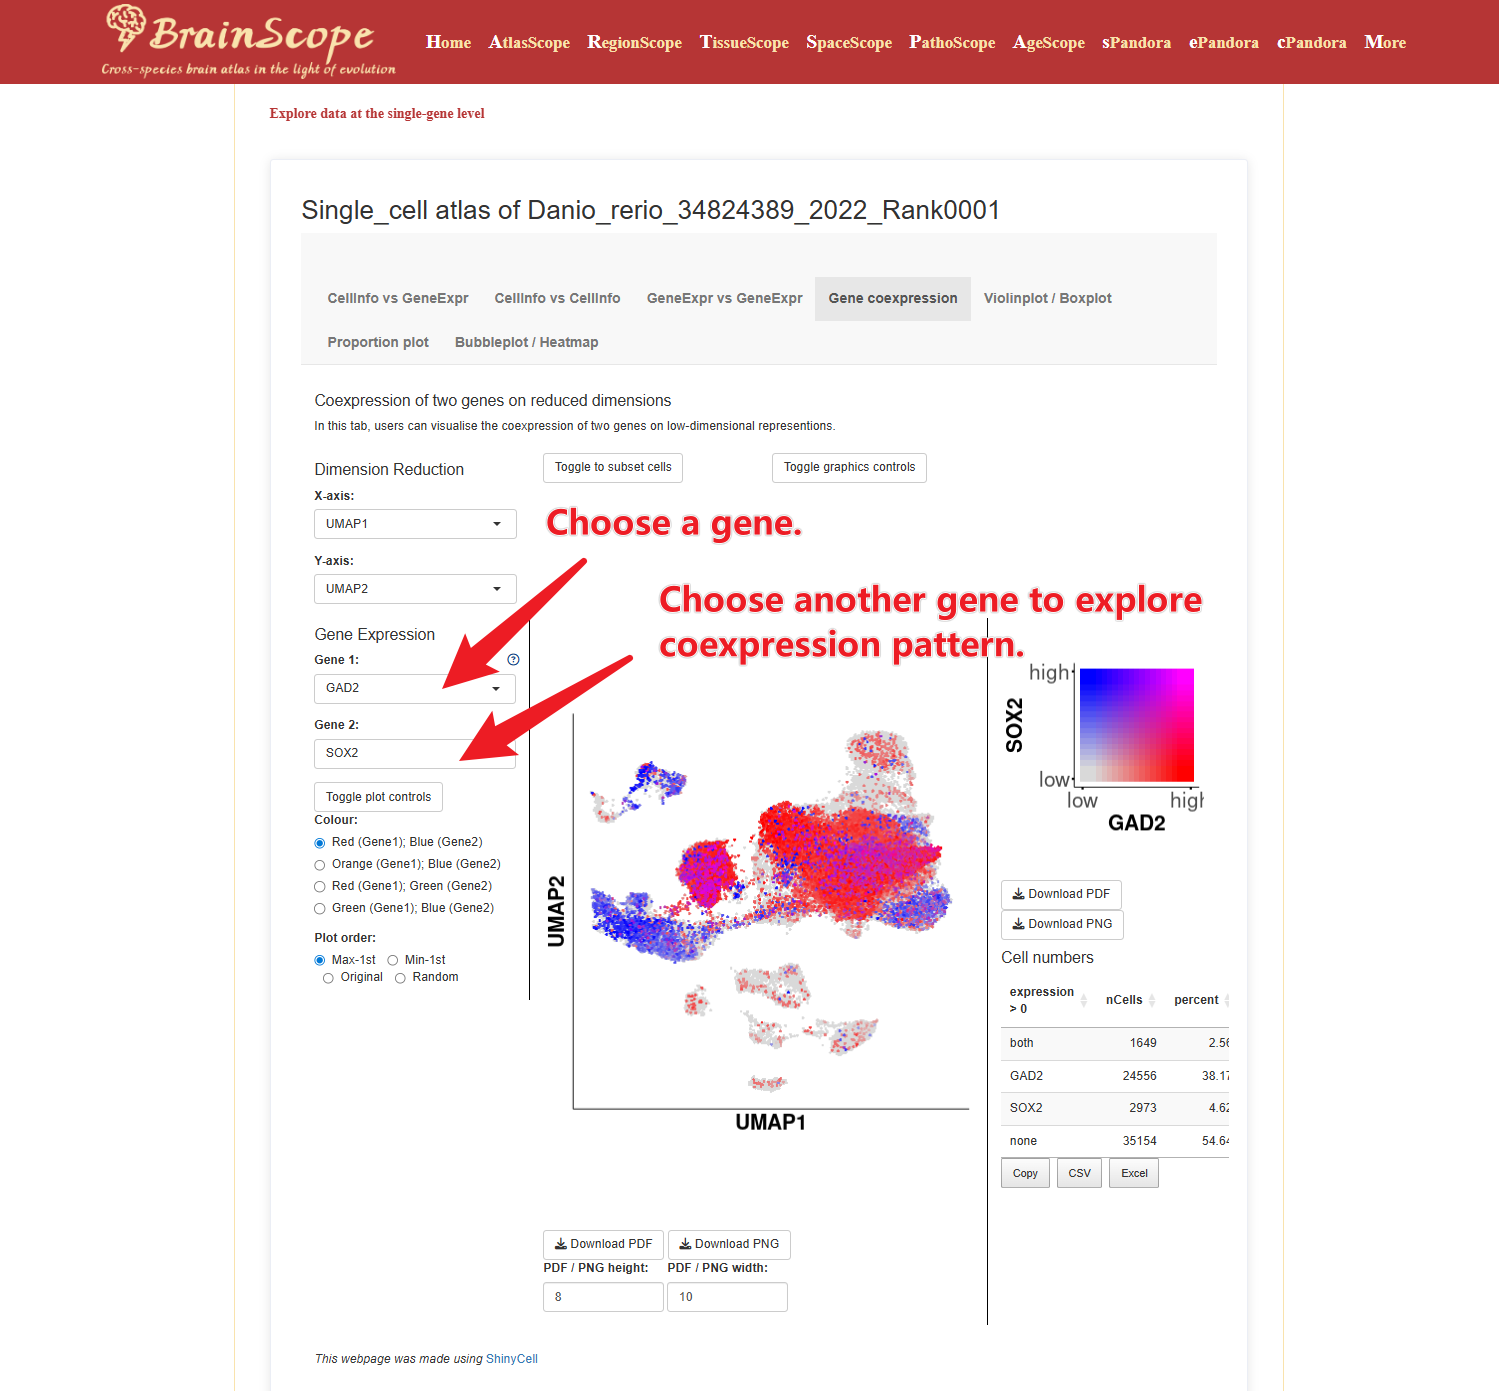
Part2: ShinyAtlas – Interactive dataset exploration using ShinyCell.
ShinyAtlas allows users to dynamically explore and compare data using the ShinyCell interface. This tool offers multiple data visualization and comparison options.
CellInfo vs GeneExpr – Analyze the relationship between cellular attributes (e.g., brain region) and the expression of a selected gene.
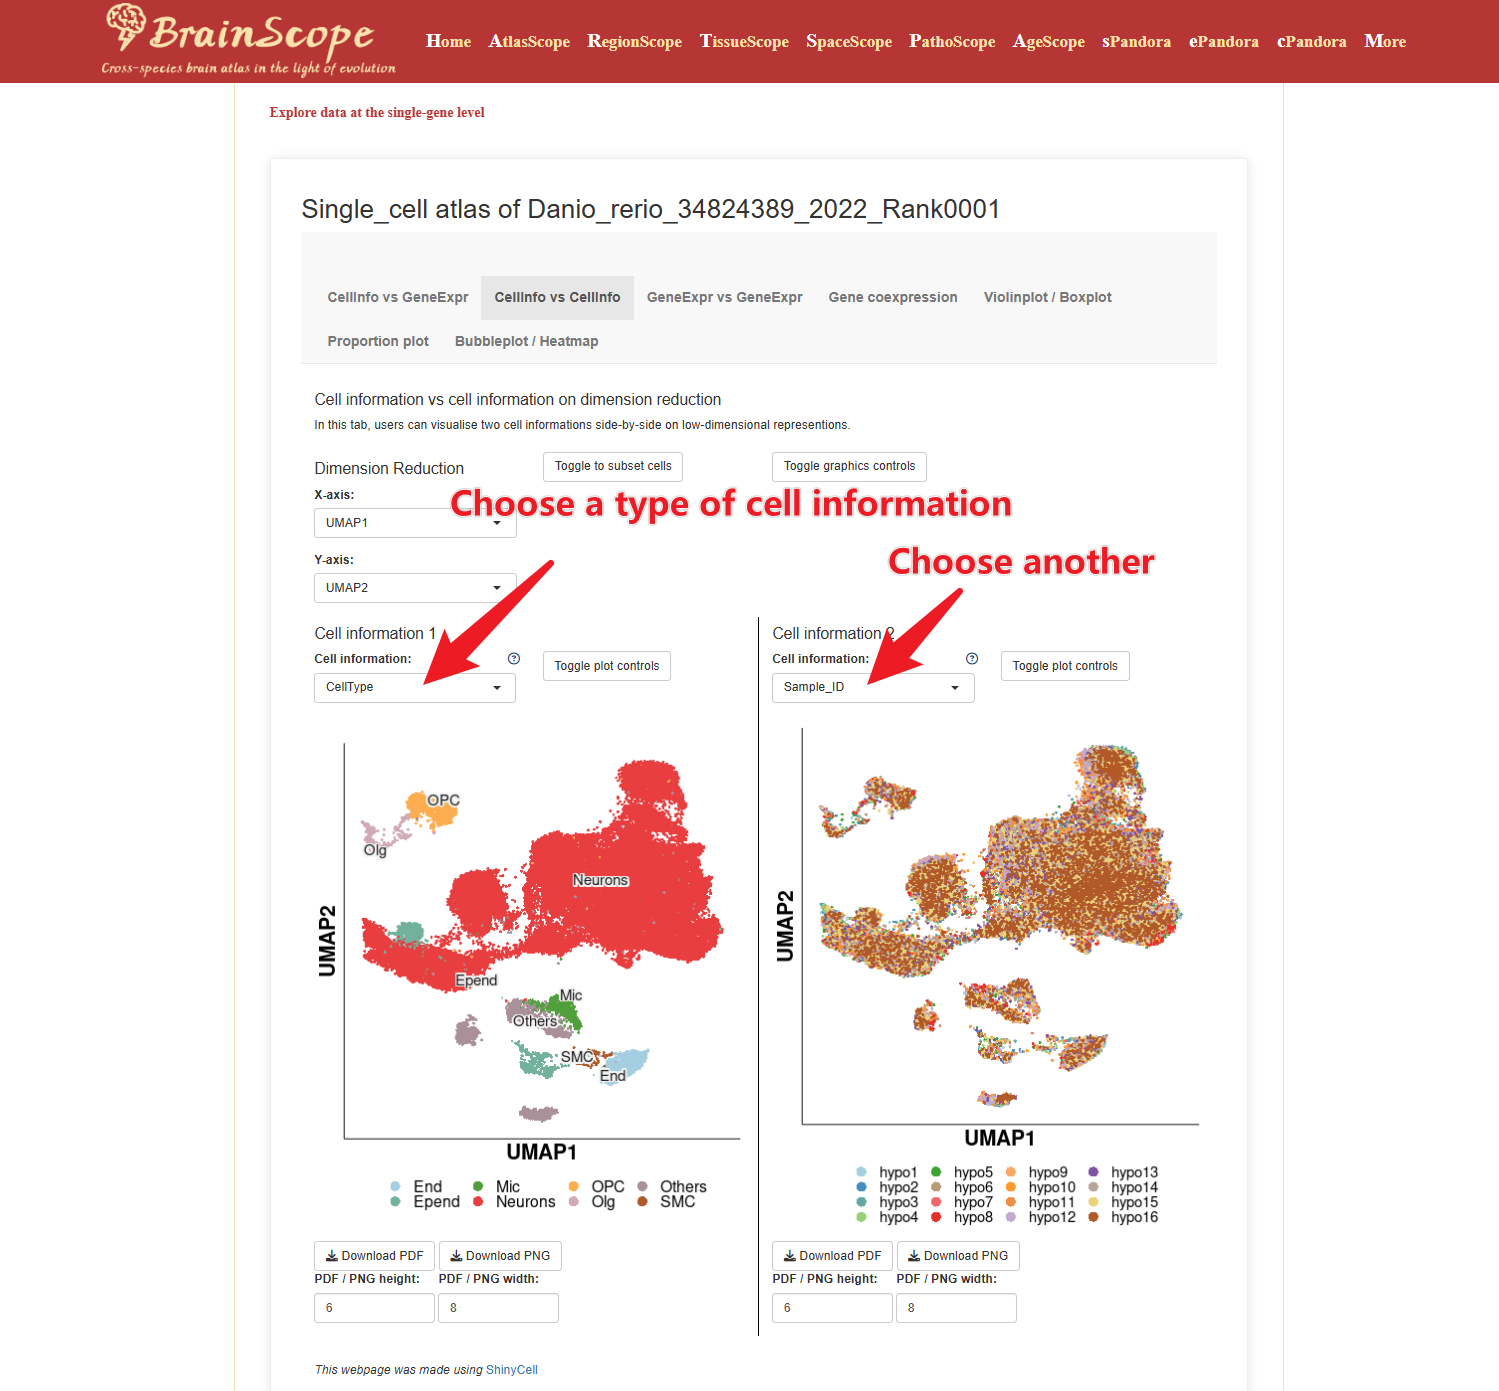
CellInfo vs CellInfo – Compare two cellular attributes, such as brain region and the number of expressed genes.
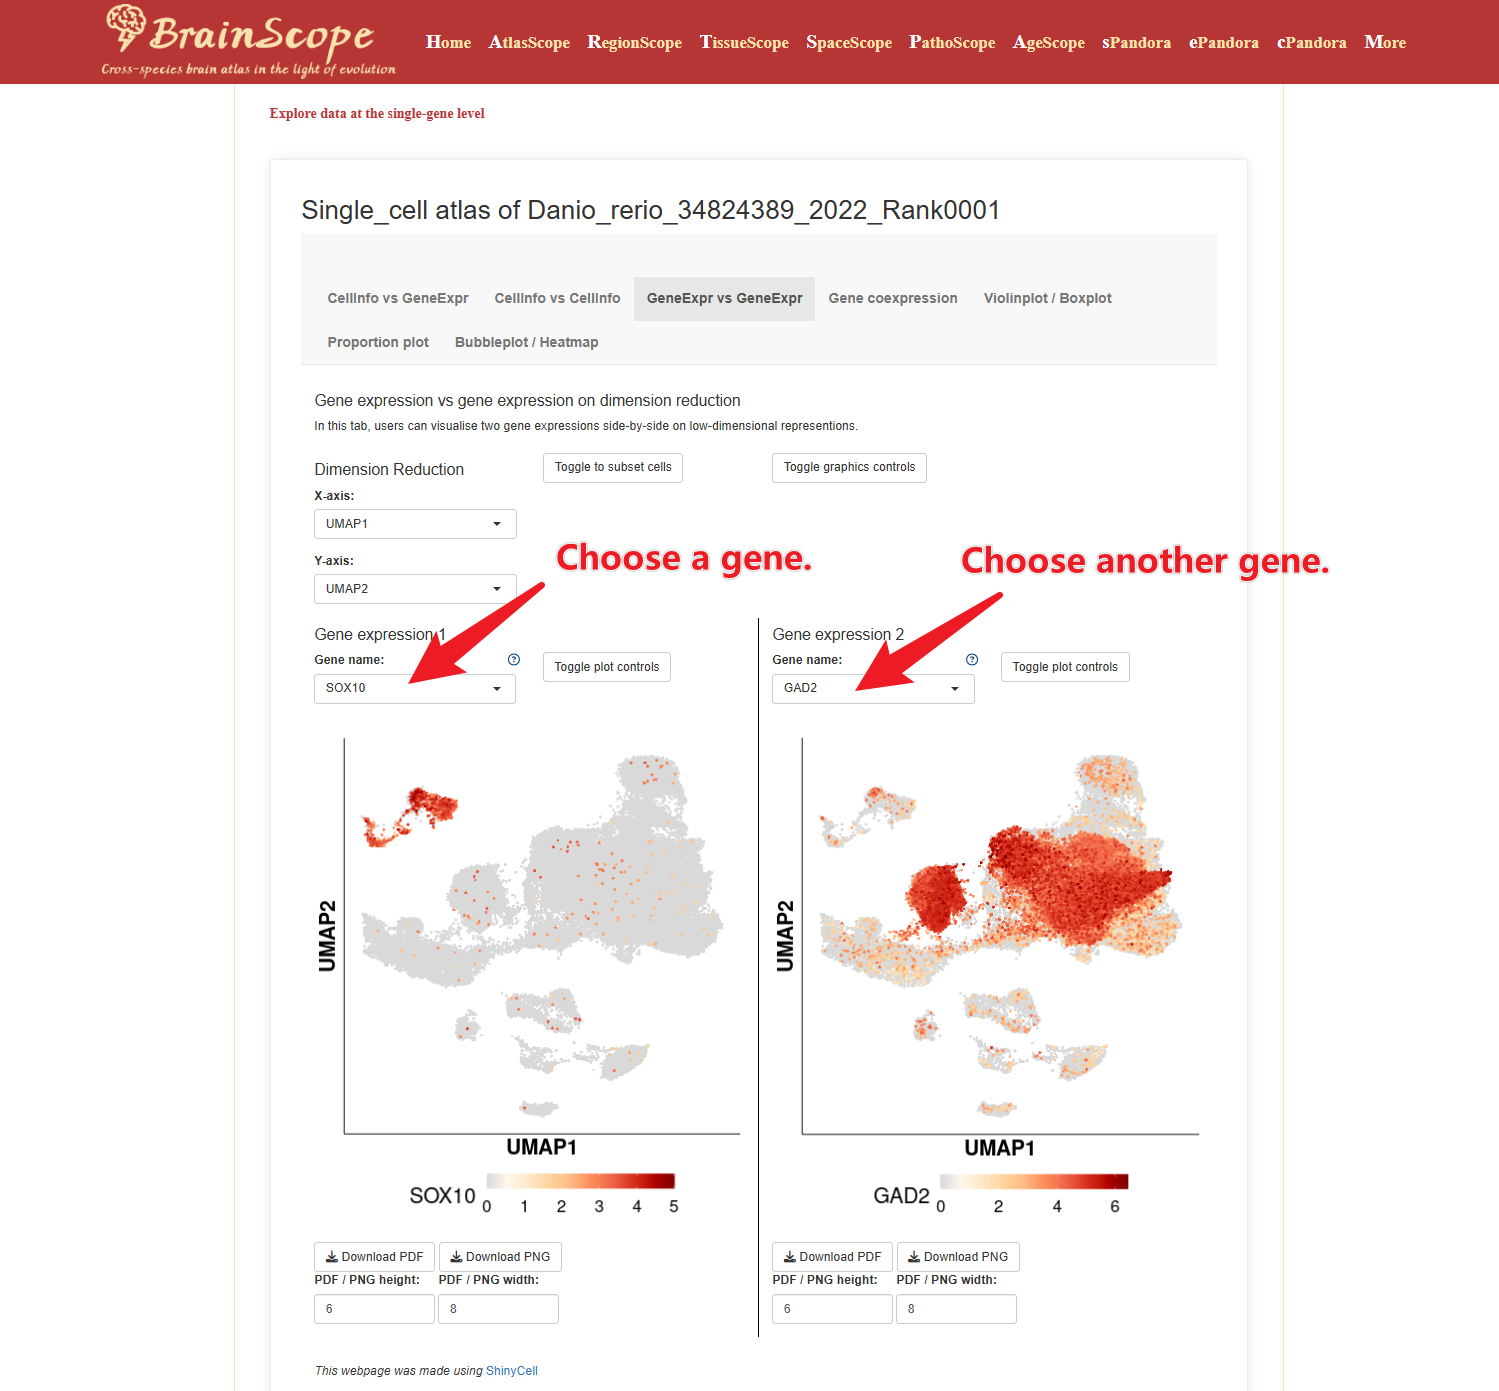
GeneExpr vs GeneExpr – Compare the expression patterns of two genes.
Gene Coexpression – Examine the coexpression relationships between genes.
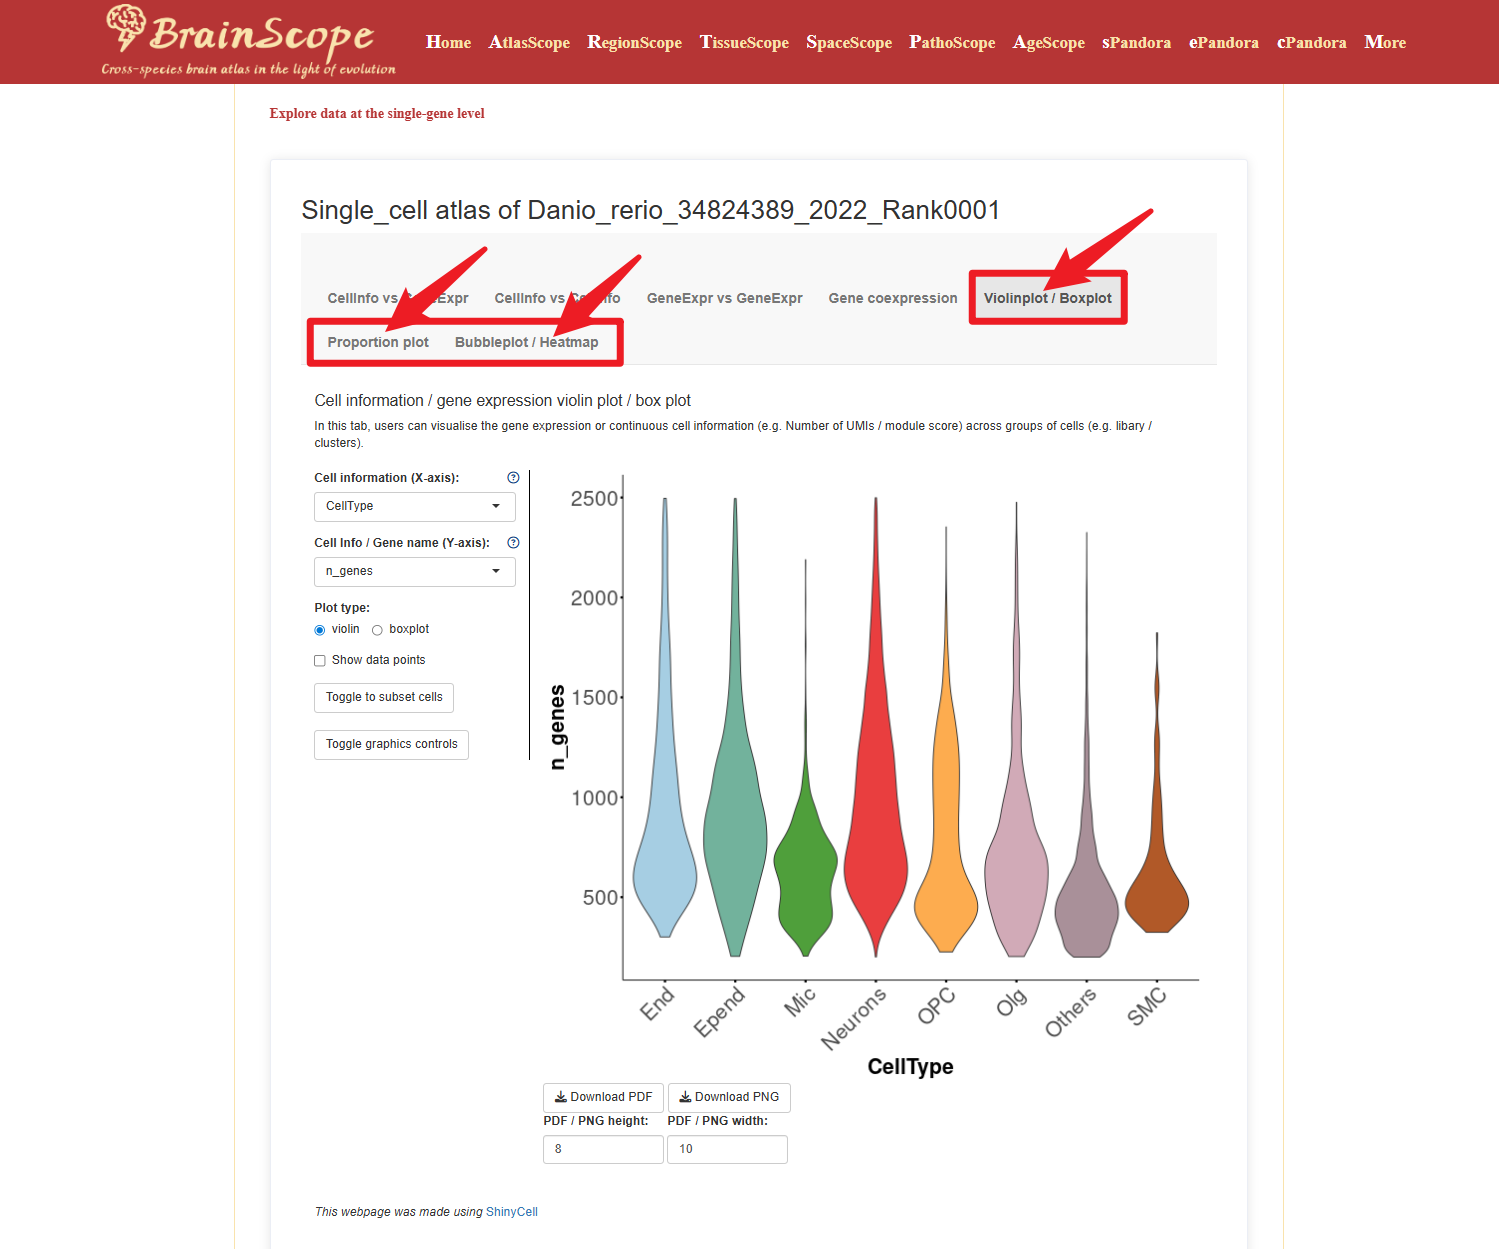
Visualization Options: Users can choose from various visualization methods, including violin plots, stacked plots, and bubble plots, to represent the data effectively.
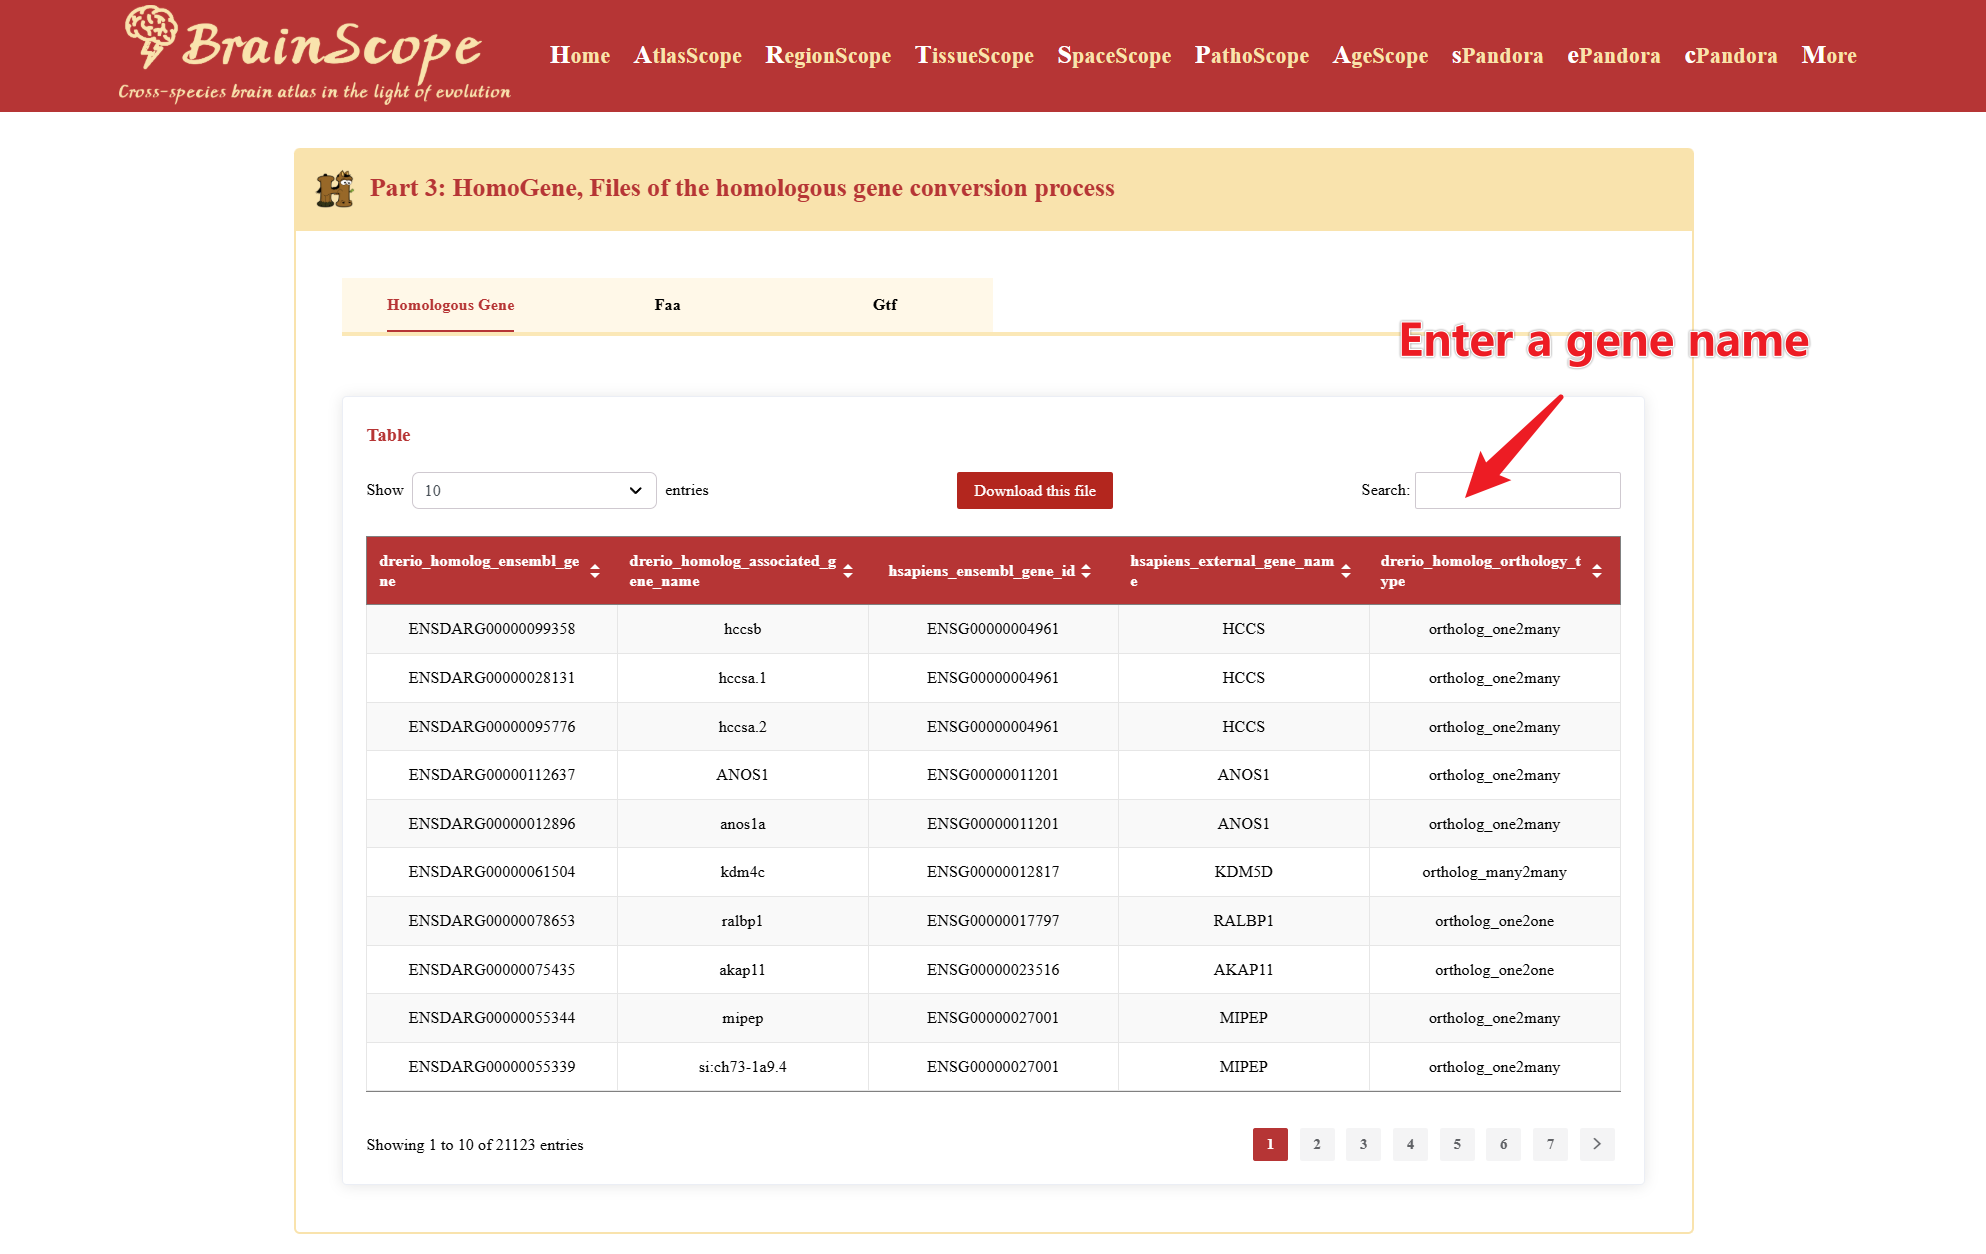
Part3: HomoGene – Homologous gene conversion files
The HomoGene section provides a reference for identifying homologous genes between the selected species and humans.
Use the search bar to find homologs of a gene of interest.
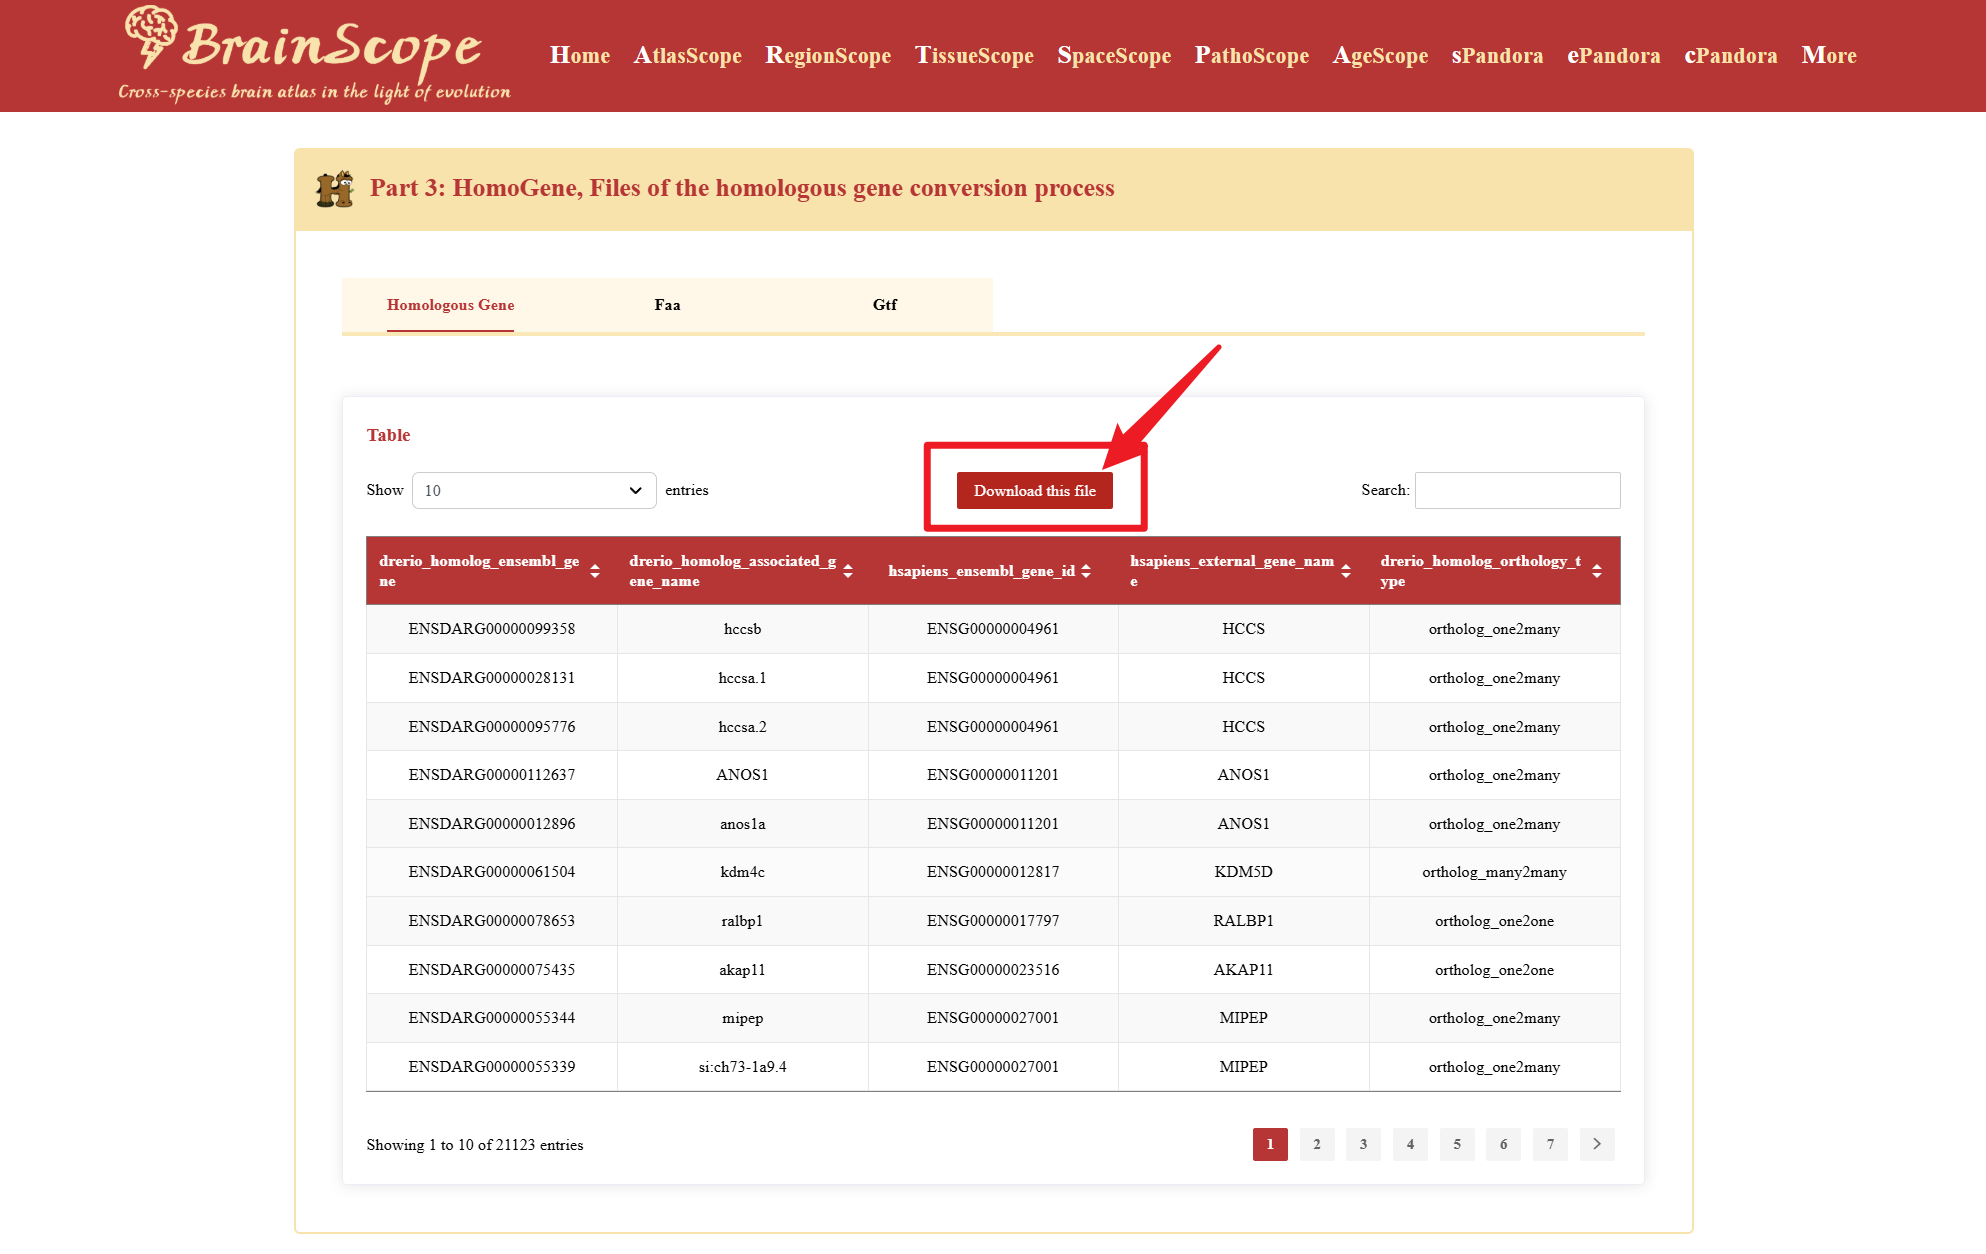
Access reference genomes and gene annotation files for the selected species.
Easily download the files by clicking the download pink button, if possible.
Part4: GeneSets&TF – Association networks inferred from transcriptomic data
This section provides insights into transcription factor (TF) associations with 25 predefined gene sets.
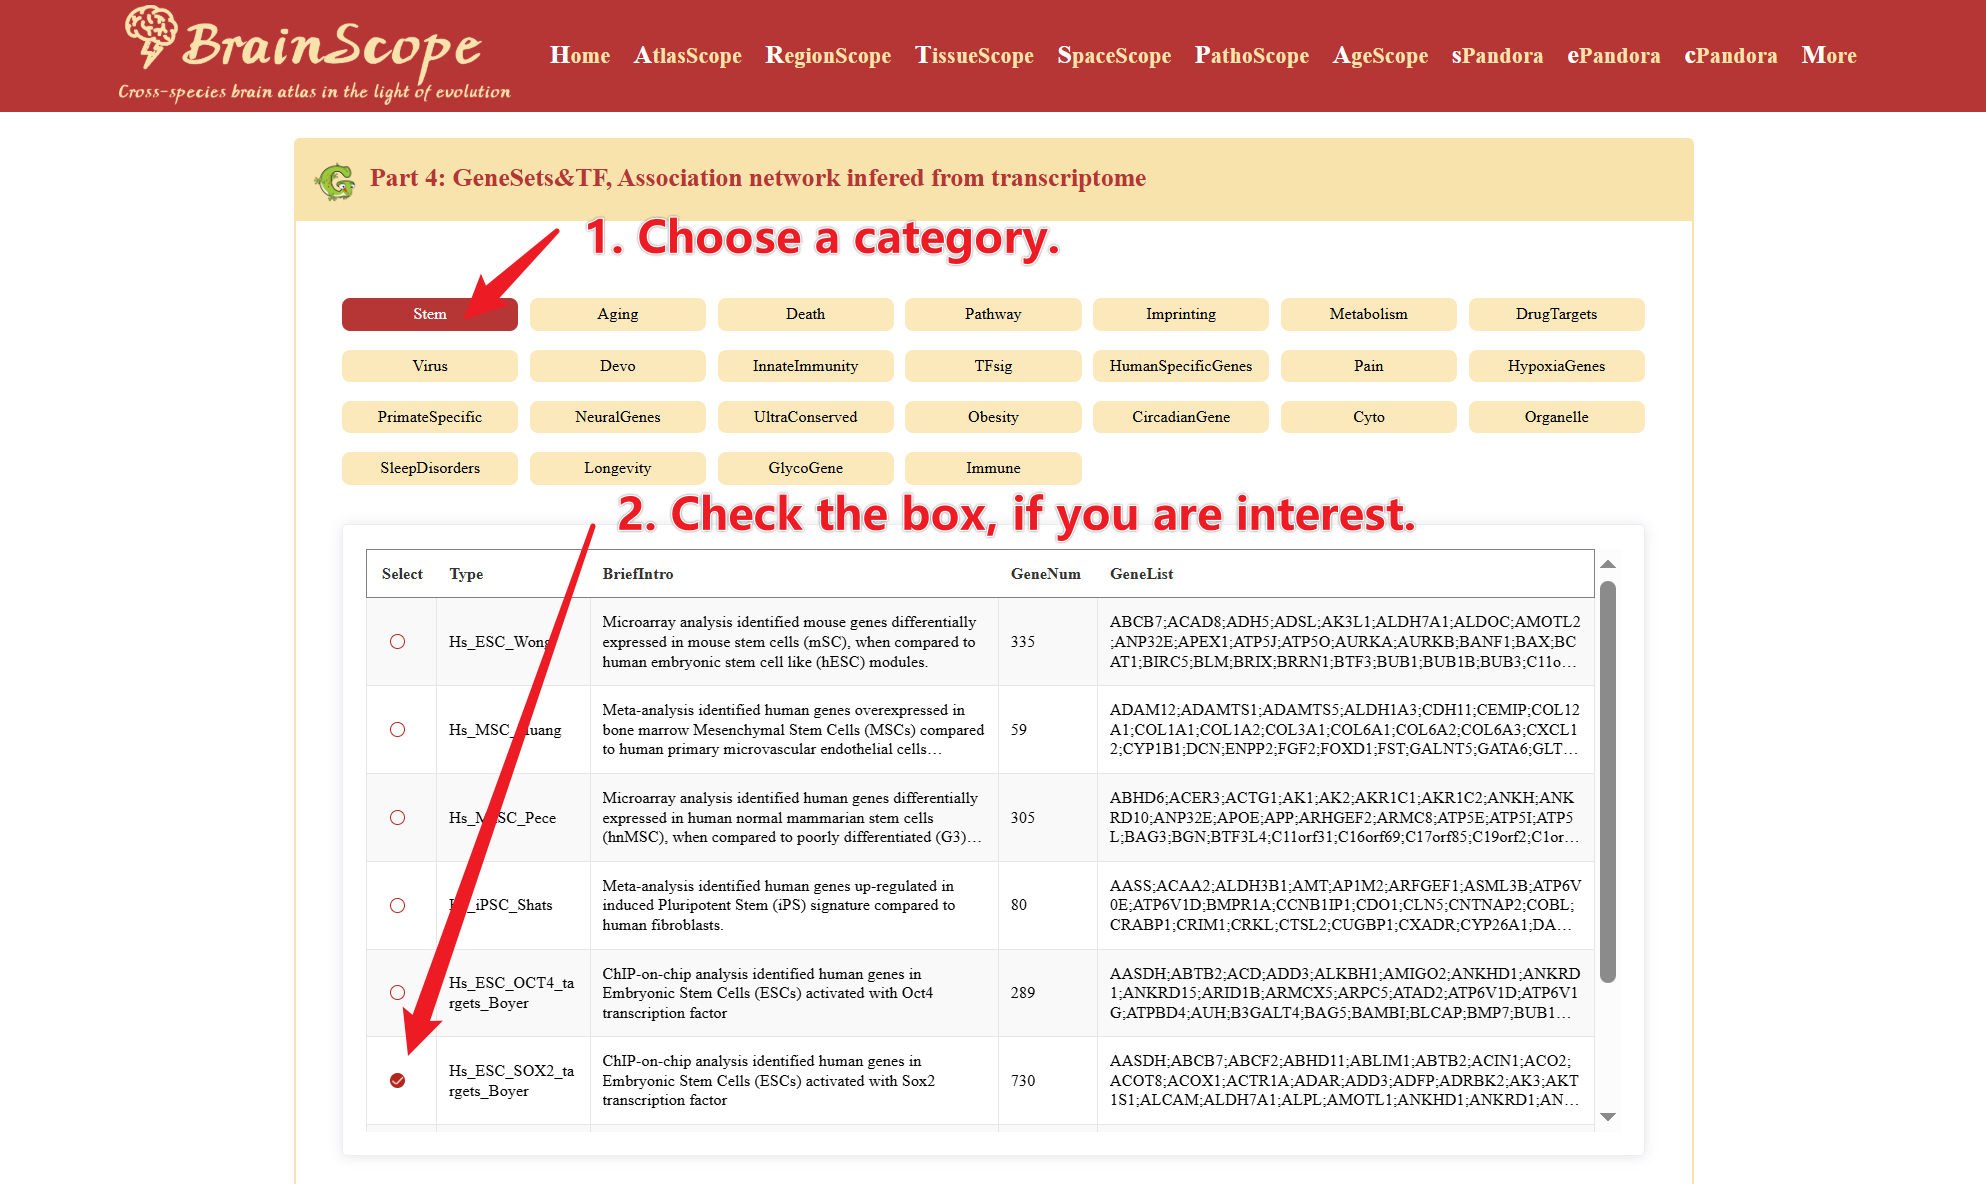
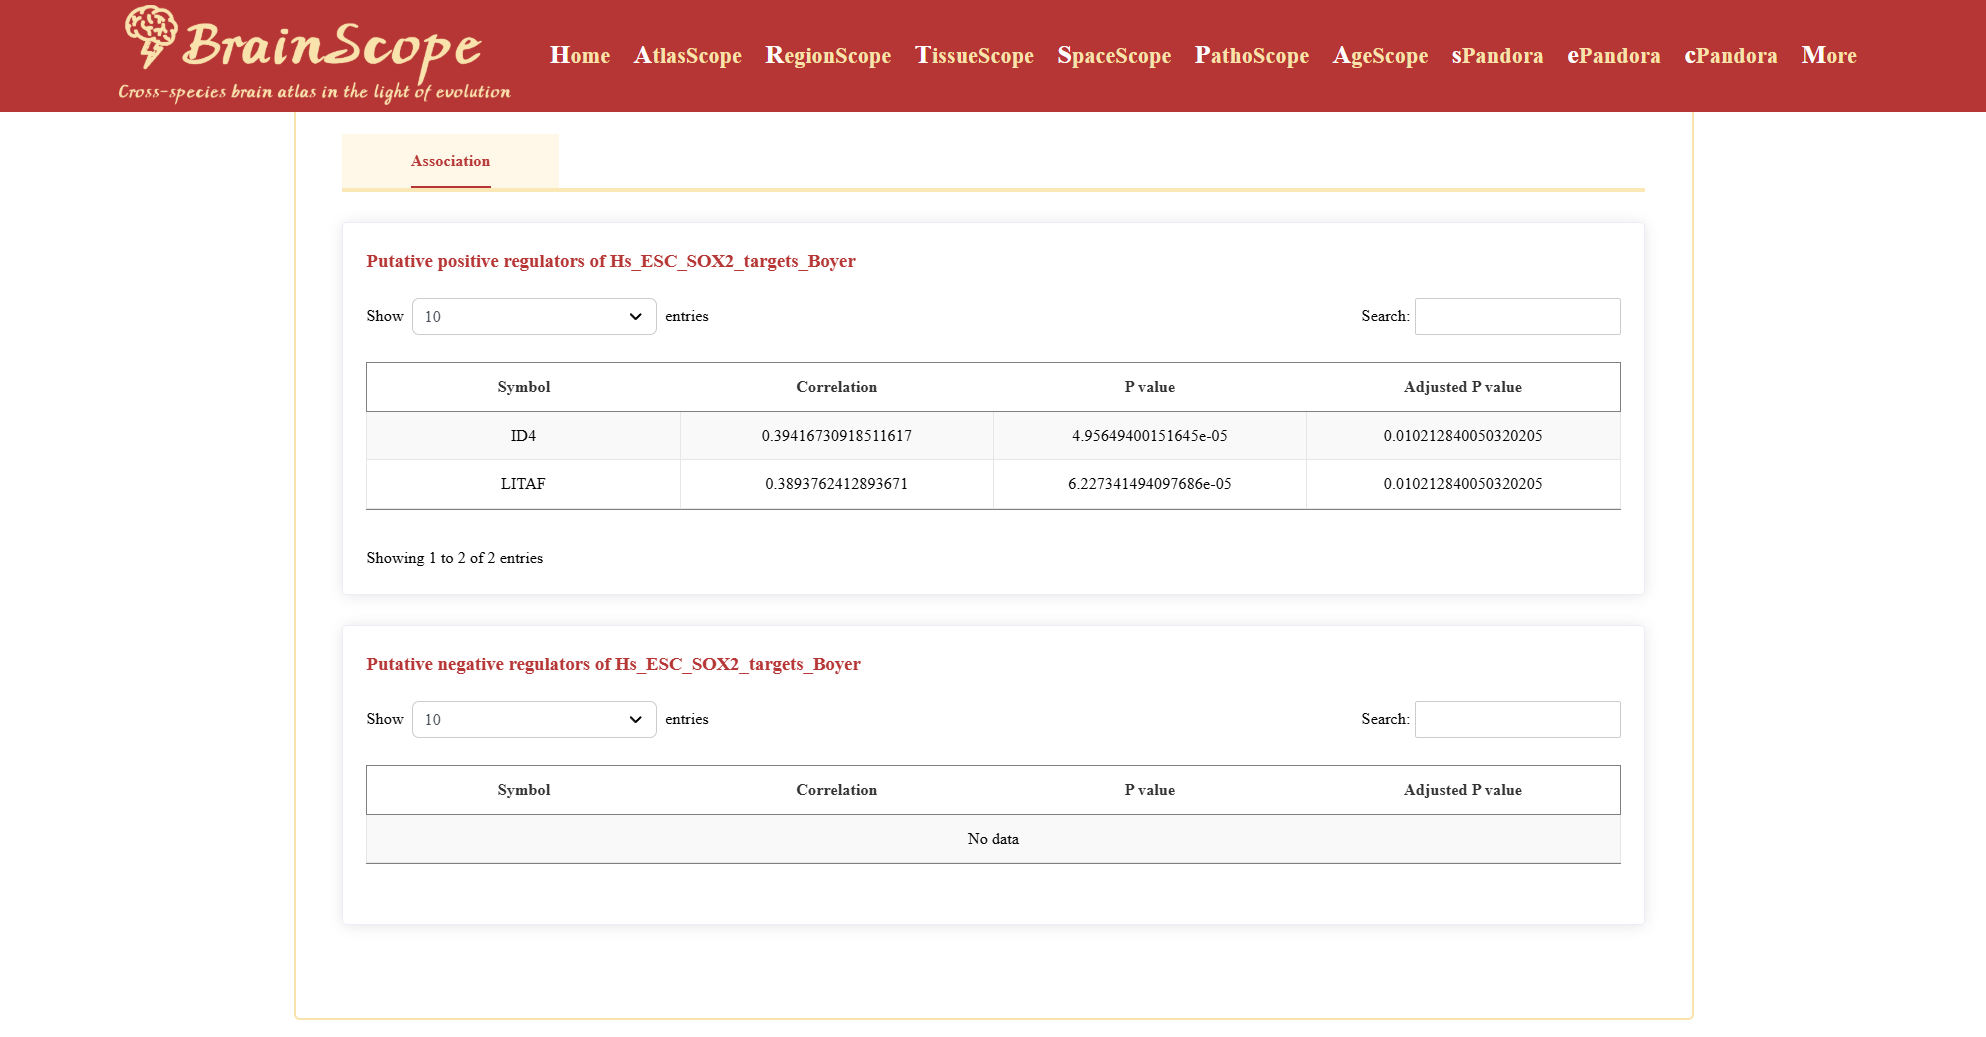
This section provides a list of transcription factors (TFs) that may regulate the selected gene set, categorized as: Putative Positive Regulators and Putative Negative Regulators. Table includes Symbol (TF name), Corretion value, P-value, Adjusted P-value.
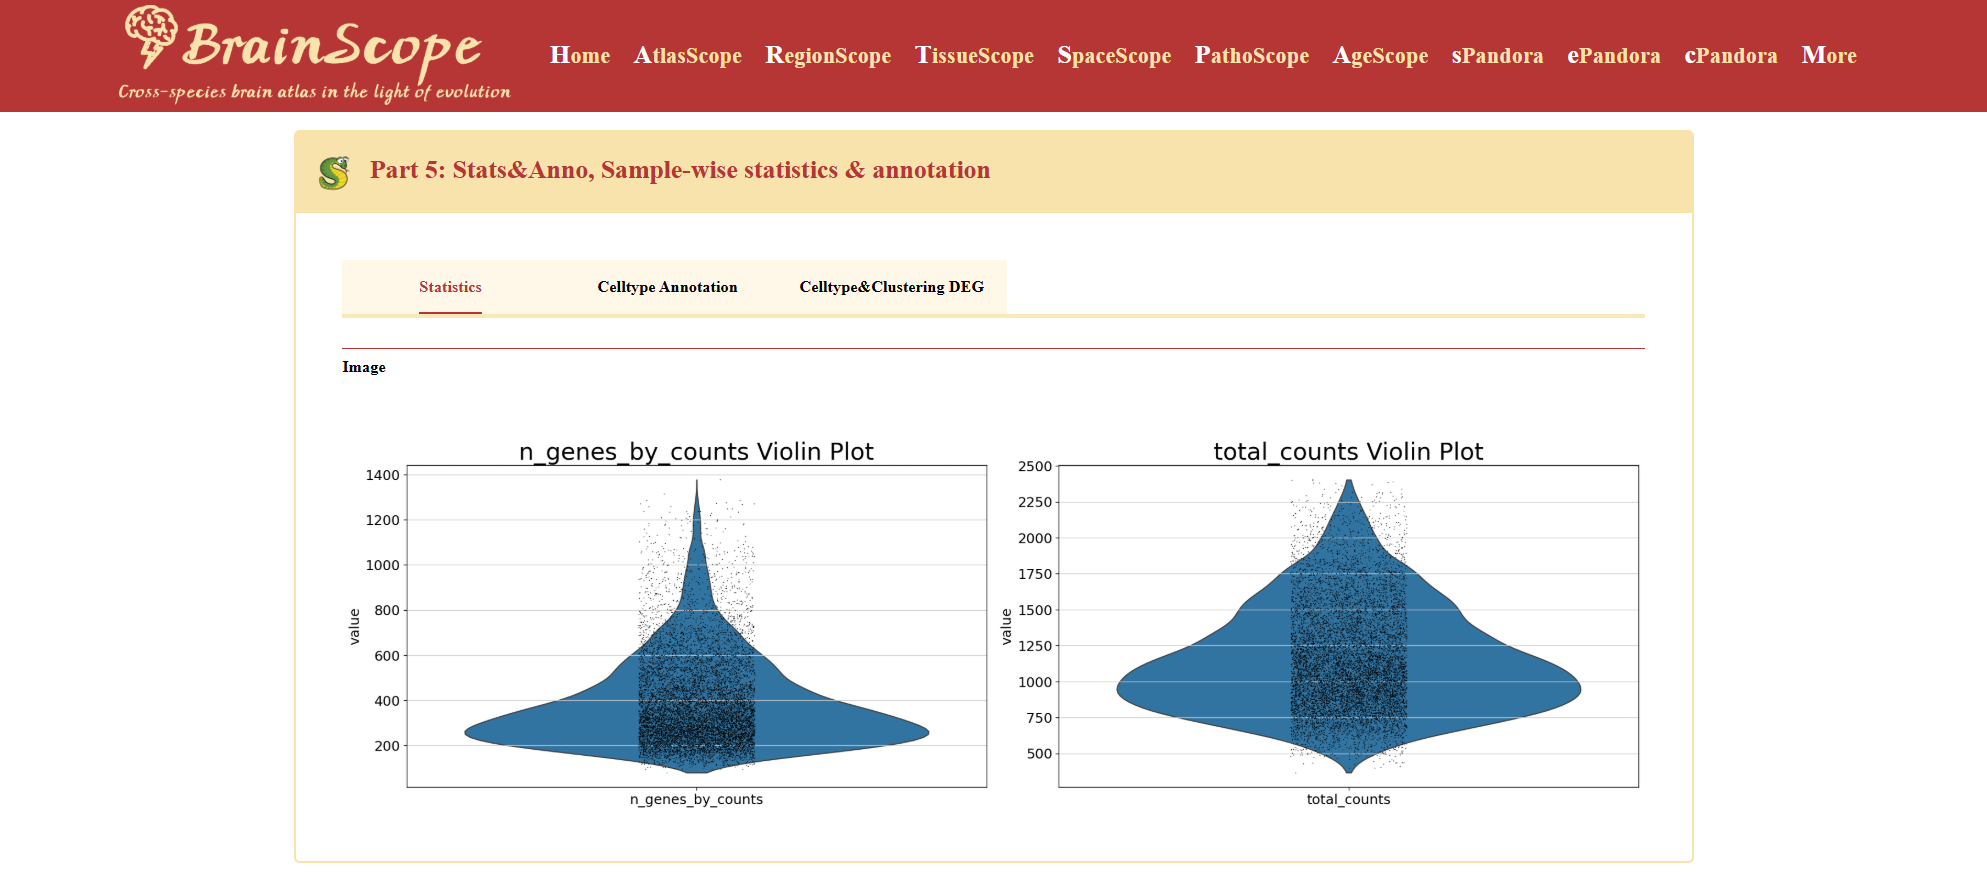
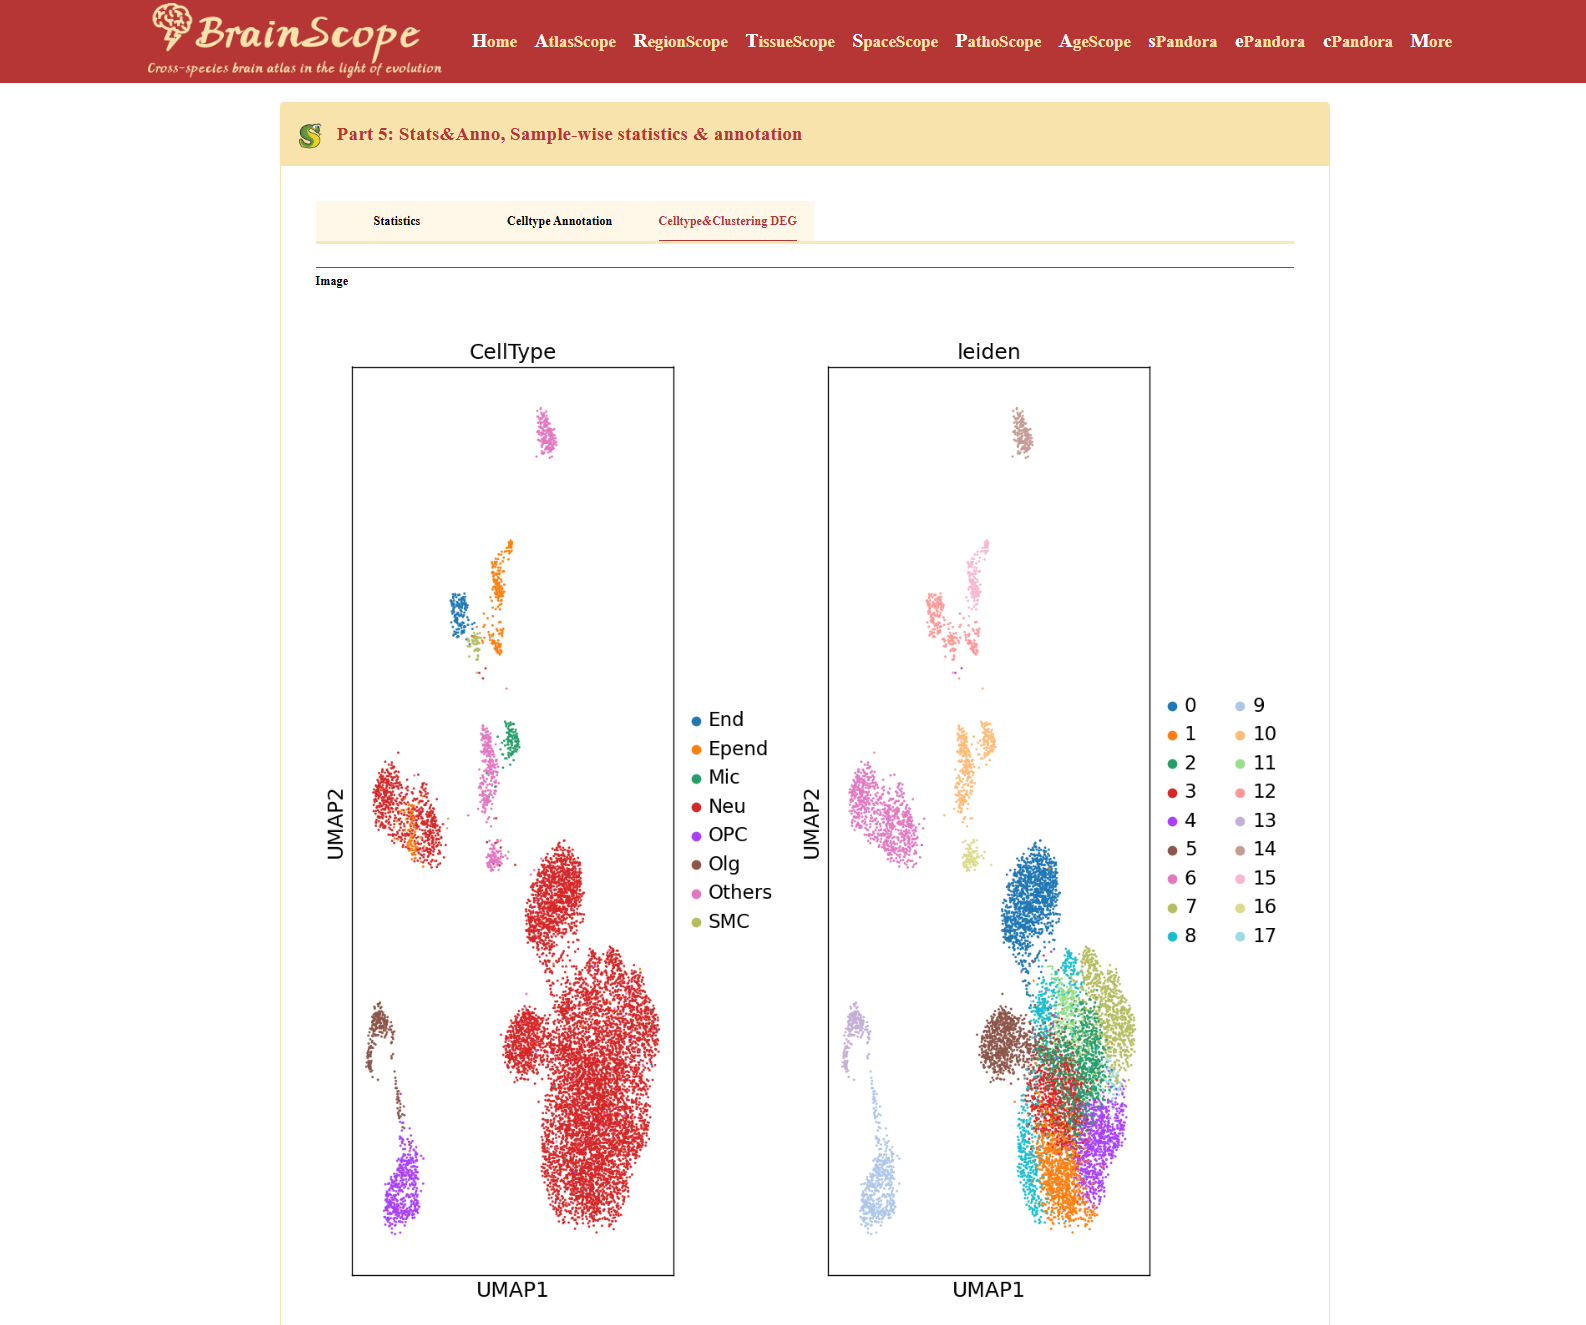
Part5: Stats&Anno – Sample-wise statistics and annotations
Stats&Anno module provides users with a comprehensive analysis of single-cell datasets, focusing on sample statistics, clustering, cell type annotations, and differential gene expression (DEG) analysis. The module is divided into four sections, each accessible via dedicated tabs: Statistics, Clustering, Celltype Annotation, Celltype DEG.
The Statistics tab provides violin plots for assessing dataset quality.
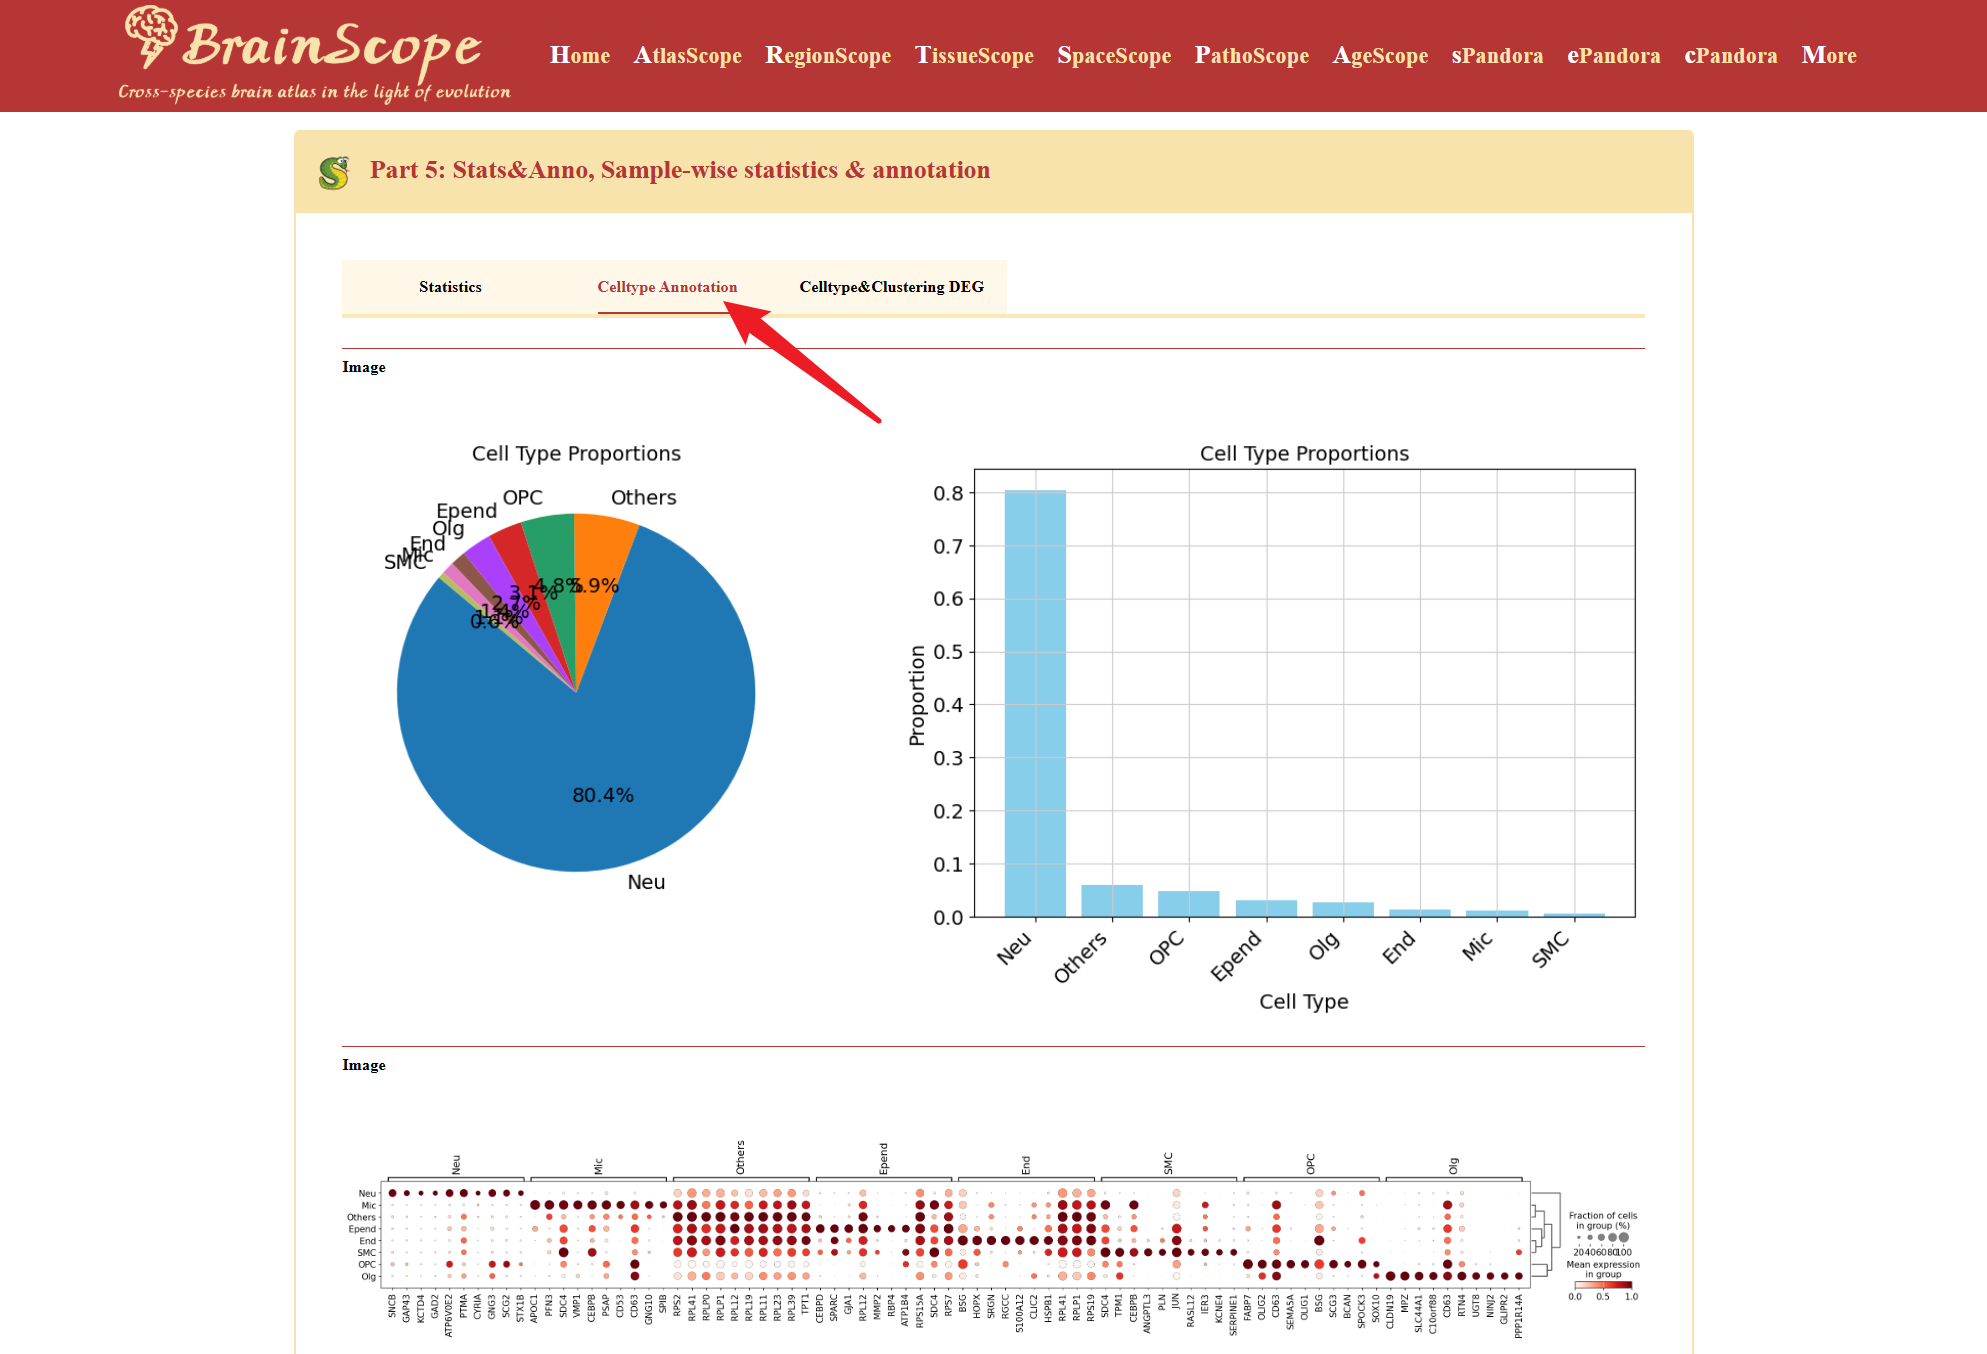
The Celltype Annotation tab helps users explore annotated cell types and their expression characteristics.
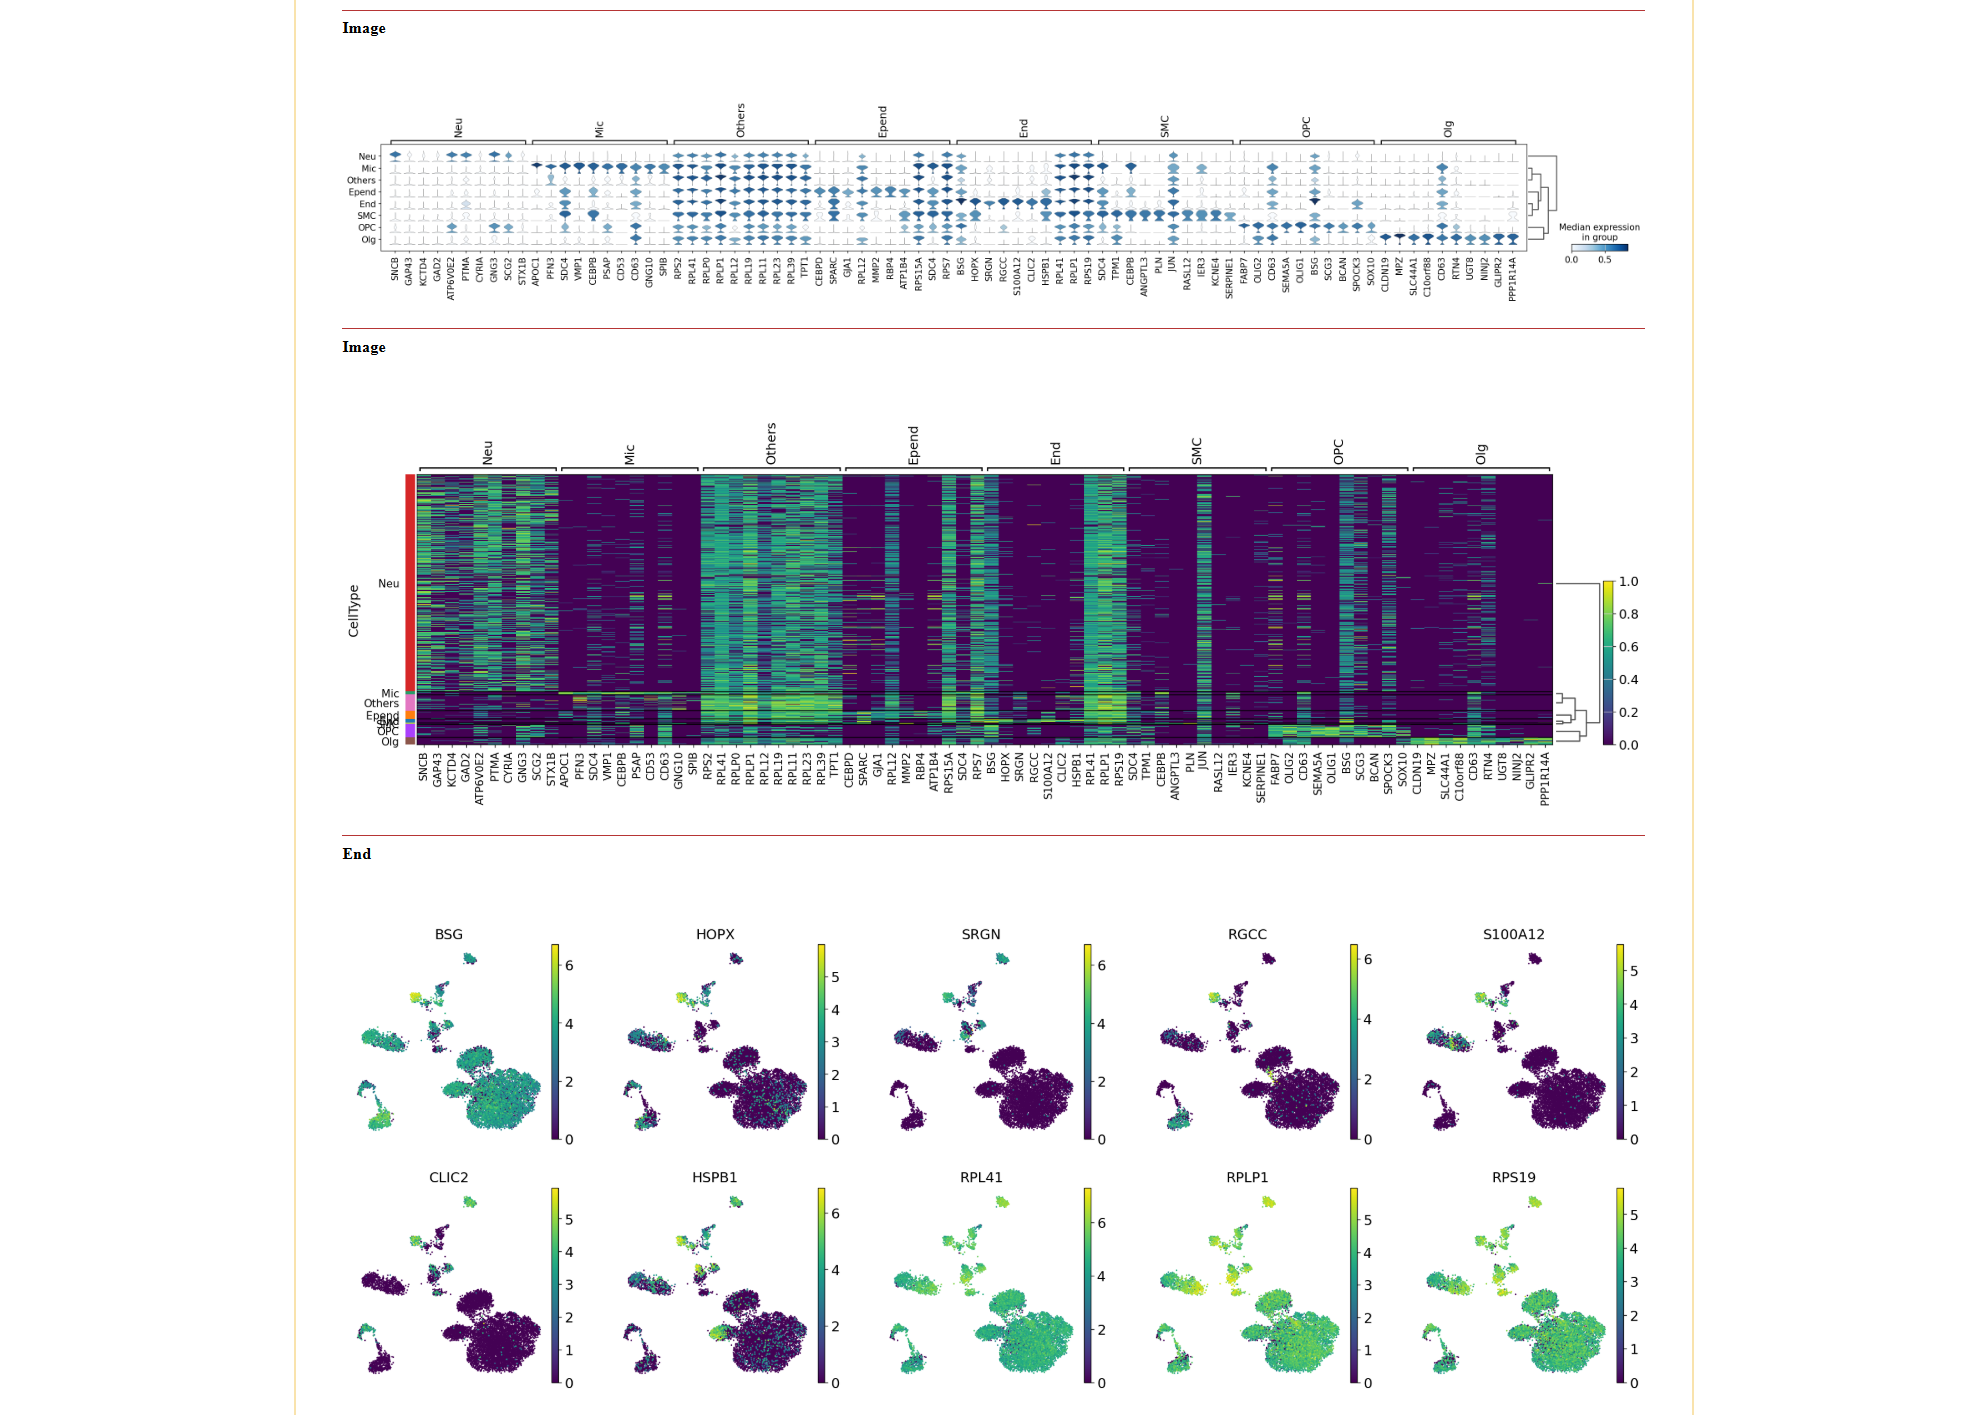
The Celltype DEG tab allows users to identify differentially expressed genes (DEGs) between cell types.
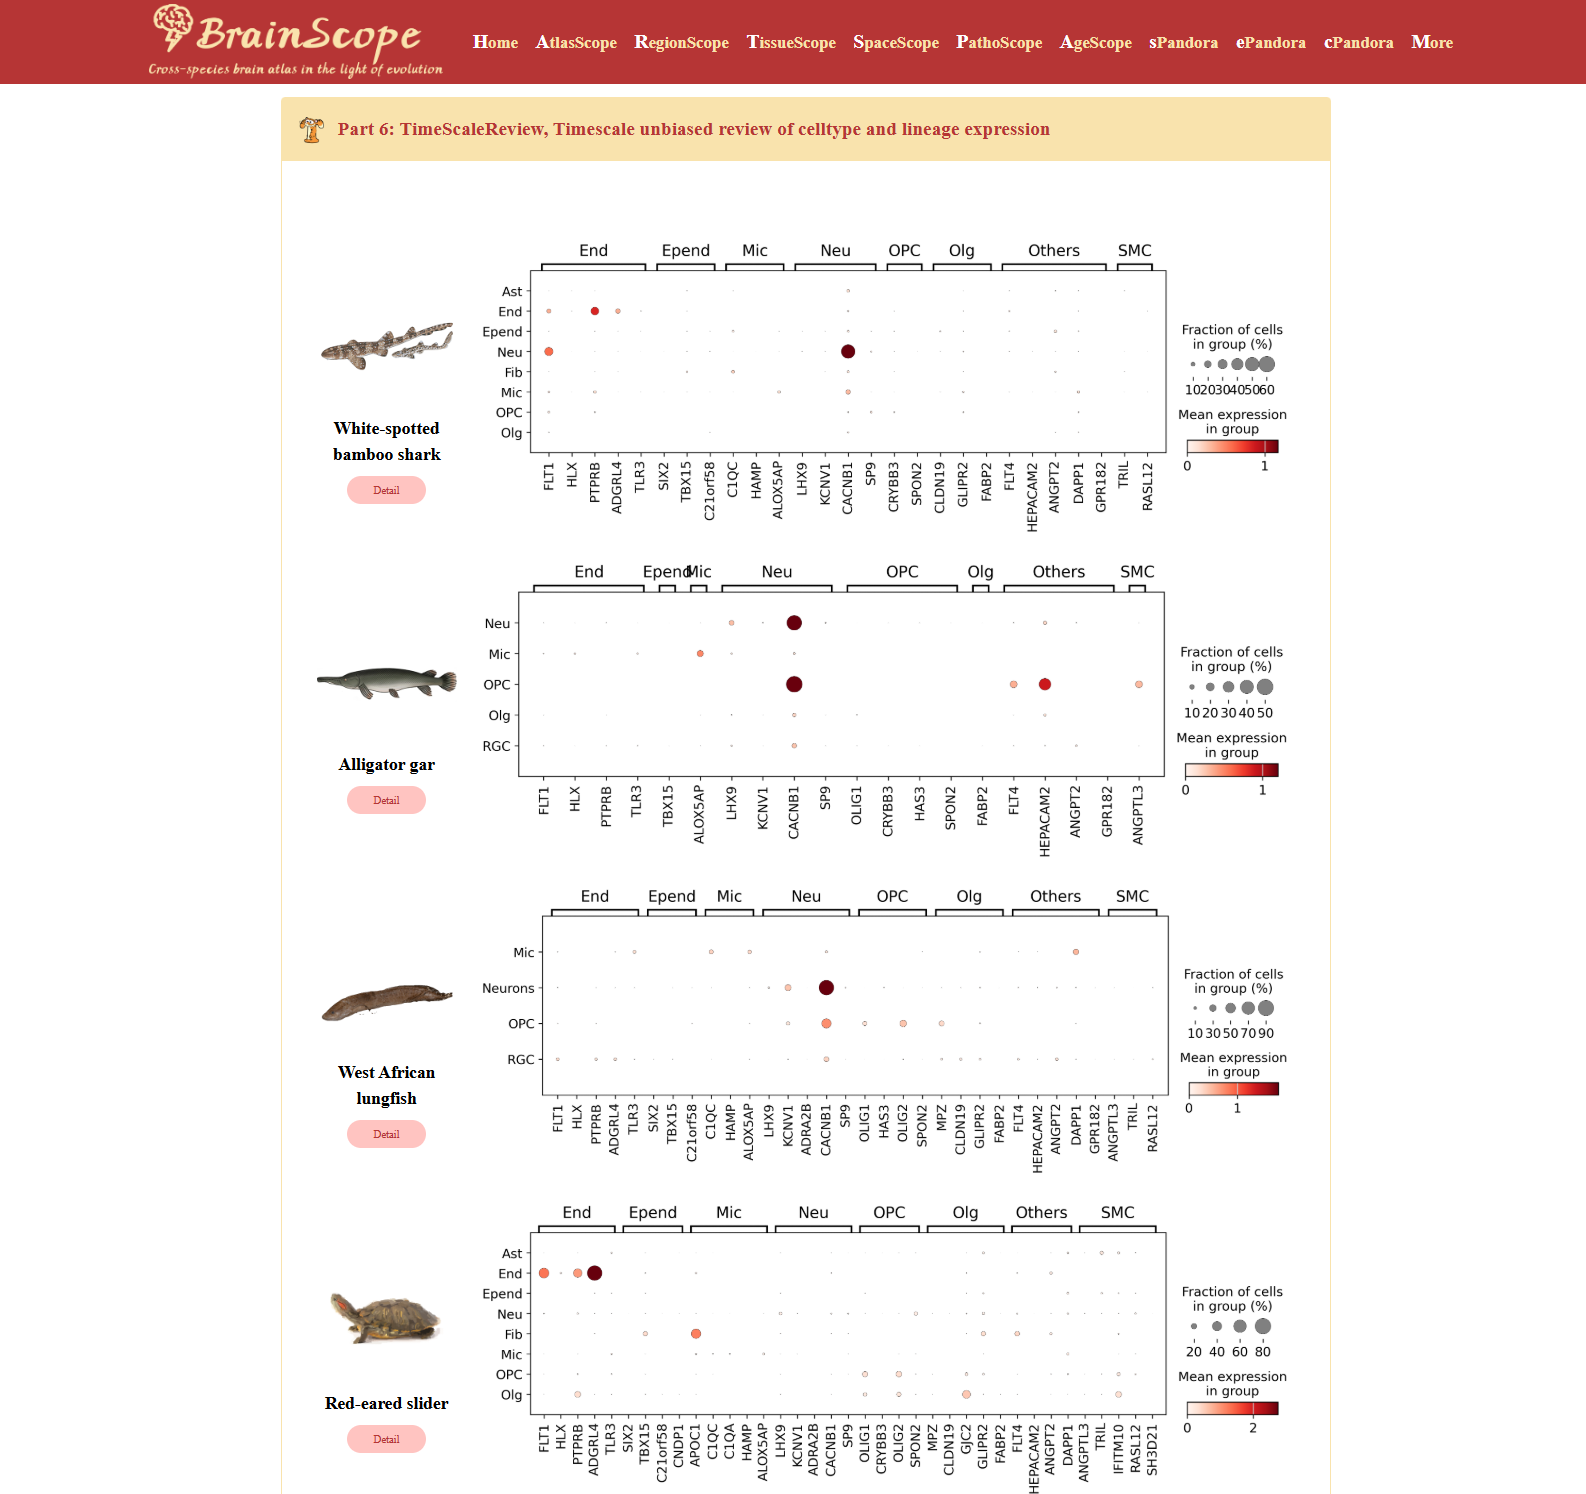
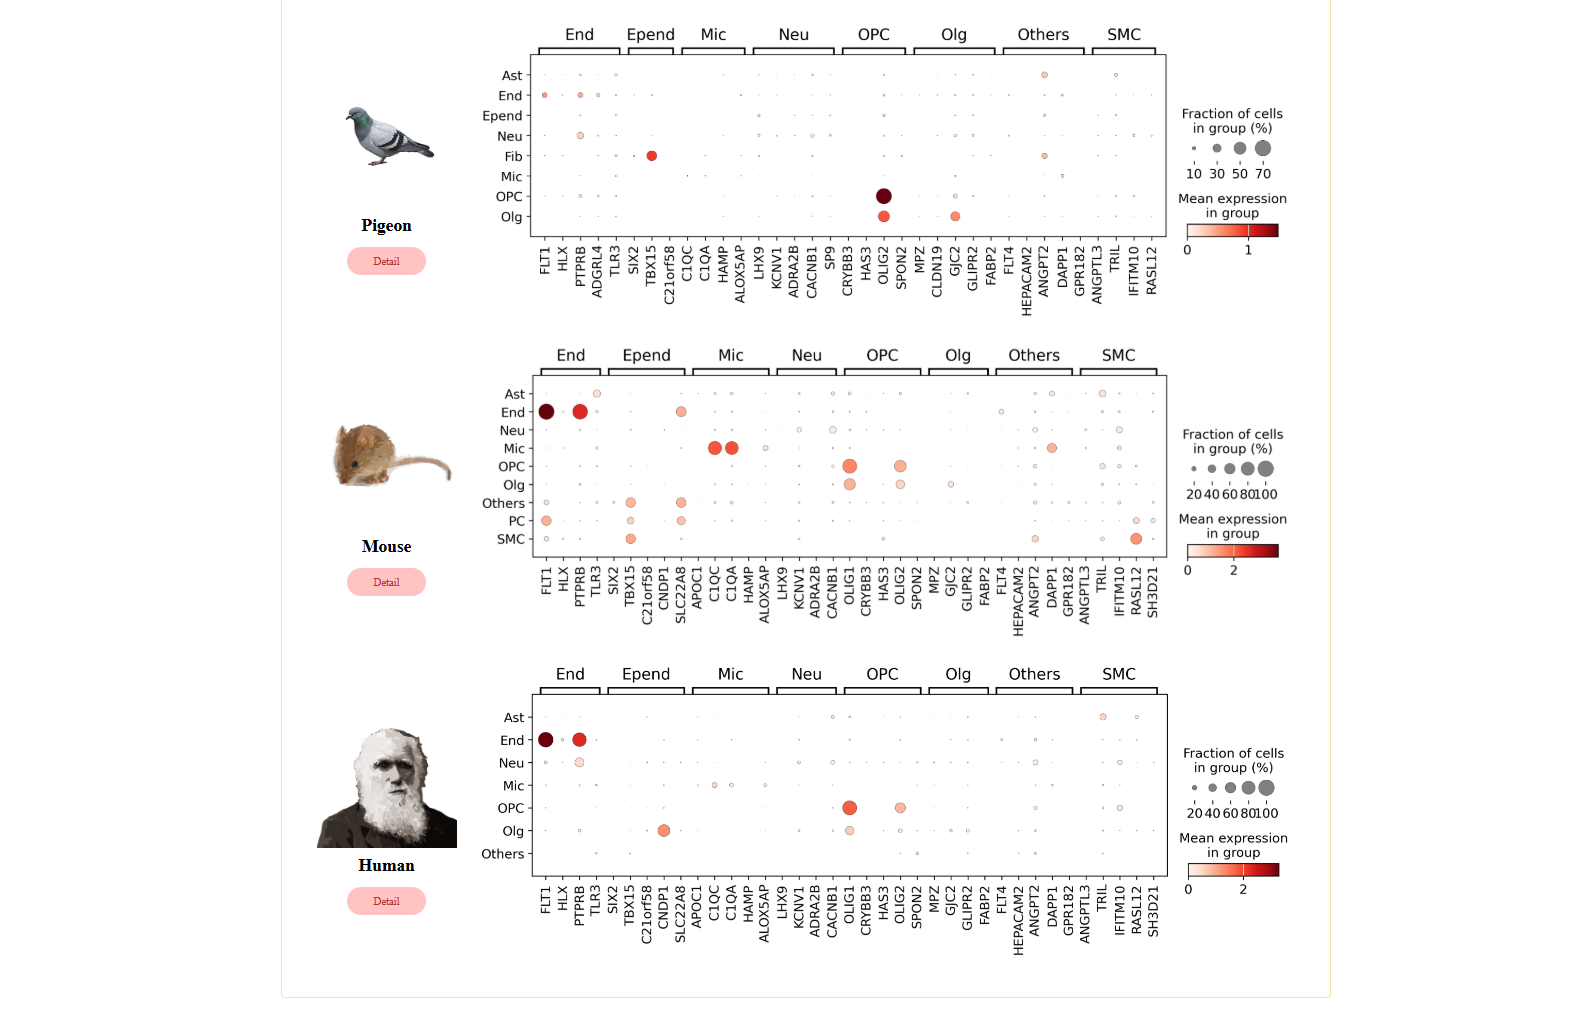
Part6: TimeScaleReview – Evolutionary analysis of gene expression across species
The TimeScaleReview module provides an unbiased evolutionary analysis of cell type and lineage expression across different species. This module highlights the top five differentially expressed genes (DEGs) for each cell type, comparing their expression patterns across seven evolutionary distinct species: White-Spotted Bamboo Shark (Chiloscyllium plagiosum), Alligator Gar (Atractosteus spatula), West African Lungfish (Protopterus annectens), Red-Eared Slider (Trachemys scripta elegans), Pigeon (Columba livia), Mouse (Mus musculus), Human (Homo sapiens).
Part7: Enrichment – Functional enrichment analysis of differentially expressed genes
Enrichment module provides functional analysis of differentially expressed genes (DEGs) across cell types. Users can perform gene list enrichment, transcription factor motif analysis, and protein-protein interaction (PPI) exploration. The module consists of four tabs:Gene List, ToppGene Enrichment, PPI, Motif Erichment.
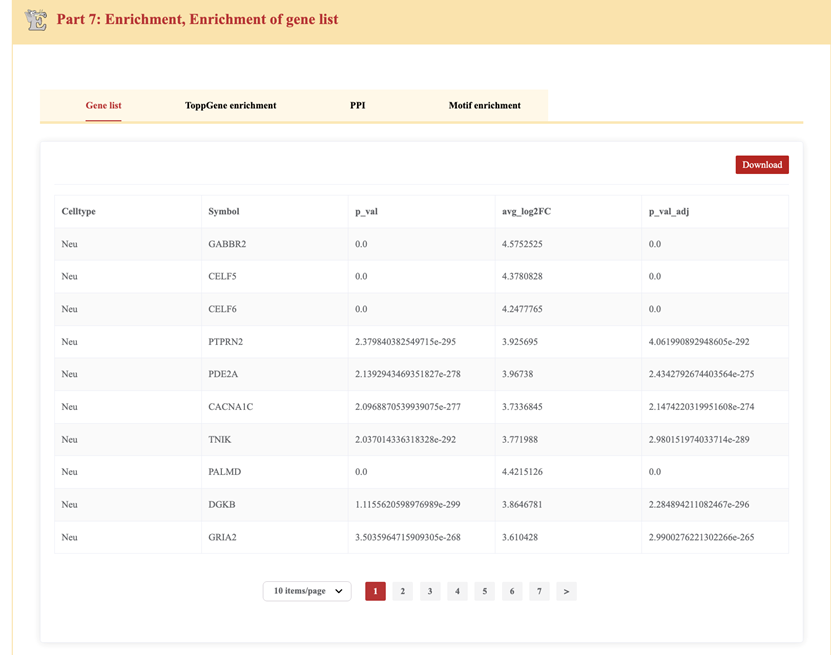
The Gene List tab displays a table containing differentially expressed genes (DEGs) for specific cell types.
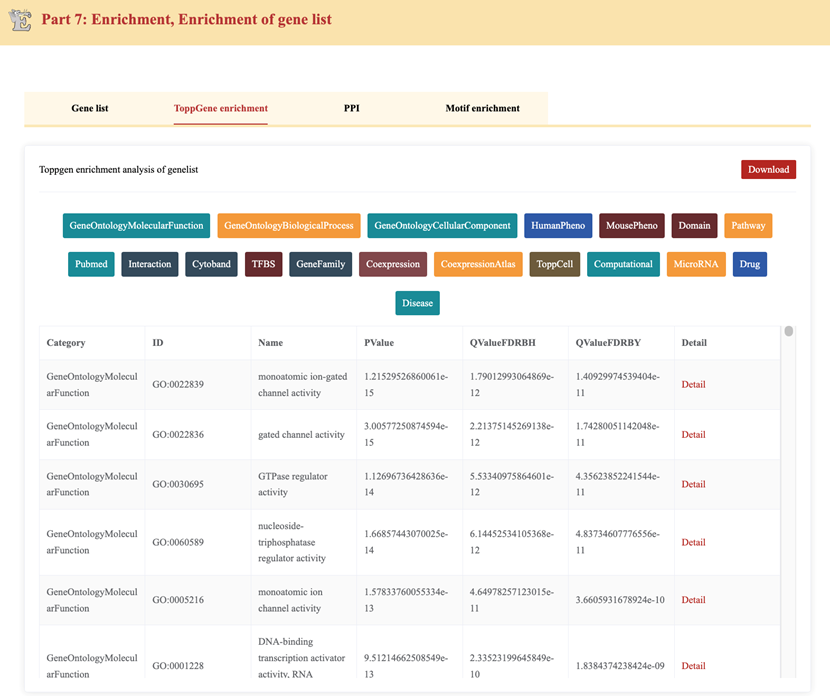
The ToppGene Enrichment tab provides functional annotation of the differentially expressed genes using ToppGene analysis. This section is designed to help users understand the biological relevance of DEGs.
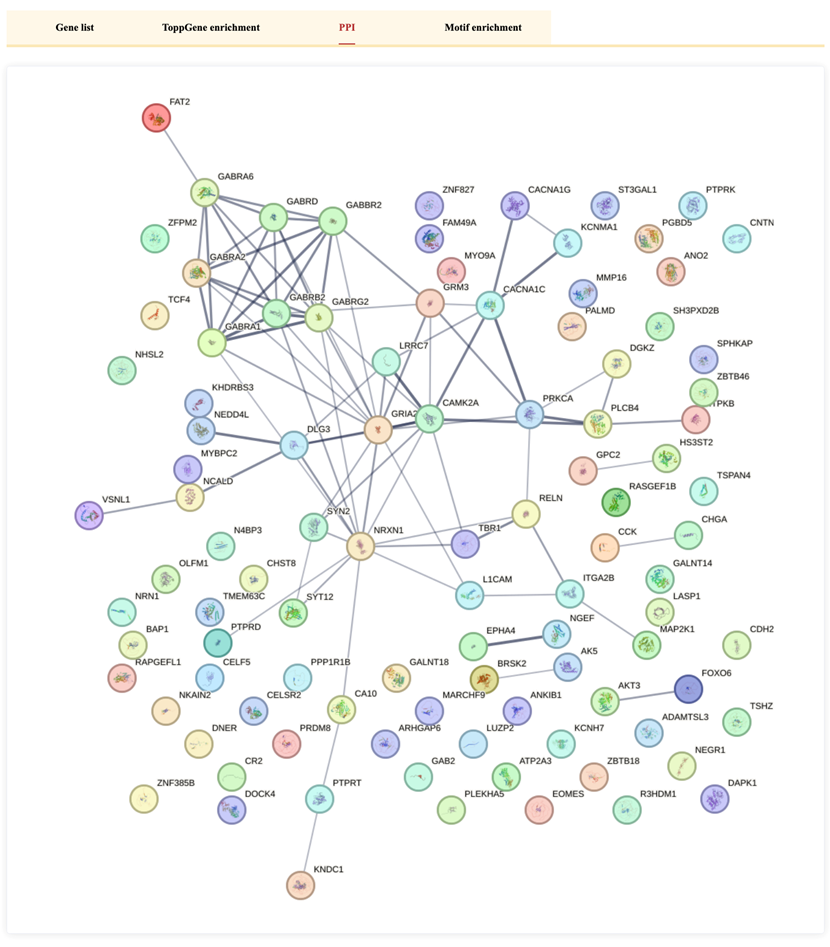
The PPI (Protein-Protein Interaction) tab is designed to visualize protein interaction networks related to DEGs. However, in the current version, the page displays a 404 error, indicating that this feature is not yet available.
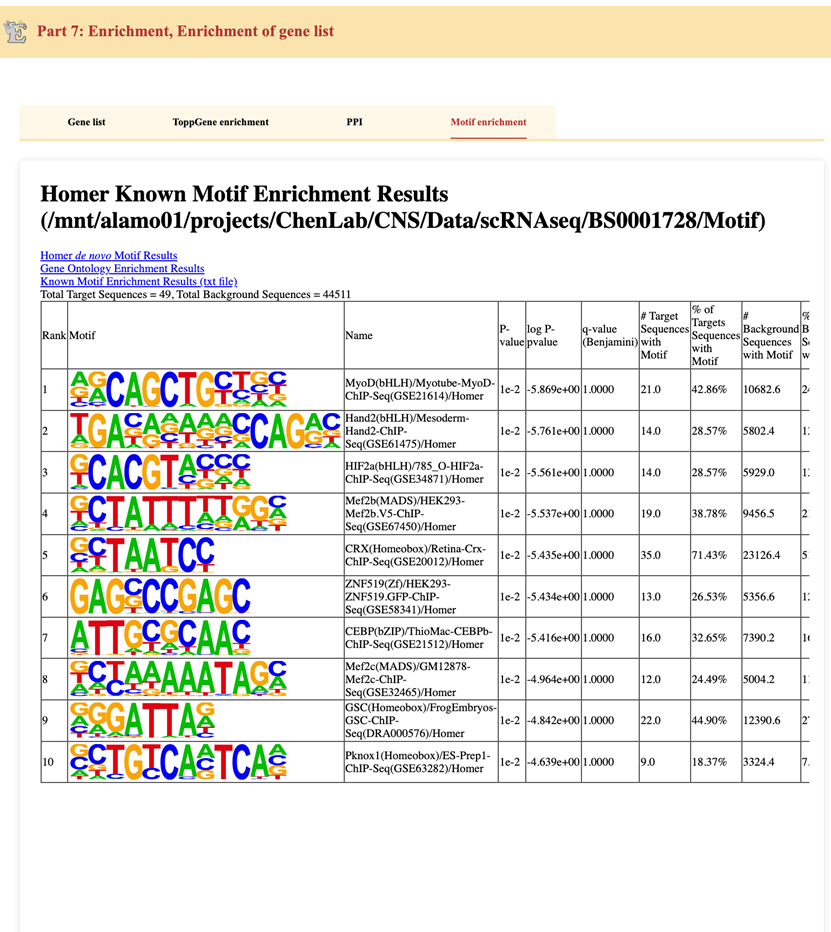
The Motif Enrichment tab identifies transcription factor binding motifs enriched in the differentially expressed genes. The analysis is performed using Homer Known Motif Enrichment, which compares gene sequences against known transcription factor motifs.
Part 8: Download, Resource according to atlas ontology
Users can download the quality-controlled and standardized dataset.