


- Disease
- Evolution
- Embryogenesis
- Region
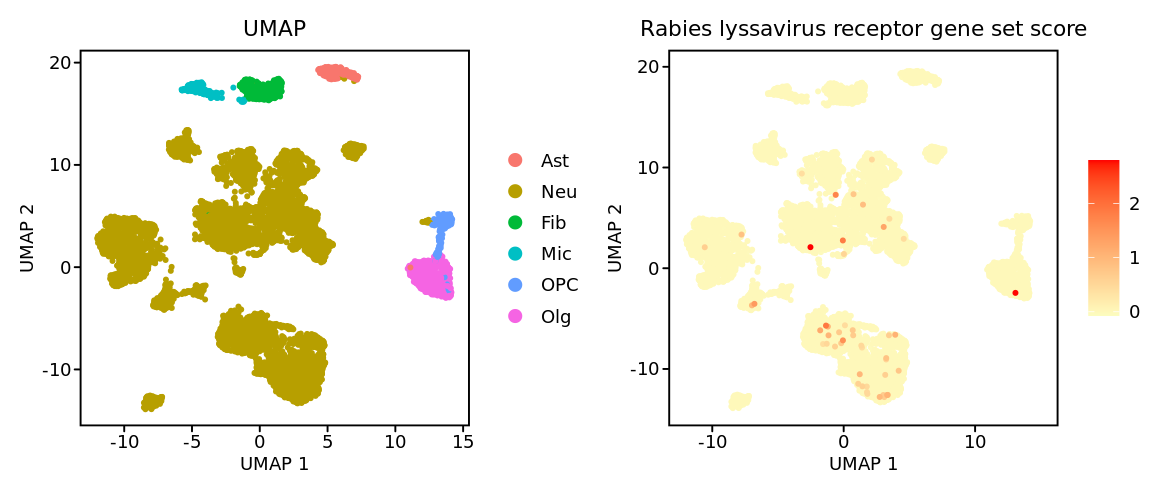
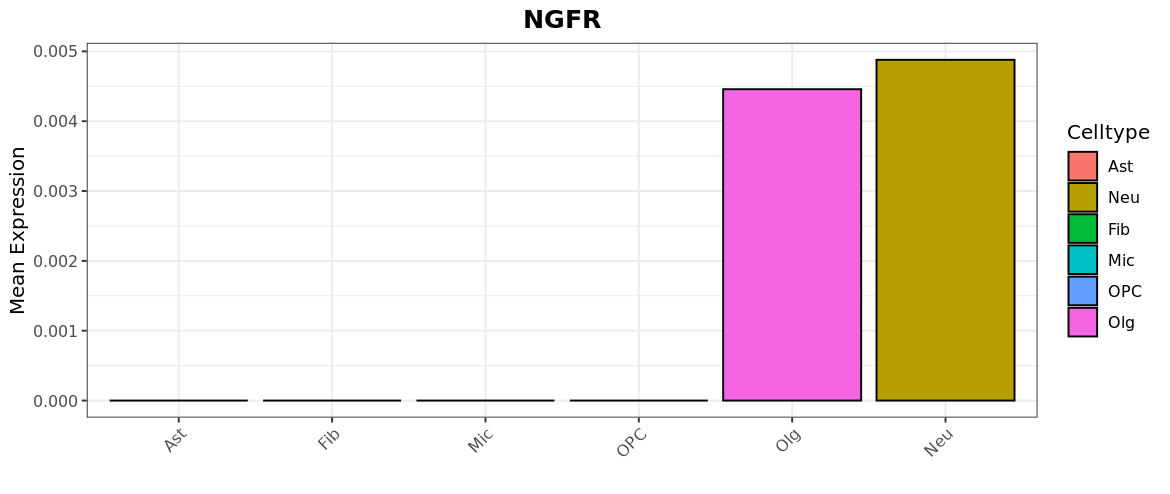
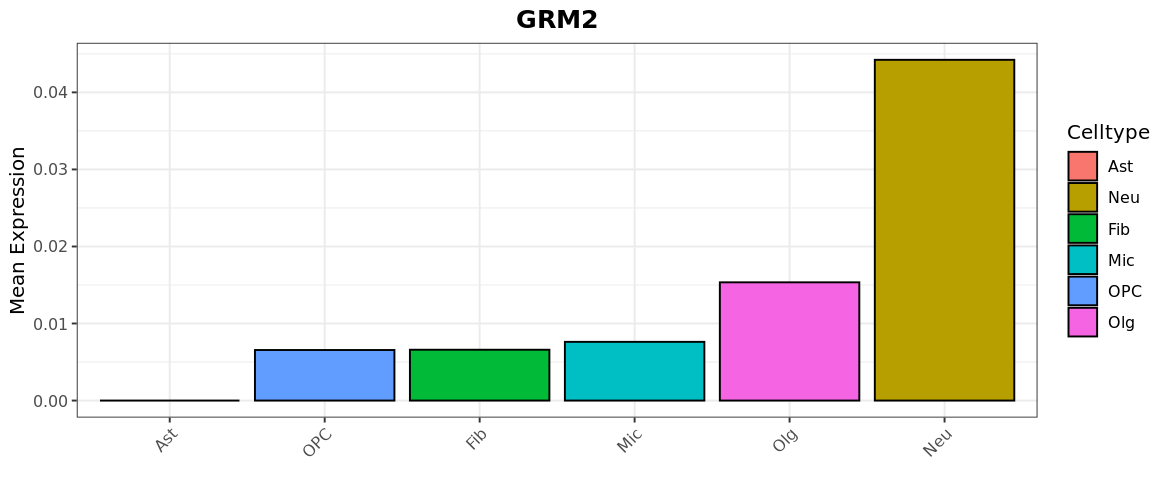
Explore data at the single-gene level (2000 cells sampled)
Features
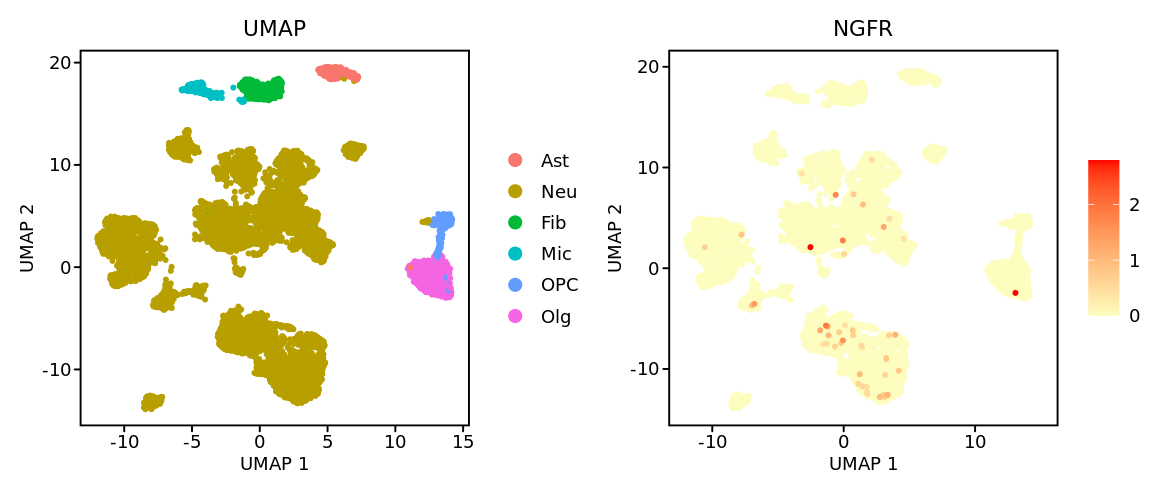
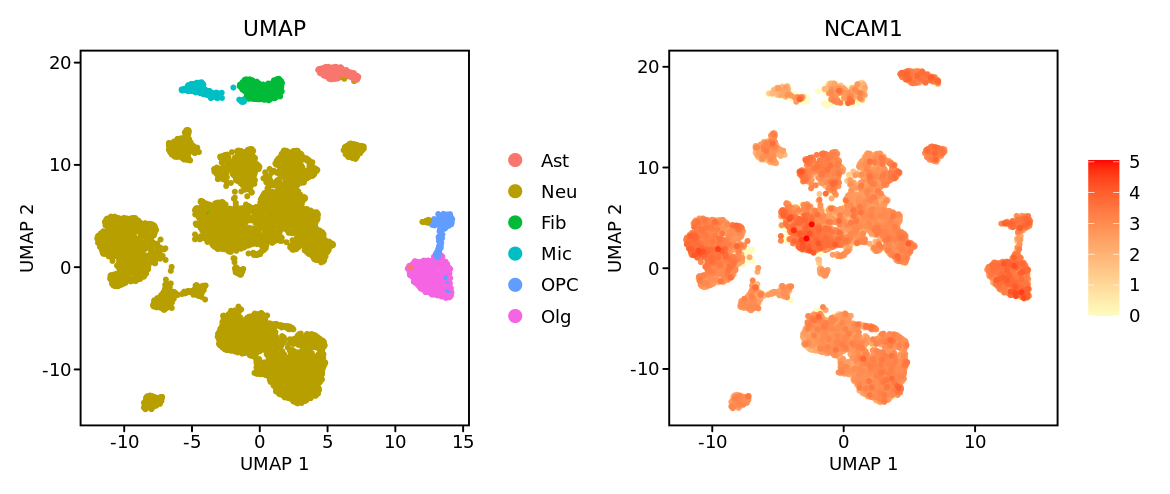
Explore data at the single-gene level (2000 cells sampled)
Features
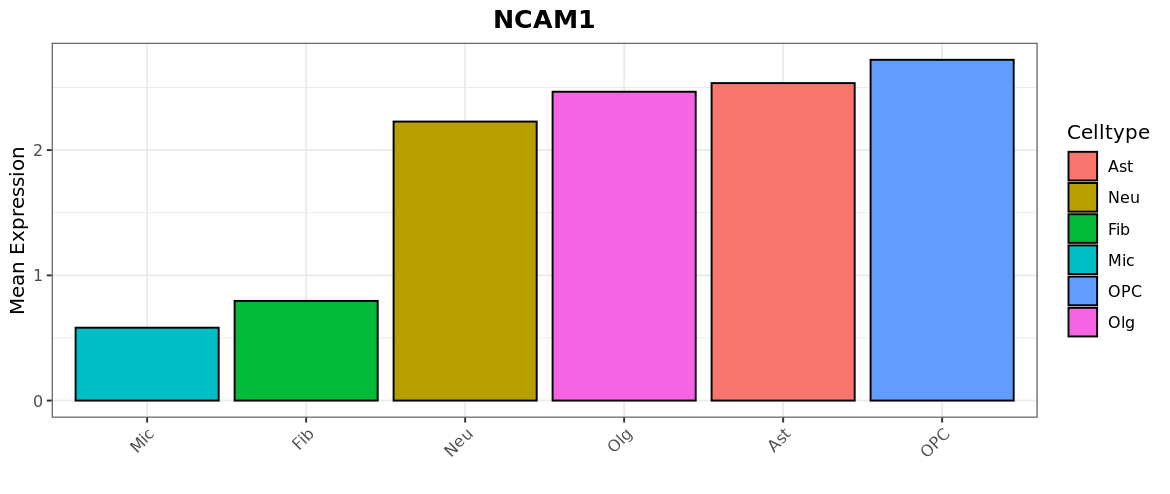
Explore data at the single-gene level (2000 cells sampled)
Features
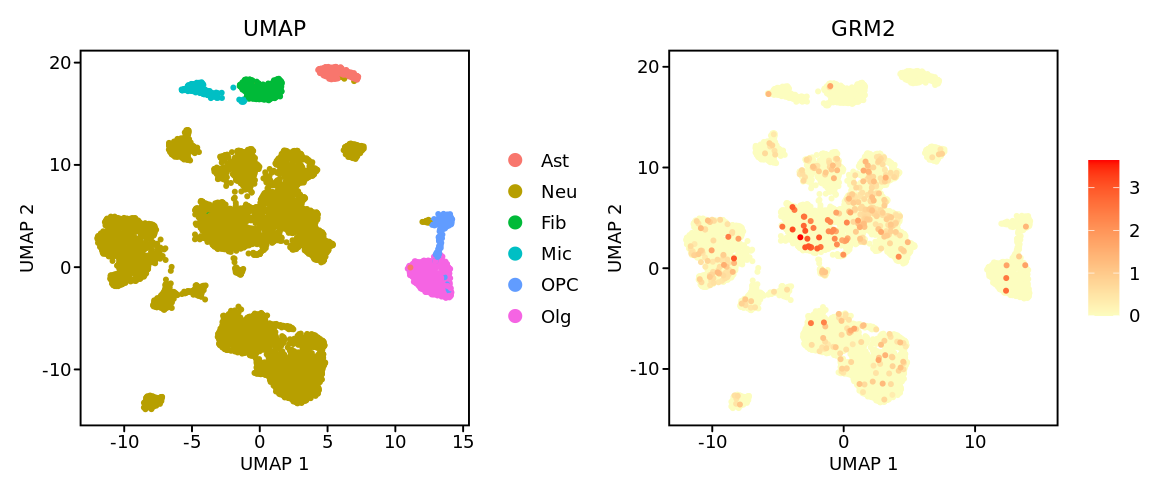
Explore data at the single-gene level (2000 cells sampled)
Features