- Single-dataset exploration
- sPandora
- ePandora
- GeneLists
- TimeTree
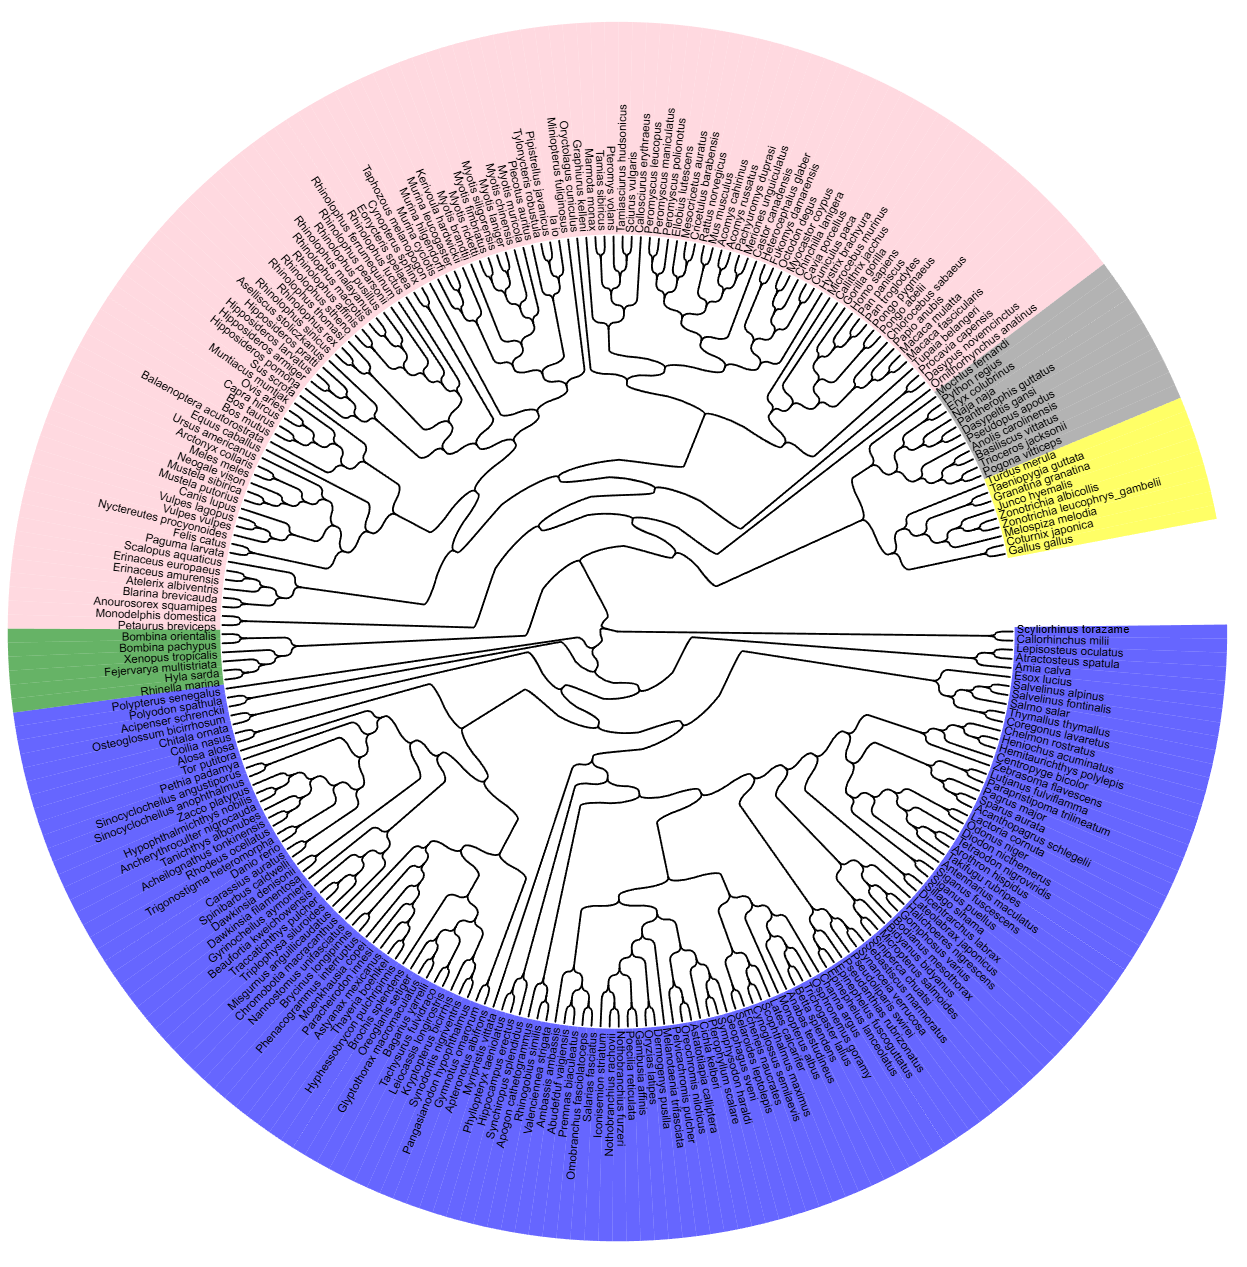
Choose Species
View the selected datasets
Show
entries
Search:
- DimID
- Classification
- CommonName
- LatinName
- Tissue
- Journal
- PMID
- Detail
- ViewData
Statistics of expressed genes in different calssifications

Select a gene set
- Select
- Type
- BriefIntro
- GeneNum
- GeneList
Select a dimension
Show
entries
Search:
- Select
- ID
- Title
- GeneList
- Gene list
- Toppgen enrichment
- PPI
- Motif Enrichment
cluster: cellcluster; gene: gene symbol; p_val: p value; avg_log2Fc: average logfc between two groups; pct.1: the proportion of cels expressing the gene among the cels in the current cluster; pct.2: the proportion of cells expressing the gene among the cells in other clusters; p_val_ad;: adjusted p-value;
Toppgen enrichment analysis of genelist
Download
- Category
- ID
- Name
- PValue
- QValueFDRBH
- QValueFDRBY
- Detail