AgingHuman
AgingHuman provides gene expression data for studying trajectory and GO enrichment in aging cells, highlighting key markers and pathways linked to aging. It supports time-scale analyses of cell types and age-related lineage changes, aiding in aging research.
VIEW HELP
Cell atlas of trajectory
Association
Regulators of trajectory
DEG during trajectory
DissectEvo
Embryo_sc
Embryo_st
RatingList
SpeciesDyn
PathologyDyn
EmbryogenesisDyn
AnatomyDyn
RegionDyn
SpaceDyn
ExternalLink
NaviA2Z
Download
Part01: Cell atlas of trajectory (Eagle, Expression Atlas at Gene LEvel)
  • UMAP
Explore data at the single-gene level
Features
Part02: Association Network infered from Transcriptome (Ant)
  • Ant
    • Select
    • BriefIntro
    • Remark
    • GeneNum
    • GeneList
    • Association
    Putative positive regulators of
    Show
    entries
    Search:
    • Symbol
    • Correlation
    • P value
    • Adjusted P value
    Putative negative regulators of
    Show
    entries
    Search:
    • Symbol
    • Correlation
    • P value
    • Adjusted P value
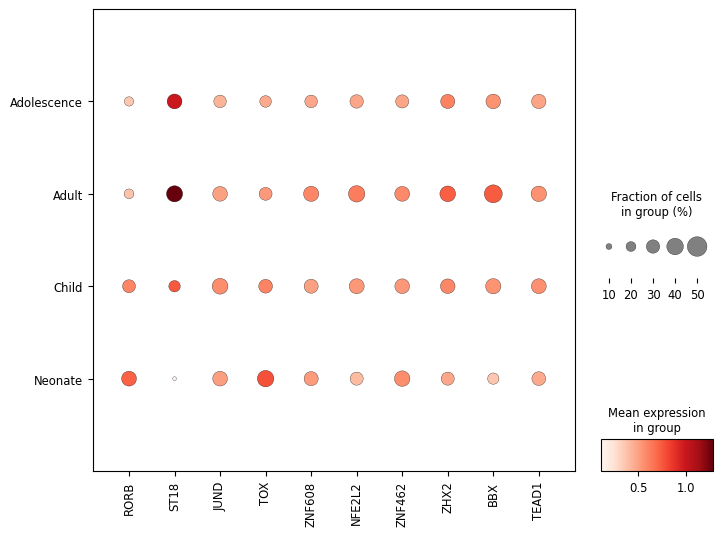
    Part03: Regulators of trajectory
    • CytoTrace
    • Top10 HVG TF Table
    • Top10 HVG TF Image
    • G2G
    View ligand-receptor mediated cellular communications
    Download
    • CytoTRACE
    • Component1
    • Component2
    • Phenotype
    Show
    entries
    Search:
      • Genetic regulatory networks
      • GO term
      • Regulon shiny
      • CellType
      • CellType
      Part04: DEG during trajectory
      • DEG
      Show
      entries
      Search:
        Part05: Dissecting gene expression patterns across species during evolution
        • Gene expression patterns
        Part06: Embryo atlas and gene expression dynamics at single-cell resolution
        • scEggMuGA
        Gene list
        Show
        entries
        Search:
        • Select
        • GeneSymbol
        • EnsembllD
        • GeneCard Link
        • NCBI Link
        • Ensembl Link
        • UniProt Link
        Unfold all
          Part07: Embryo atlas and gene expression dynamics at spatial resolution
          • stEggMuGA
          Gene list
          Show
          entries
          Search:
          • Select
          • GeneSymbol
          • EnsembllD
          • GeneCard Link
          • NCBI Link
          • Ensembl Link
          • UniProt Link
          Unfold all
            Part08: Rating of gene list by ToppGene and Poster enrichment
            • ToppGene enrichment
            • Poster enrichment
            • Gene list
            • ToppGene enrichment
            • PPI
            • Motif enrichment

            Celltype: cell type; Symbol: gene symbol; p_val: p value; avg_log2FC: average logfc between two groups; p_val_adj: adjusted p-value;

              Toppgen enrichment analysis of genelist
              Download
                • Category
                • ID
                • Name
                • PValue
                • QValueFDRBH
                • QValueFDRBY
                • Detail

                Mode 1: select BSID
                {{ tabName }}
                • Classification
                • Species
                • Tissue
                Dataset information

                BSID: {{dataInfo.BSID}}

                Classification: {{dataInfo.Classification}}

                CommonName: {{dataInfo.CommonName}}

                LatinName: {{dataInfo.LatinName}}

                BrainRegion:{{dataInfo.Region}}

                Timing:{{dataInfo.Timing}}

                Diseases: {{dataInfo.Diseases}}

                Tech: {{dataInfo.Diseases}}

                CellNum: {{dataInfo.Tech}}

                Title: {{dataInfo.Title}}

                Journal: {{dataInfo.Journal}}

                PMID: {{dataInfo.PMID}}

                Matrix Download : Click to download

                Shinycell: View data

                Mode 2: select gene list
                • Gene List
                • scRNASeq
                • Spatial Transcriptomics
                Input Genes
                Choose a subsection
                • Dimensions
                Enter your own Gene symbols
                Only .csv and .h5ad file types accepted for online analysis. Download Demo (Detail of Demo dataset ).
                Only .csv and .h5ad file types accepted for online analysis. Download Demo (Detail of Demo dataset ).
                Top 10 Enriched Dimensions
                  Top 30 Enriched Dimensions
                  List of Enriched Dimensions
                  • Tag
                  • Intersect gene num
                  • p val
                  • p val adj
                  Part09: SpeciesDyn
                  • SpeciesDyn
                  Gene list
                  Show
                  entries
                  Search:
                  • Select
                  • GeneSymbol
                  • EnsembllD
                  • GeneCard Link
                  • NCBI Link
                  • Ensembl Link
                  • UniProt Link
                  • Species
                  Part10: PathologyDyn
                  • PathologyDyn
                  Gene list
                  Show
                  entries
                  Search:
                  • Select
                  • GeneSymbol
                  • EnsembllD
                  • GeneCard Link
                  • NCBI Link
                  • Ensembl Link
                  • UniProt Link
                  • Diz
                  Part11: EmbryogenesisDyn
                  • EmbryogenesisDyn
                  Gene list
                  Show
                  entries
                  Search:
                  • Select
                  • GeneSymbol
                  • EnsembllD
                  • GeneCard Link
                  • NCBI Link
                  • Ensembl Link
                  • UniProt Link
                  • Devo
                  Part12: AnatomyDyn
                  • AnatomyDyn
                  Gene list
                  Show
                  entries
                  Search:
                  • Select
                  • GeneSymbol
                  • EnsembllD
                  • GeneCard Link
                  • NCBI Link
                  • Ensembl Link
                  • UniProt Link
                  • Tissue
                  Part13: RegionDyn
                  • RegionDyn
                  Gene list
                  Show
                  entries
                  Search:
                  • Select
                  • GeneSymbol
                  • EnsembllD
                  • GeneCard Link
                  • NCBI Link
                  • Ensembl Link
                  • UniProt Link
                  • Region
                  Part14: SpaceDyn
                  • SpaceDyn
                  Gene list
                  Show
                  entries
                  Search:
                  • Select
                  • GeneSymbol
                  • EnsembllD
                  • GeneCard Link
                  • NCBI Link
                  • Ensembl Link
                  • UniProt Link
                  • Space
                  The geneset you selected is:
                  • Species
                  • Tissue
                  • Devo
                  • Diz
                  View gene expression profiles of different chips
                    Part15: ExternalLink
                    • ExternalLink
                    Part16: NaviA2Z
                    • NaviA2Z
                      Part17: Download
                      • Download
                        Cell atlas of trajectory
                        Association
                        Regulators of trajectory
                        DEG during trajectory
                        DissectEvo
                        Embryo_sc
                        Embryo_st
                        RatingList
                        SpeciesDyn
                        PathologyDyn
                        EmbryogenesisDyn
                        AnatomyDyn
                        RegionDyn
                        SpaceDyn
                        ExternalLink
                        NaviA2Z
                        Download