ArtSpaces
AtlasScope
RegionScope
TissueScope
SpaceScope
PathoScope
AgeScope
cPandora
ePandora
sPandora
Bodhi
M
issGene
I
n2Cell
S
paceTeller
T
eddi
E
voPred
R
ecallST
Dr
S
pace
Dr
W
ho
DrD
an
cer
Dr
S
drugle
Dr
O
rg
DrRegio
n
CytoPedia
R
ats
Tig
e
r
R
a
bbit
Catt
l
e
D
ragon
Ho
r
se
S
heep
S
n
ake
R
o
oster
D
o
g
P
ig
Monke
y
Dome
StemAtlas
AgingMap
DizPrint
DeathScape
LifeSig
EasyMeta
BioDrug
ArmRace
GeneSetsPedia
SearchDIY
Echo
Sus scrofa
Turbot
Ape
YamanakaFactor
Human
Urchin
Mouse
Bonobo
Lamprey
EmbryoMonkey
SearchDIY
Face2Face
PathoCompare
AgingCompare
RegionCompare
InvertebratesComp
SexCompare
TissueCompare
OrganoidCompare
WeekCompare
EmbryoCompare
ReptilesCompare
SearchDIY
GeneScope
TBR1
EGR1
NEUROD1
NEUROD2
IGHD6-6
SOX2
BCL11A
ARX
LHX2
LHX6
SearchDIY
Help
Statistics
Tutorial
Acknowledgement
News
Download
Upload
PIclub
GuidingData
UserFeedback
YellowPages
SeqTech
More
Zootopia
Benchmark
Application
Significance
KeyConcepts
Embryogenesis
TraceEvo
BI_Tools
AutoExplore
ListOfGenes
ListOfResources
Young4ever
YoungEnriched
OldEnriched
UnionEnriched
NeuroAging
GenomeInstability
SenMayo
TranscriptionFactor
ERV_AIR
Receptors
SearchDIY
Xomics
OneOmics
SNPomics
ClinicalOmics
ATACseq
RNAseq
SpatialOmics
Wonder4Cell
SMC
PC
Olg
OPC
Neu
Mic
Ast
NicheEnd
SearchDIY
Visualization
Goose
Owl
Alligator
Leopard
Kob
Eagle
Emu
Panda
Eel
Ram
UKSC
VB6Cell
ObesityCell
LBDCell
LateADCell
EpilepsyCell
YFVCell
BMPCell
ApoptosisCell
LongevityCell
LysineDegradationCell
SearchDIY
Trajectory
Mouse
Rabbit
Cynomolgus monkey
Rhesus monkey
AgingHuman
Zebrafish
EmbryoHuman
SearchDIY
GeneScope
SearchDIY
LHX6
LHX2
ARX
BCL11A
SOX2
IGHD6-6
NEUROD2
NEUROD1
EGR1
TBR1
Help
SeqTech
YellowPages
UserFeedback
GuidingData
PIclub
Upload
Download
News
Acknowledgement
Tutorial
Statistics
In2Region
SearchDIY
LateralStriatum
LateralHypothalamus
Amygdala
BasalNuclei
TemporalCortex
OlfactoryBulb
OccipitalCortex
FrontalCortex
Jumper
SearchDIY
Gypsy
ORSL
DNATransposons_Tigger3a
Y_Alu
Pseudogene
ERVH
ERVK
L1Hs_5end
SVA_C
KeyReg
SearchDIY
TBR2
REST
OLIG2
PAX6
SOX2
TBR1
NEUROD1
EGR1
UNCX
LHX2
FOXG1
Landscape
SearchDIY
DizPortrait
Region
AtlasPortrait
Database
NovelTools
Aging
TechRank
Space
DivPortrait
LibPortrait
OnePortrait
GenPortrait
MolFinger
SearchDIY
Depressive disorder
Neuralgia
Isolated focal cortical dysplasia
Multiple sclerosis
Parkinson's disease
Early Alzheimer's disease
Epilepsy
Dementia
TBR1
Supports researchers in exploring expression patterns, gene interactions, and regulatory mechanisms associated with TBR1.
VIEW HELP
PassportInfo and GenePartners
PassportInfo
Heterogeneity
Heterogeneity of gene expression
Organogenesis
Organogenesis dynamics
Spider
Spider
Turtle
Turtle
SpaceDyn
SpaceDyn
PathologyDyn
PathologyDyn
AgeDyn
AgeDyn
RegionDyn
RegionDyn
TissueDyn
TissueDyn
AtlasDyn
AtlasDyn
PathoRank
Pathology rank
Index
Index analysis
Correlation
Correlation analysis
Target
Target analysis
Understand
Understanding the mechanism of disease
Raccoon
Raccoon
ExternalLink
Eagle
SBSnavi
Step by step navigation from A to Z
Part01: PassportInfo and GenePartners
PassportInfo
GenePartners_Target
GenePartners_TF
Table
Show
10
50
100
1000
entries
Download this file
Search:
Table
Show
10
50
100
1000
entries
Download this file
Search:
Part02: Heterogeneity of gene expression
Atlas
Region
Age
Tissue
Pathology
Space
Image
Image
Image
Image
Image
Image
Part03: Organogenesis dynamics
Gene expression dynamic during organogenesis at single-cell resolution
Gene expression dynamic during organogenesis at spatial resolution
Unfold all
Unfold all
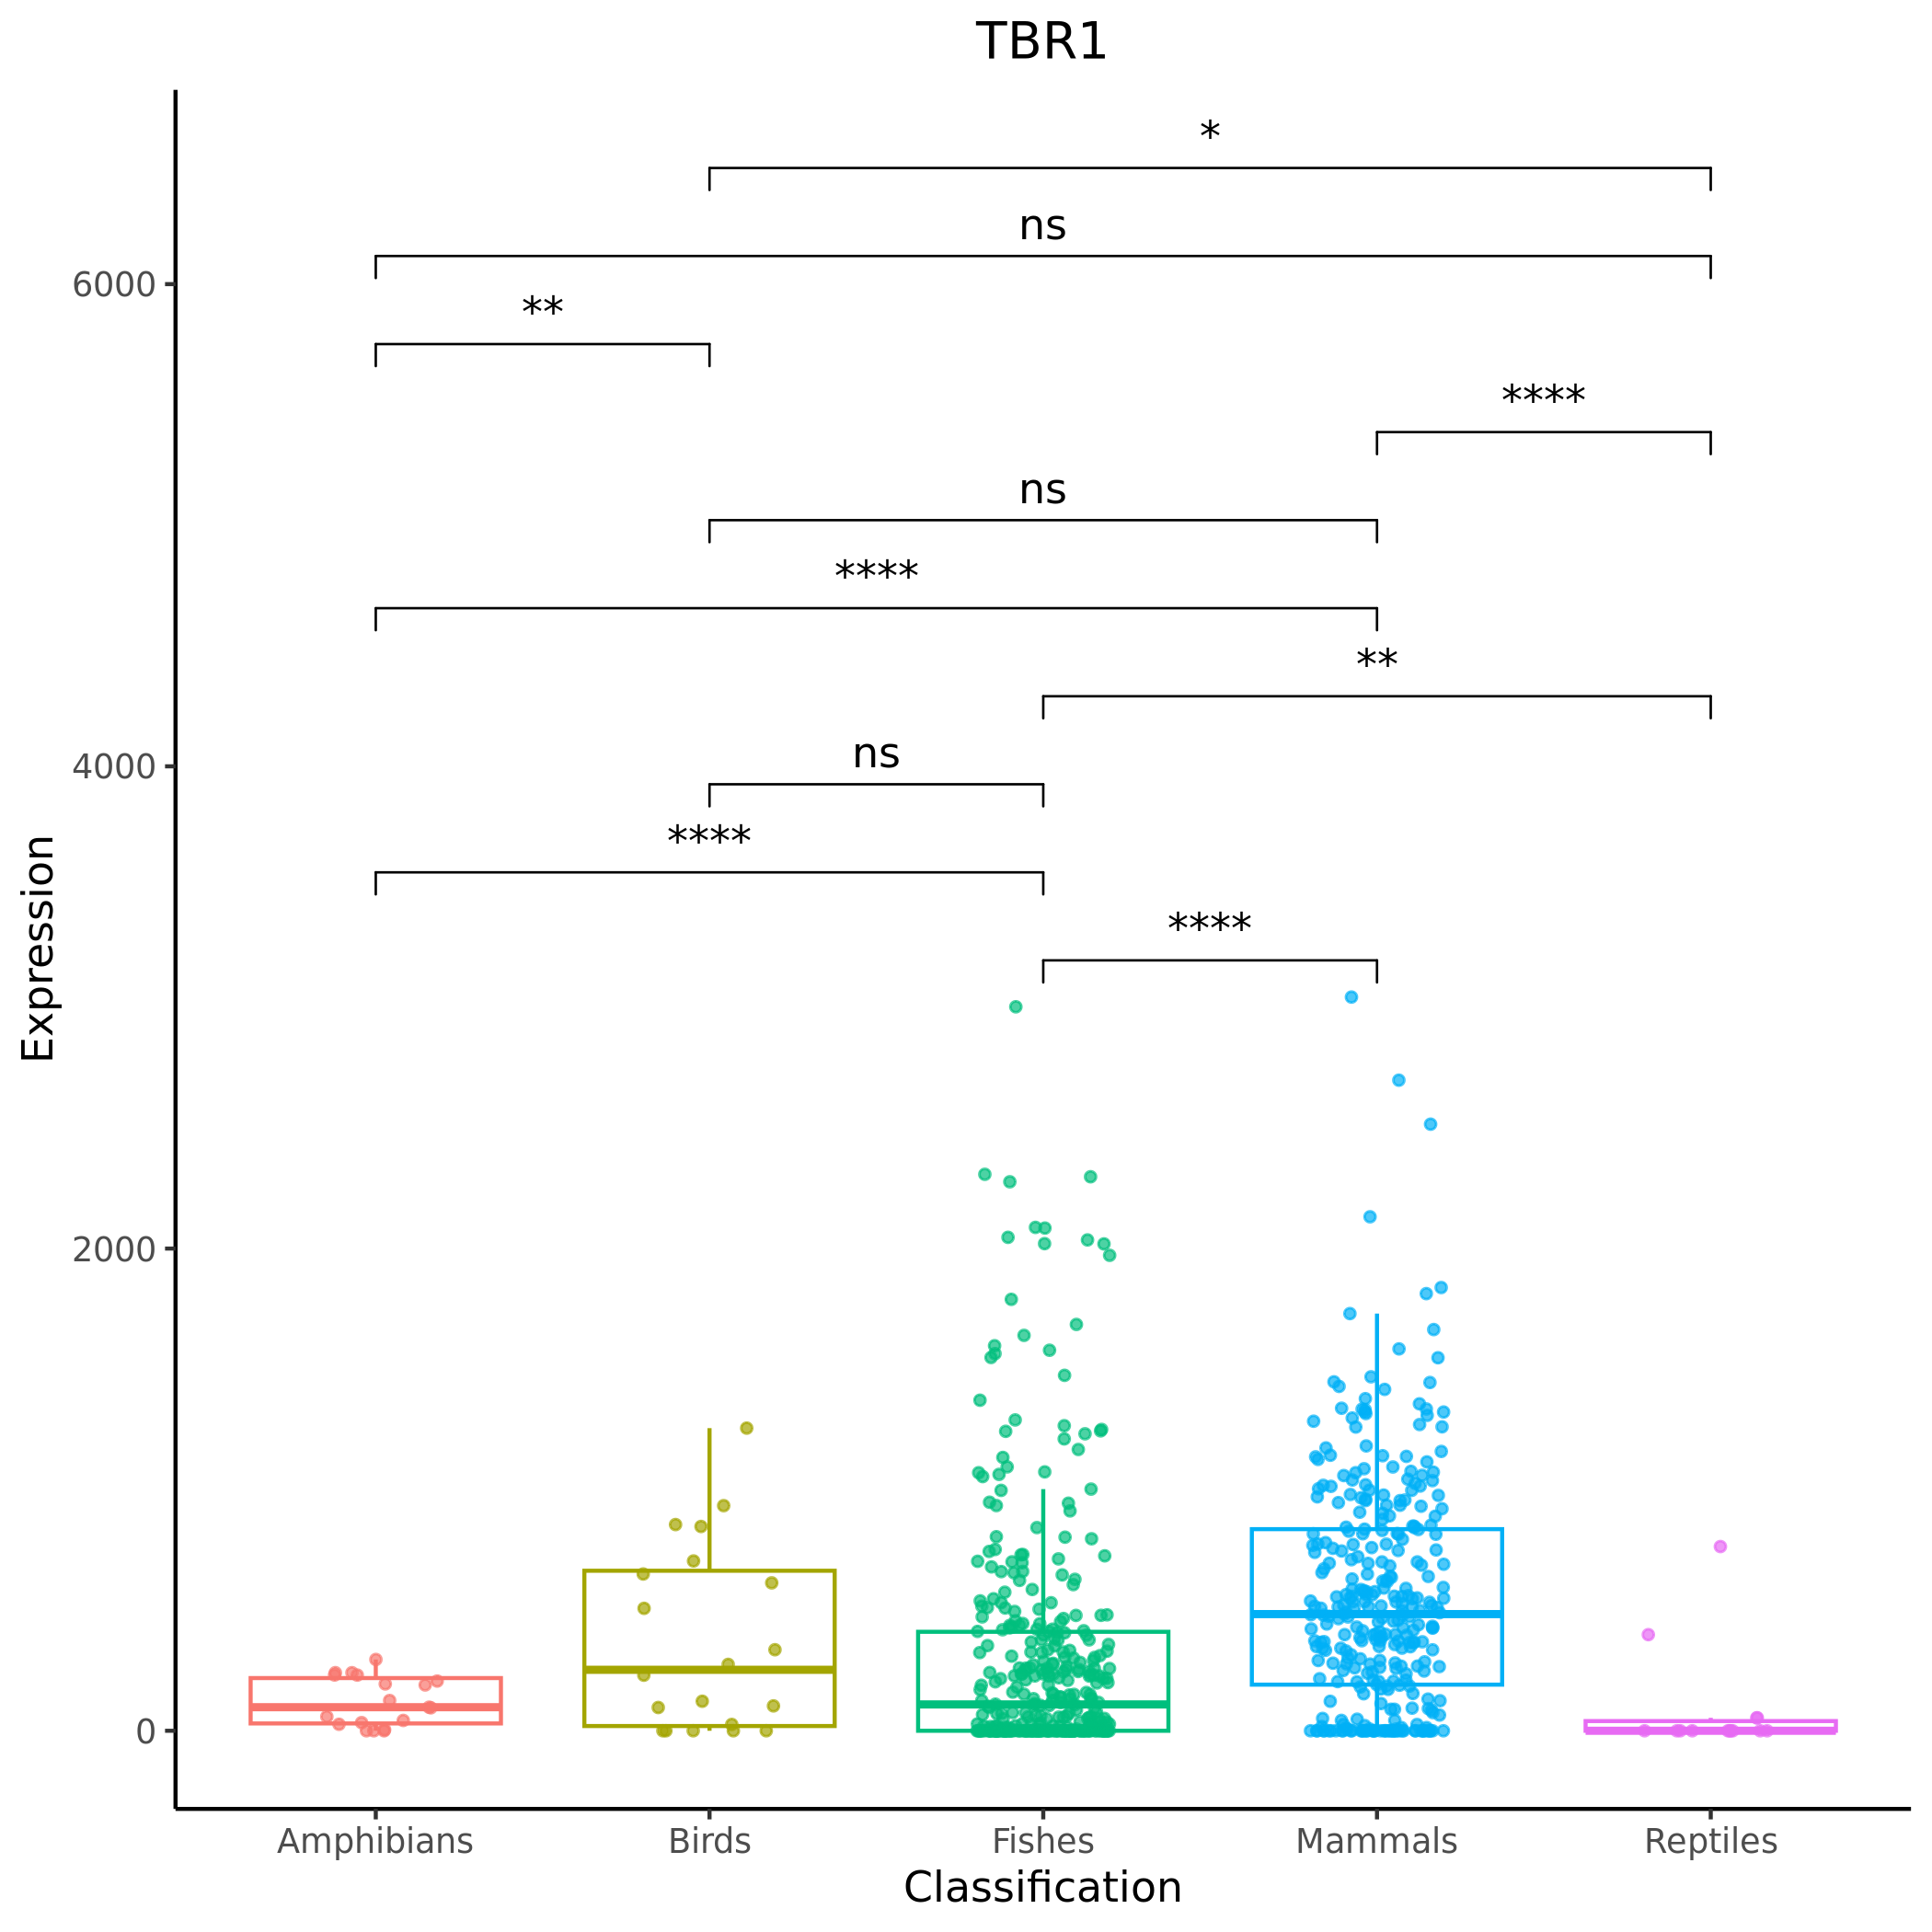
Part04: Sequence of Protein Inter-species Divergence at EvolutionaRyscale
Human
Mouse
Pigeon
Red-eared slider
Lungfish
Alligator gar
Bamboo shark
Table
Show
10
50
100
1000
entries
Download this file
Search:
Table
Show
10
50
100
1000
entries
Download this file
Search:
Table
Show
10
50
100
1000
entries
Download this file
Search:
Table
Show
10
50
100
1000
entries
Download this file
Search:
Table
Show
10
50
100
1000
entries
Download this file
Search:
Table
Show
10
50
100
1000
entries
Download this file
Search:
Table
Show
10
50
100
1000
entries
Download this file
Search:
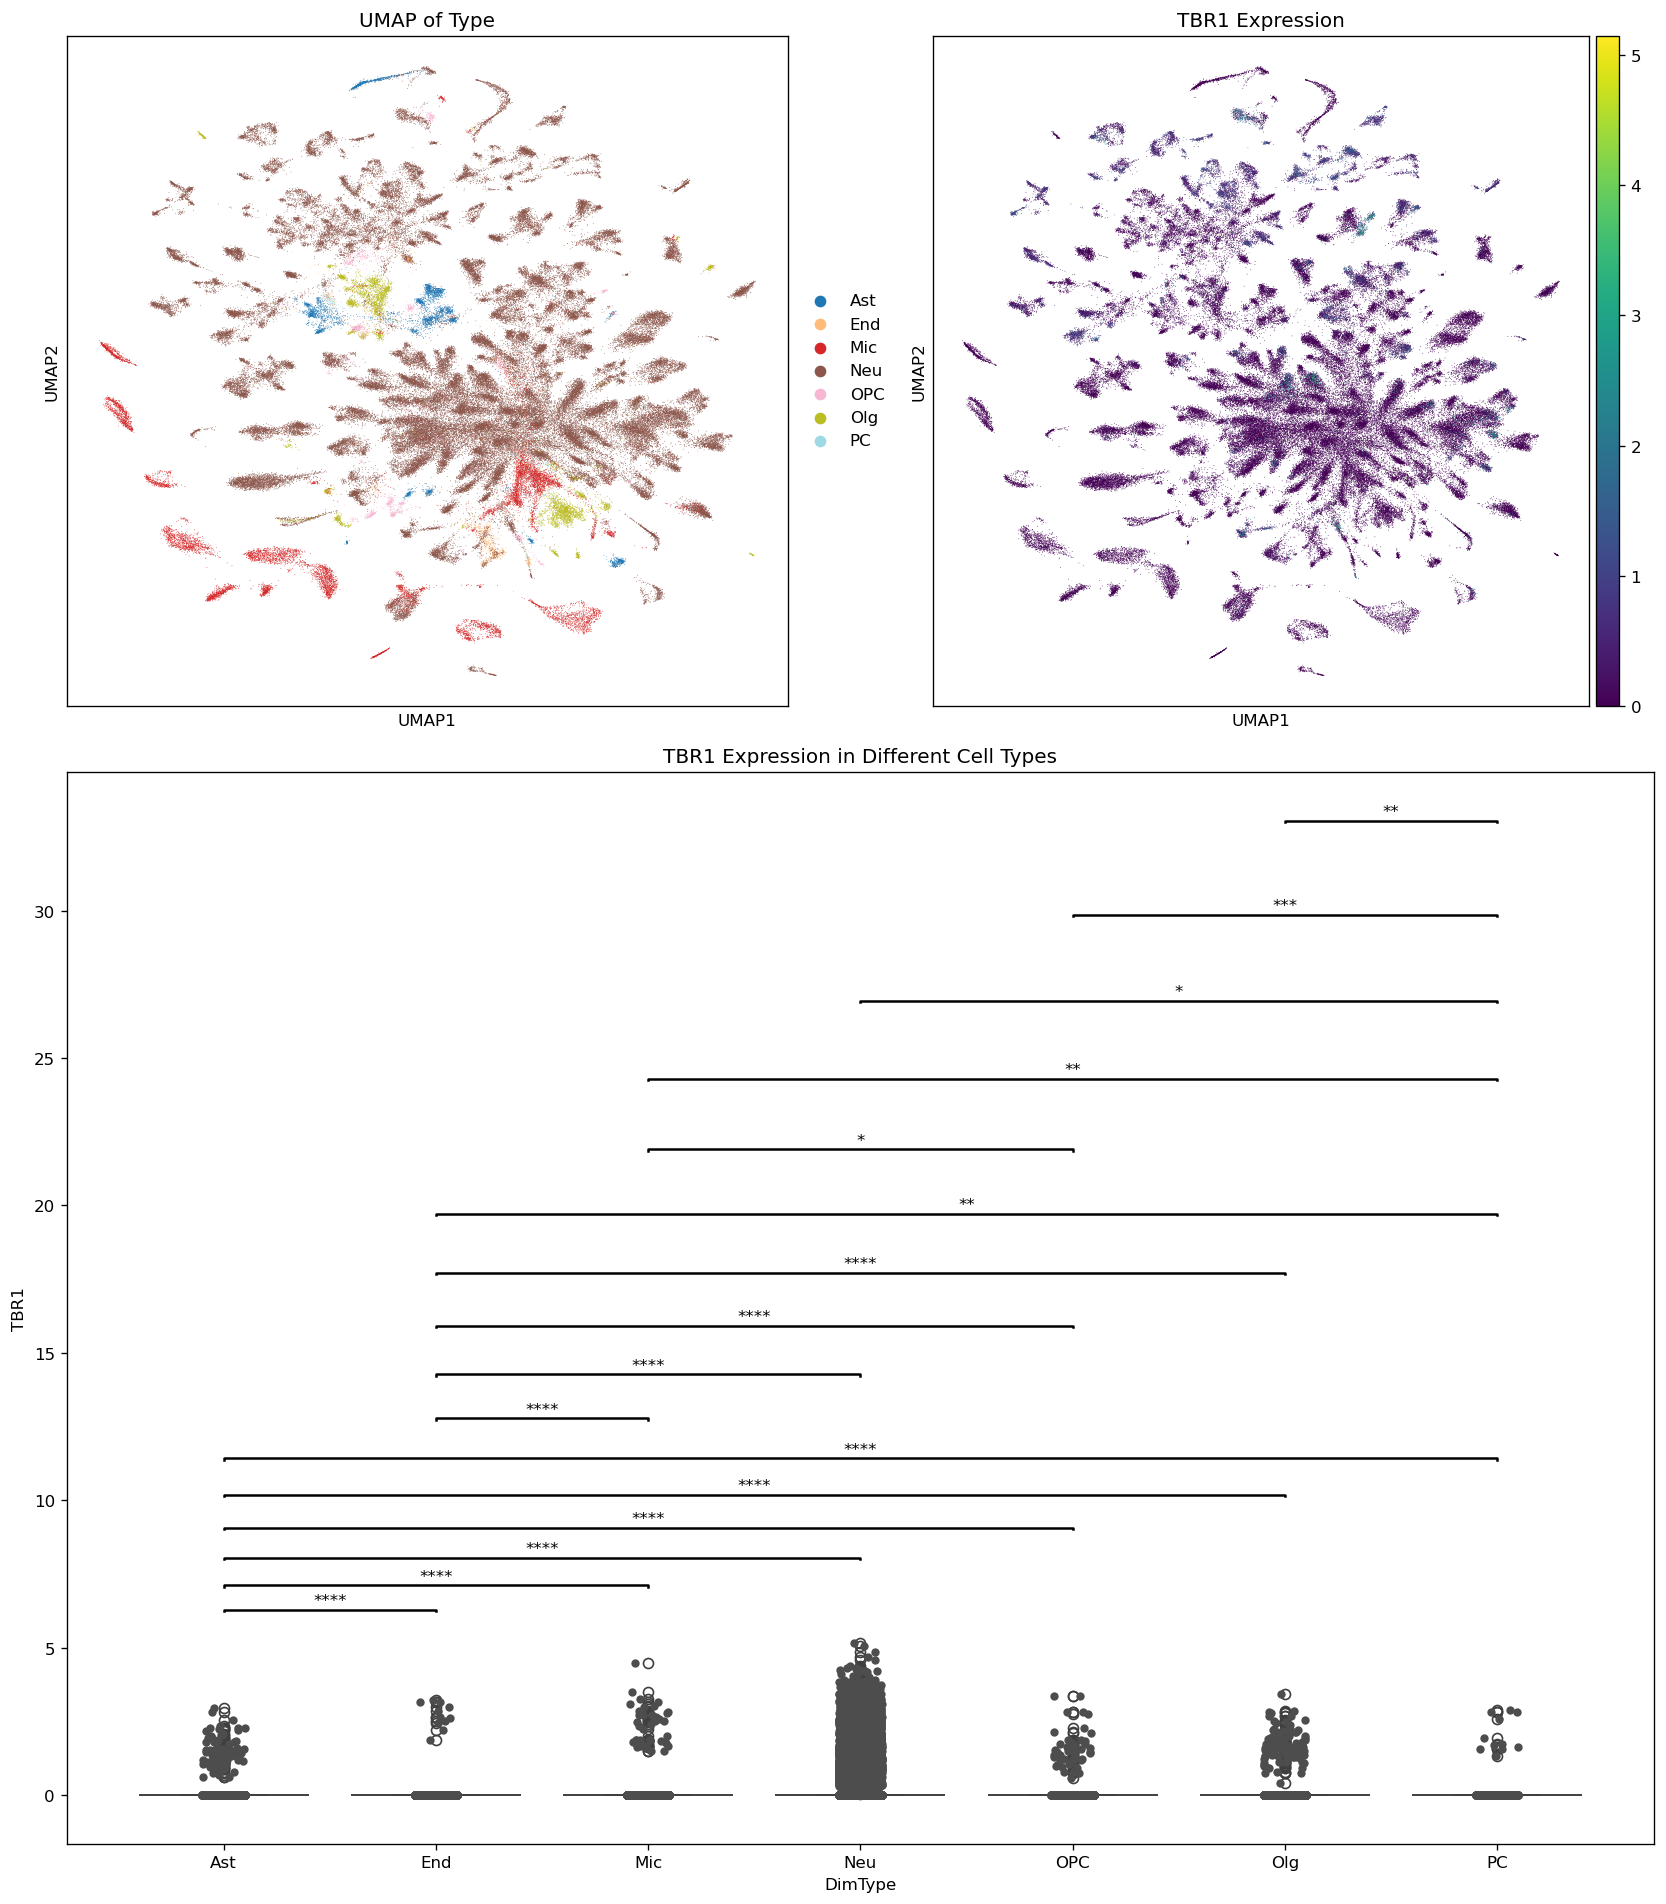
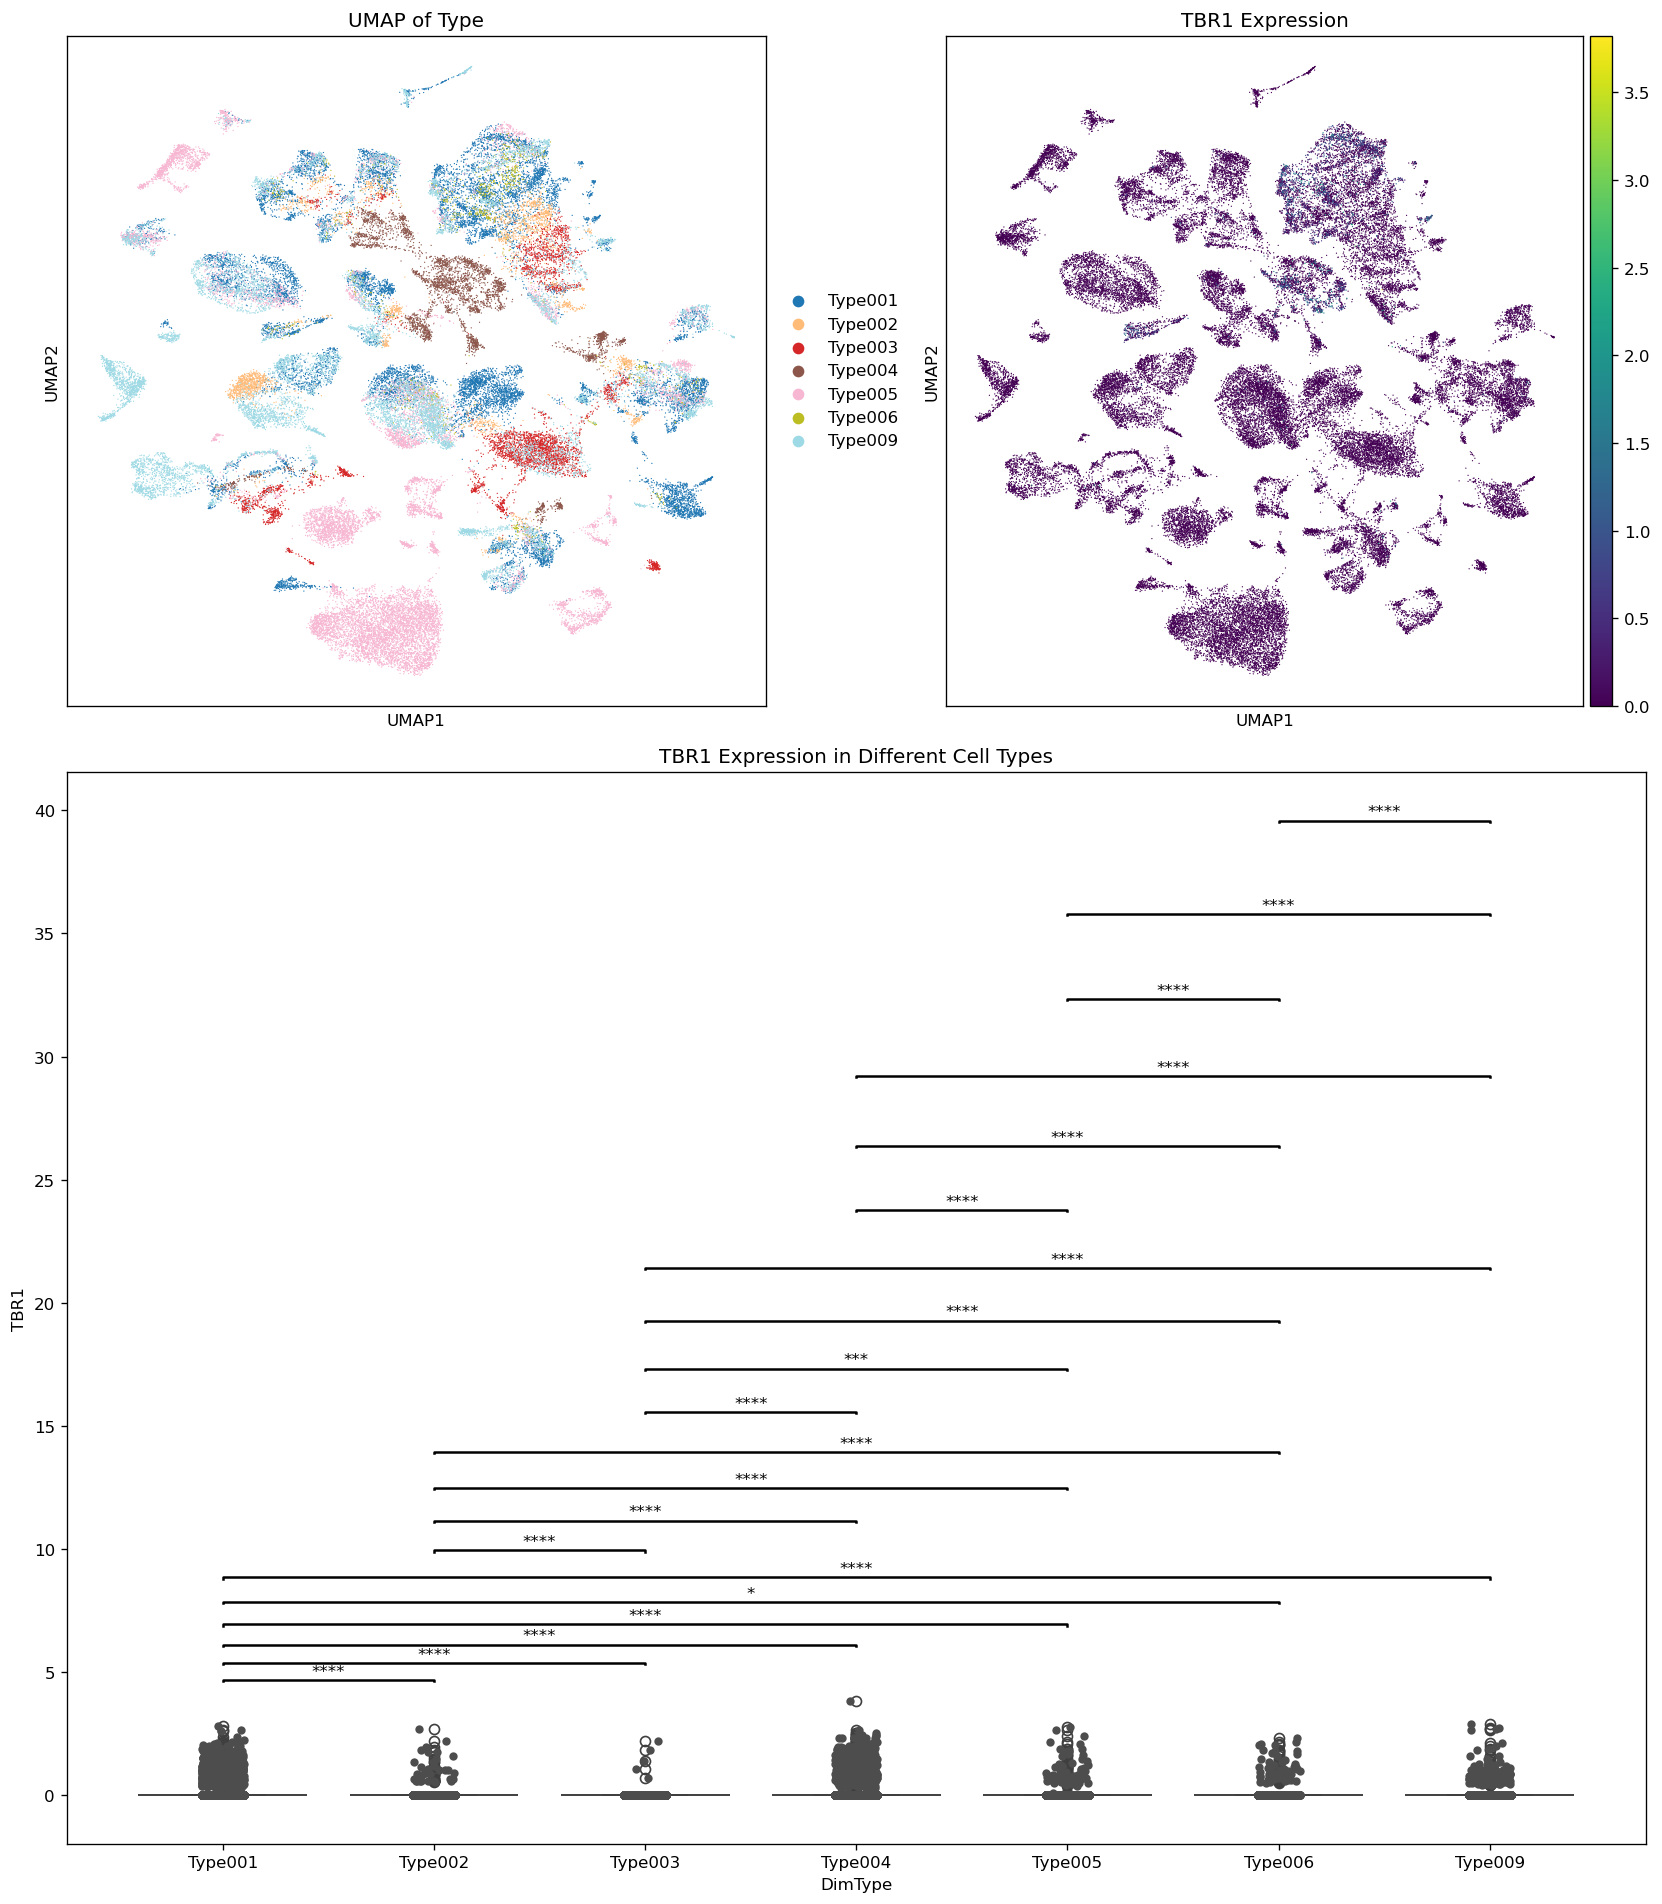
Part05: TimeScale Unbiased Review of cellType and Lineage Expression
Turtle
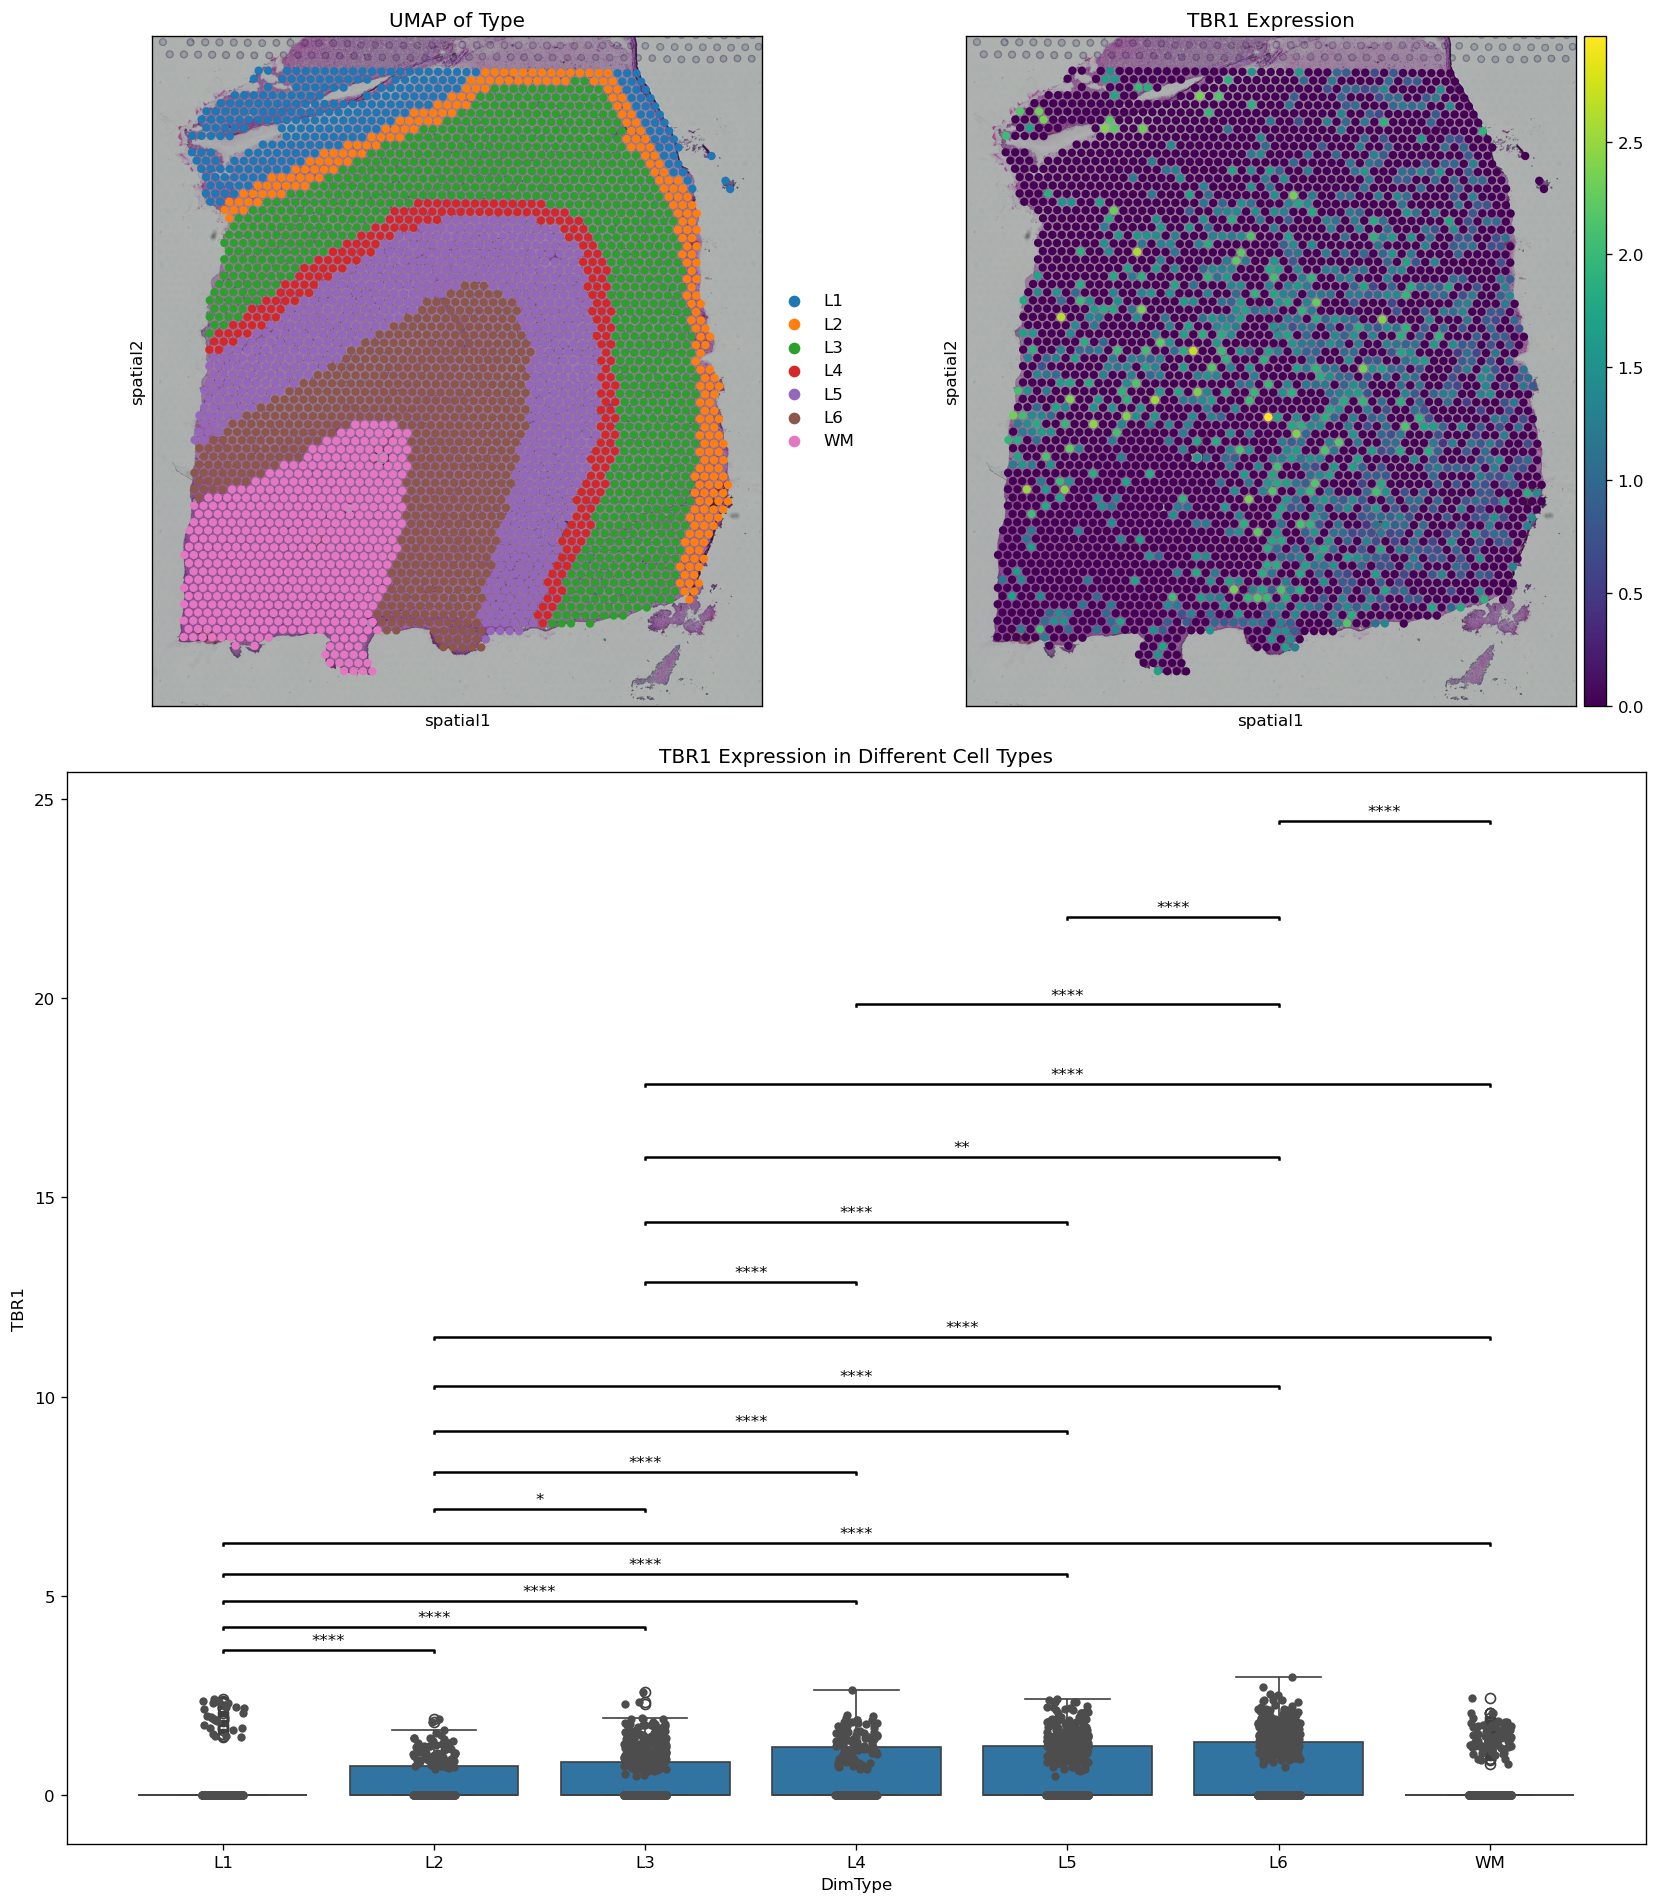
Part06: Space dynamic of gene expression
SpaceDyn
The geneset you selected is:
More
Species
Tissue
Devo
Diz
View gene expression profiles of different chips
Show me
Part07: Pathology dynamic of gene expression
PathologyDyn
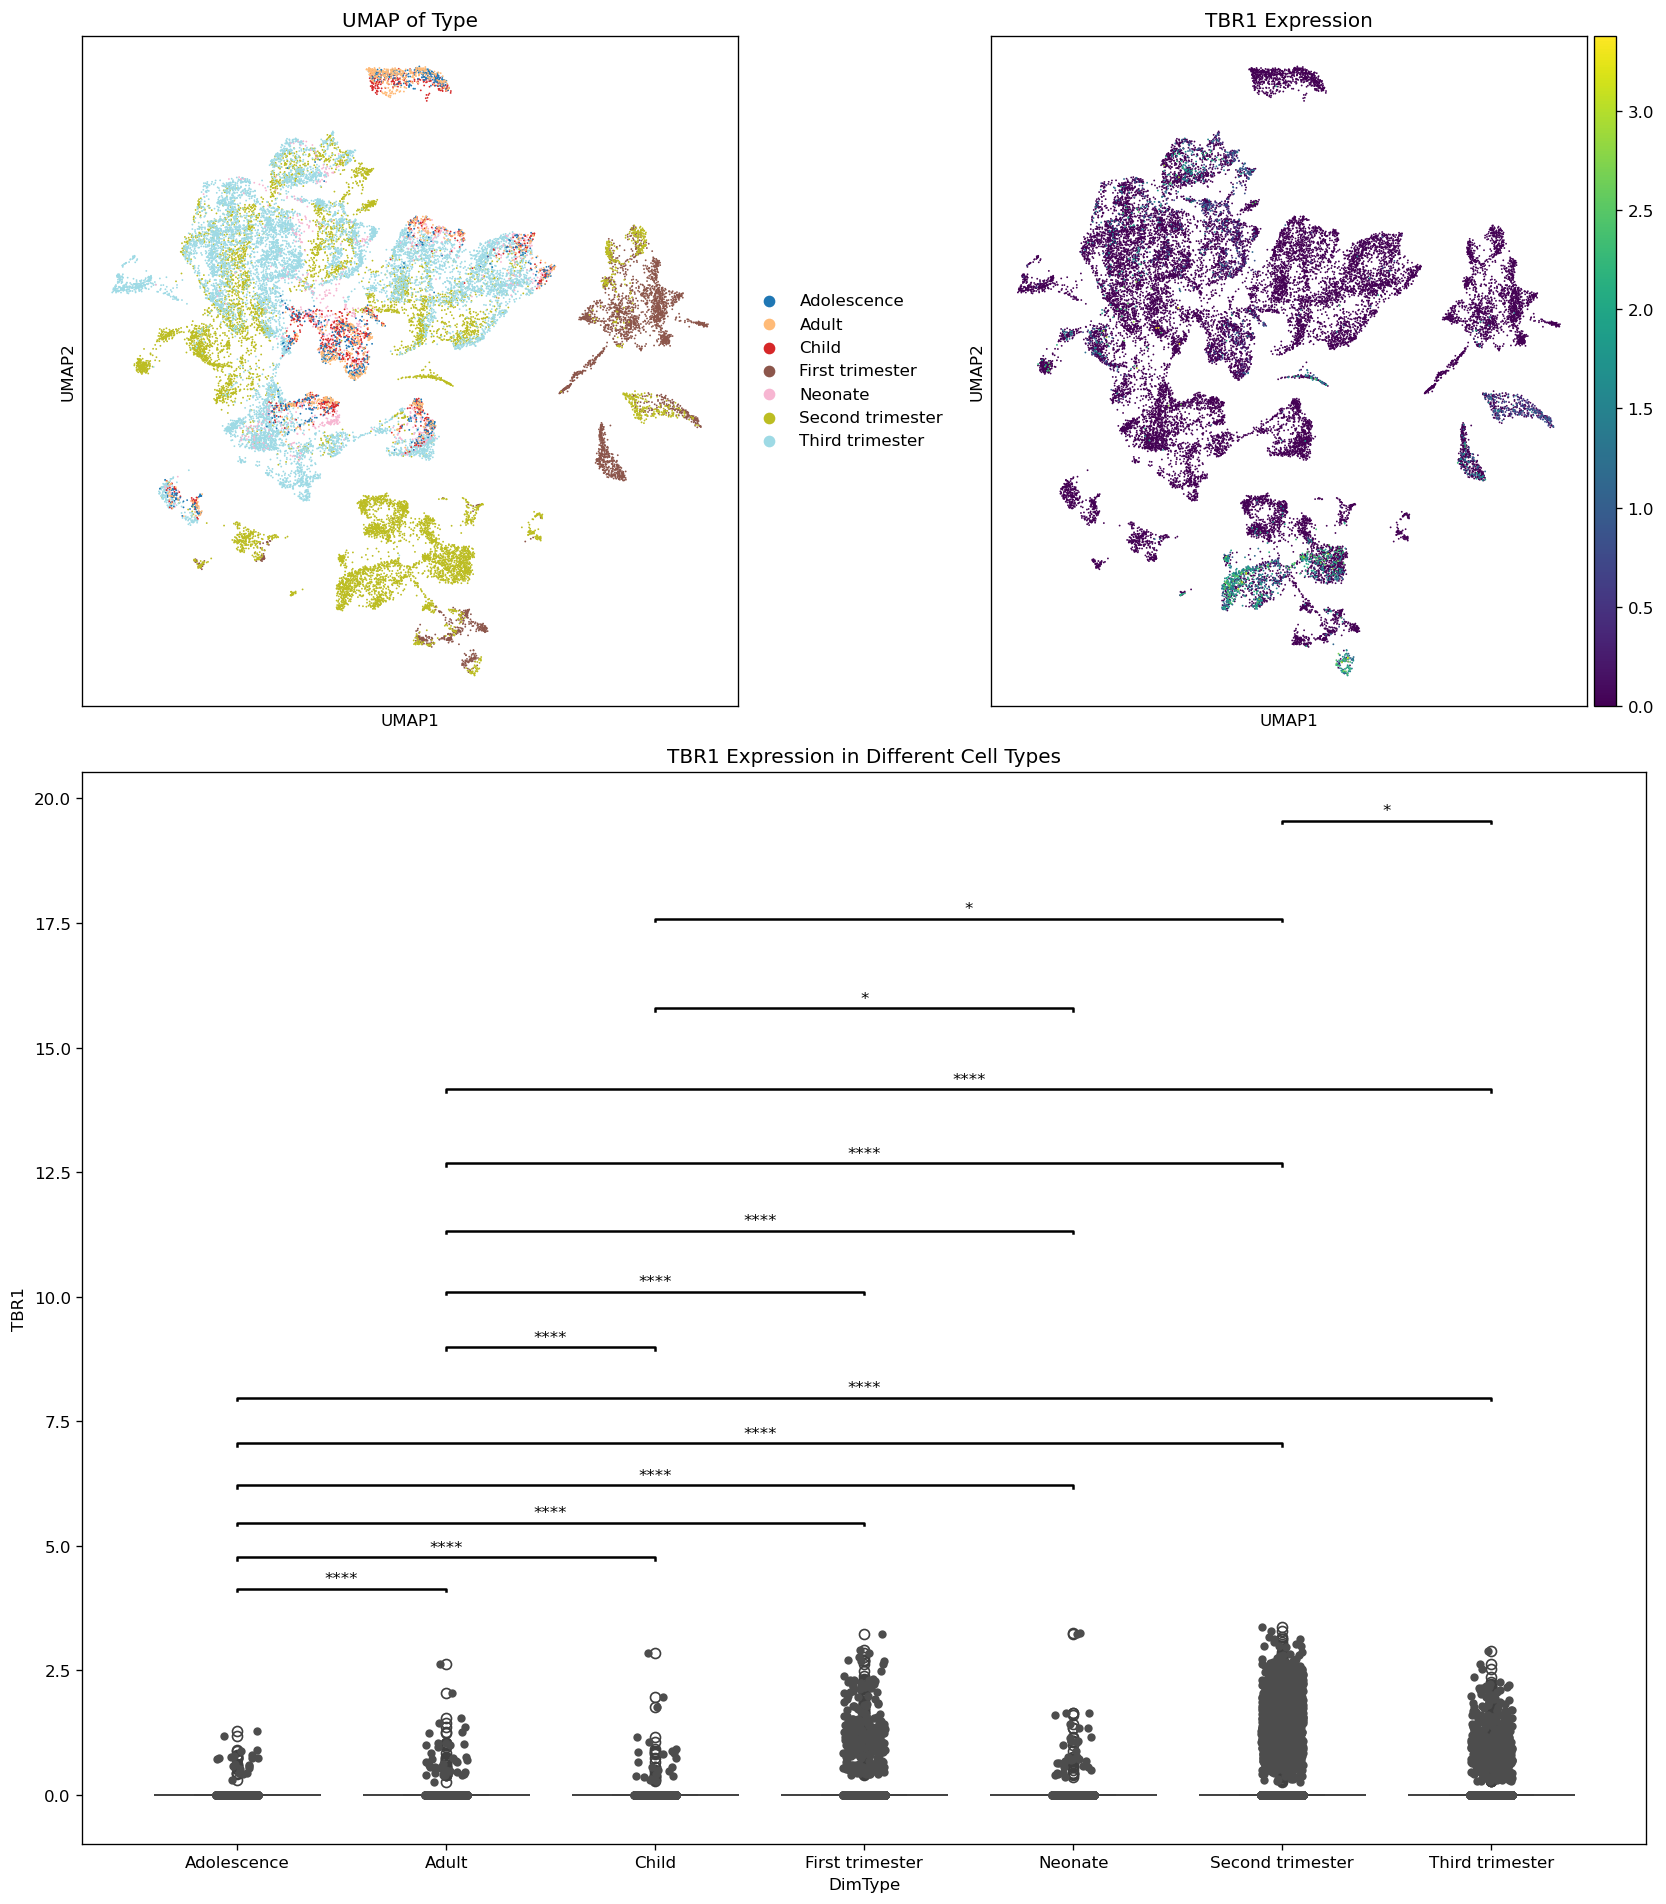
Part08: Age dynamic of gene expression
AgeDyn
Part09: Region dynamic of gene expression
RegionDyn
Part10: Tissue dynamic of gene expression
TissueDyn
Part11: Atlas dynamic of gene expression
AtlasDyn
Part12: Pathology rank
PathoRank
Table
Show
10
50
100
1000
entries
Download this file
Search:
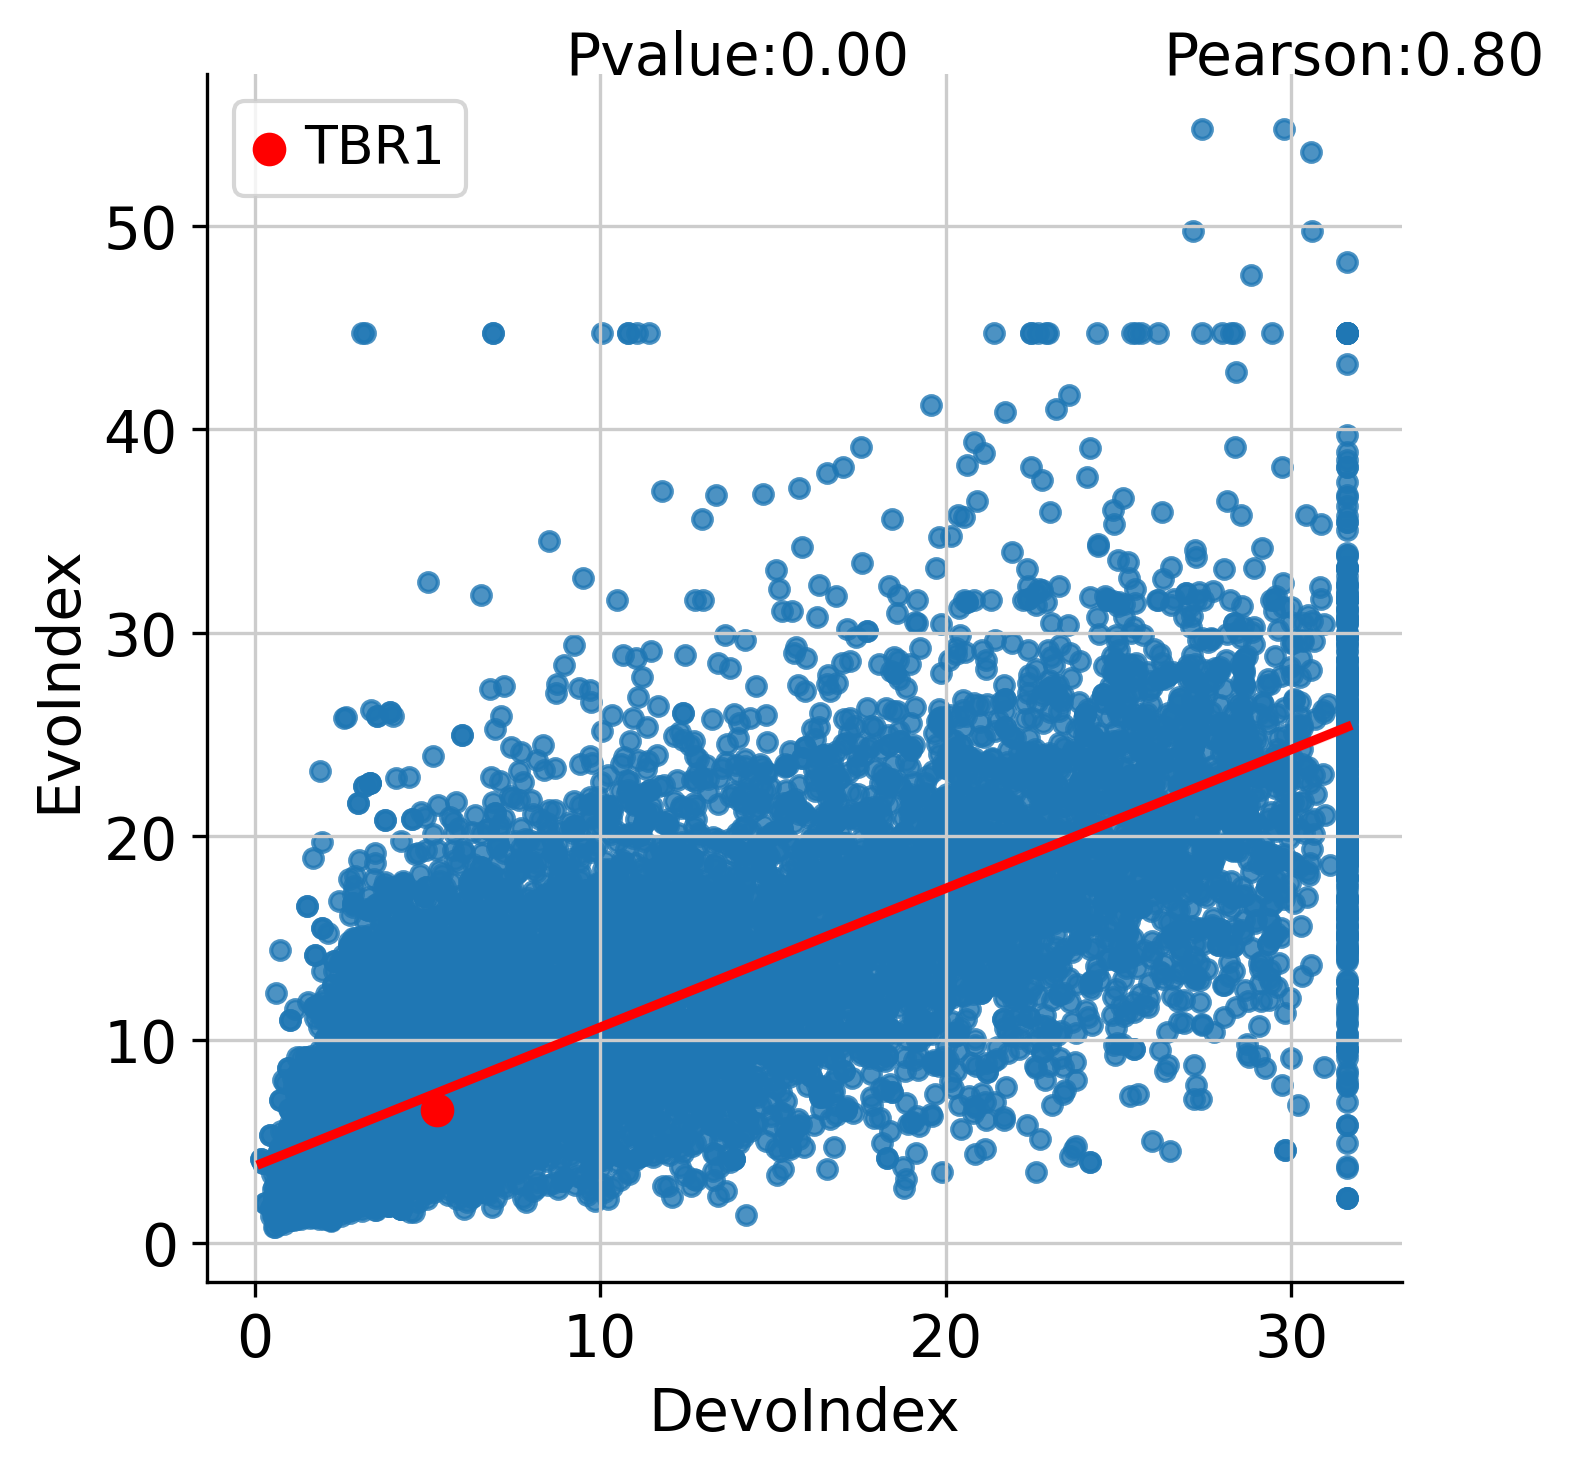
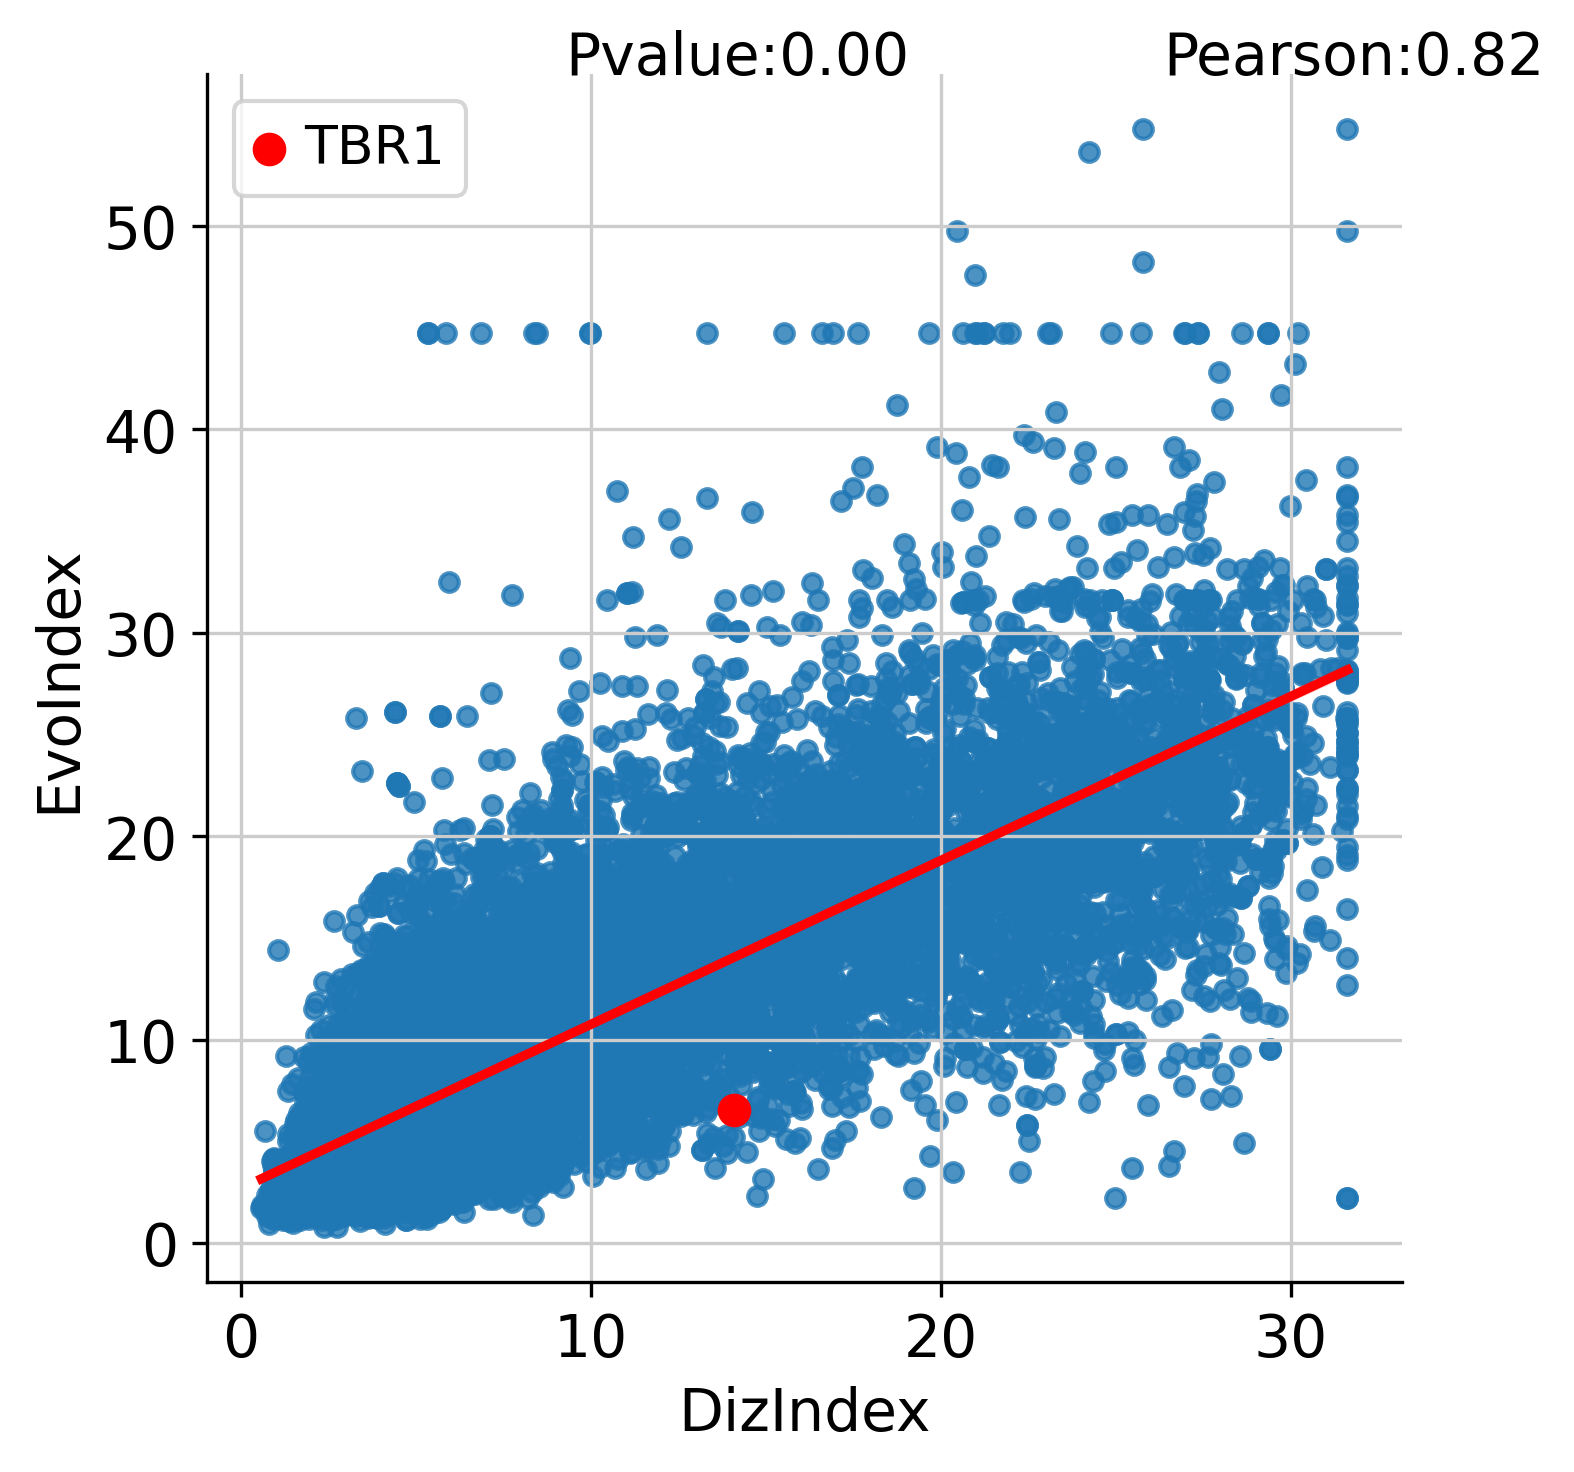
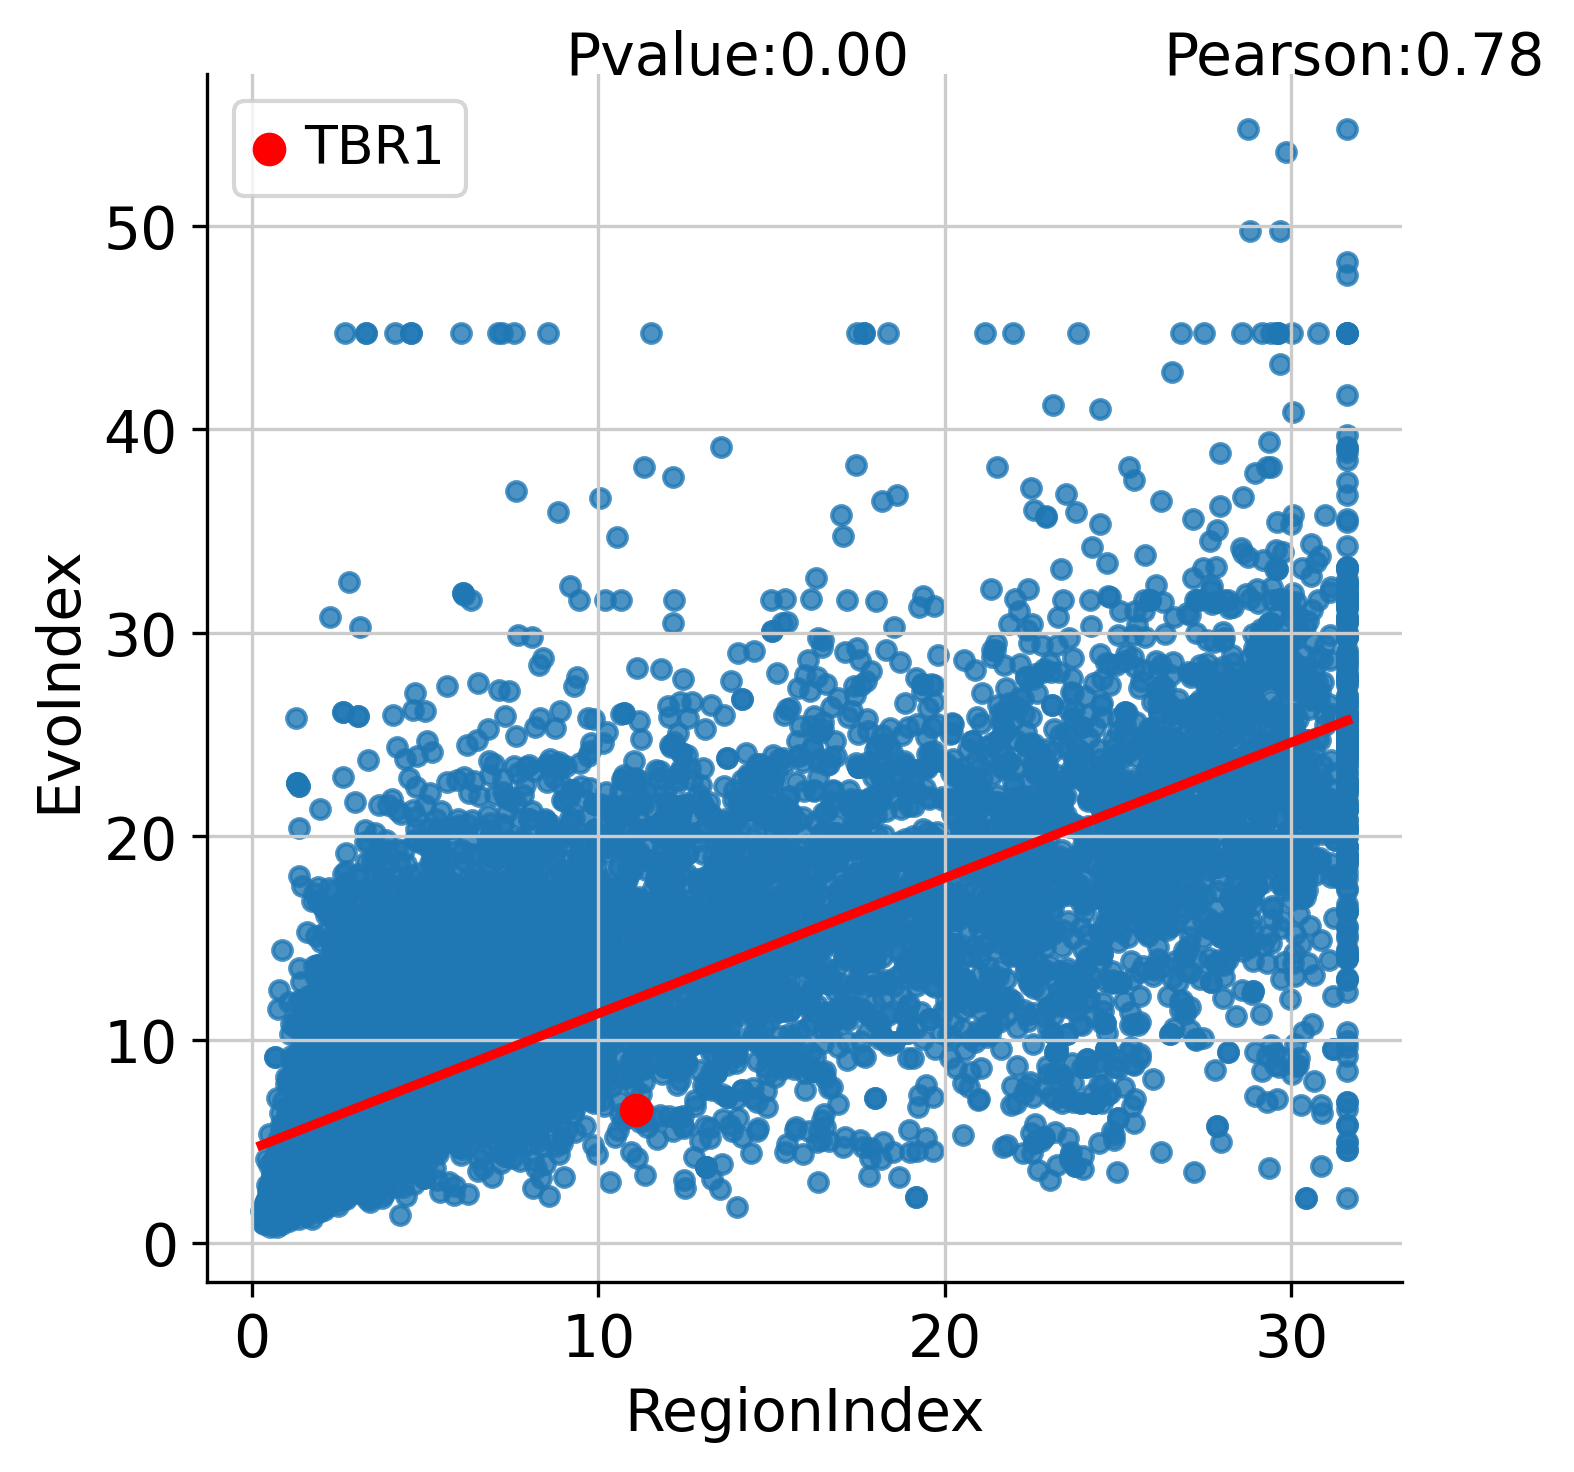
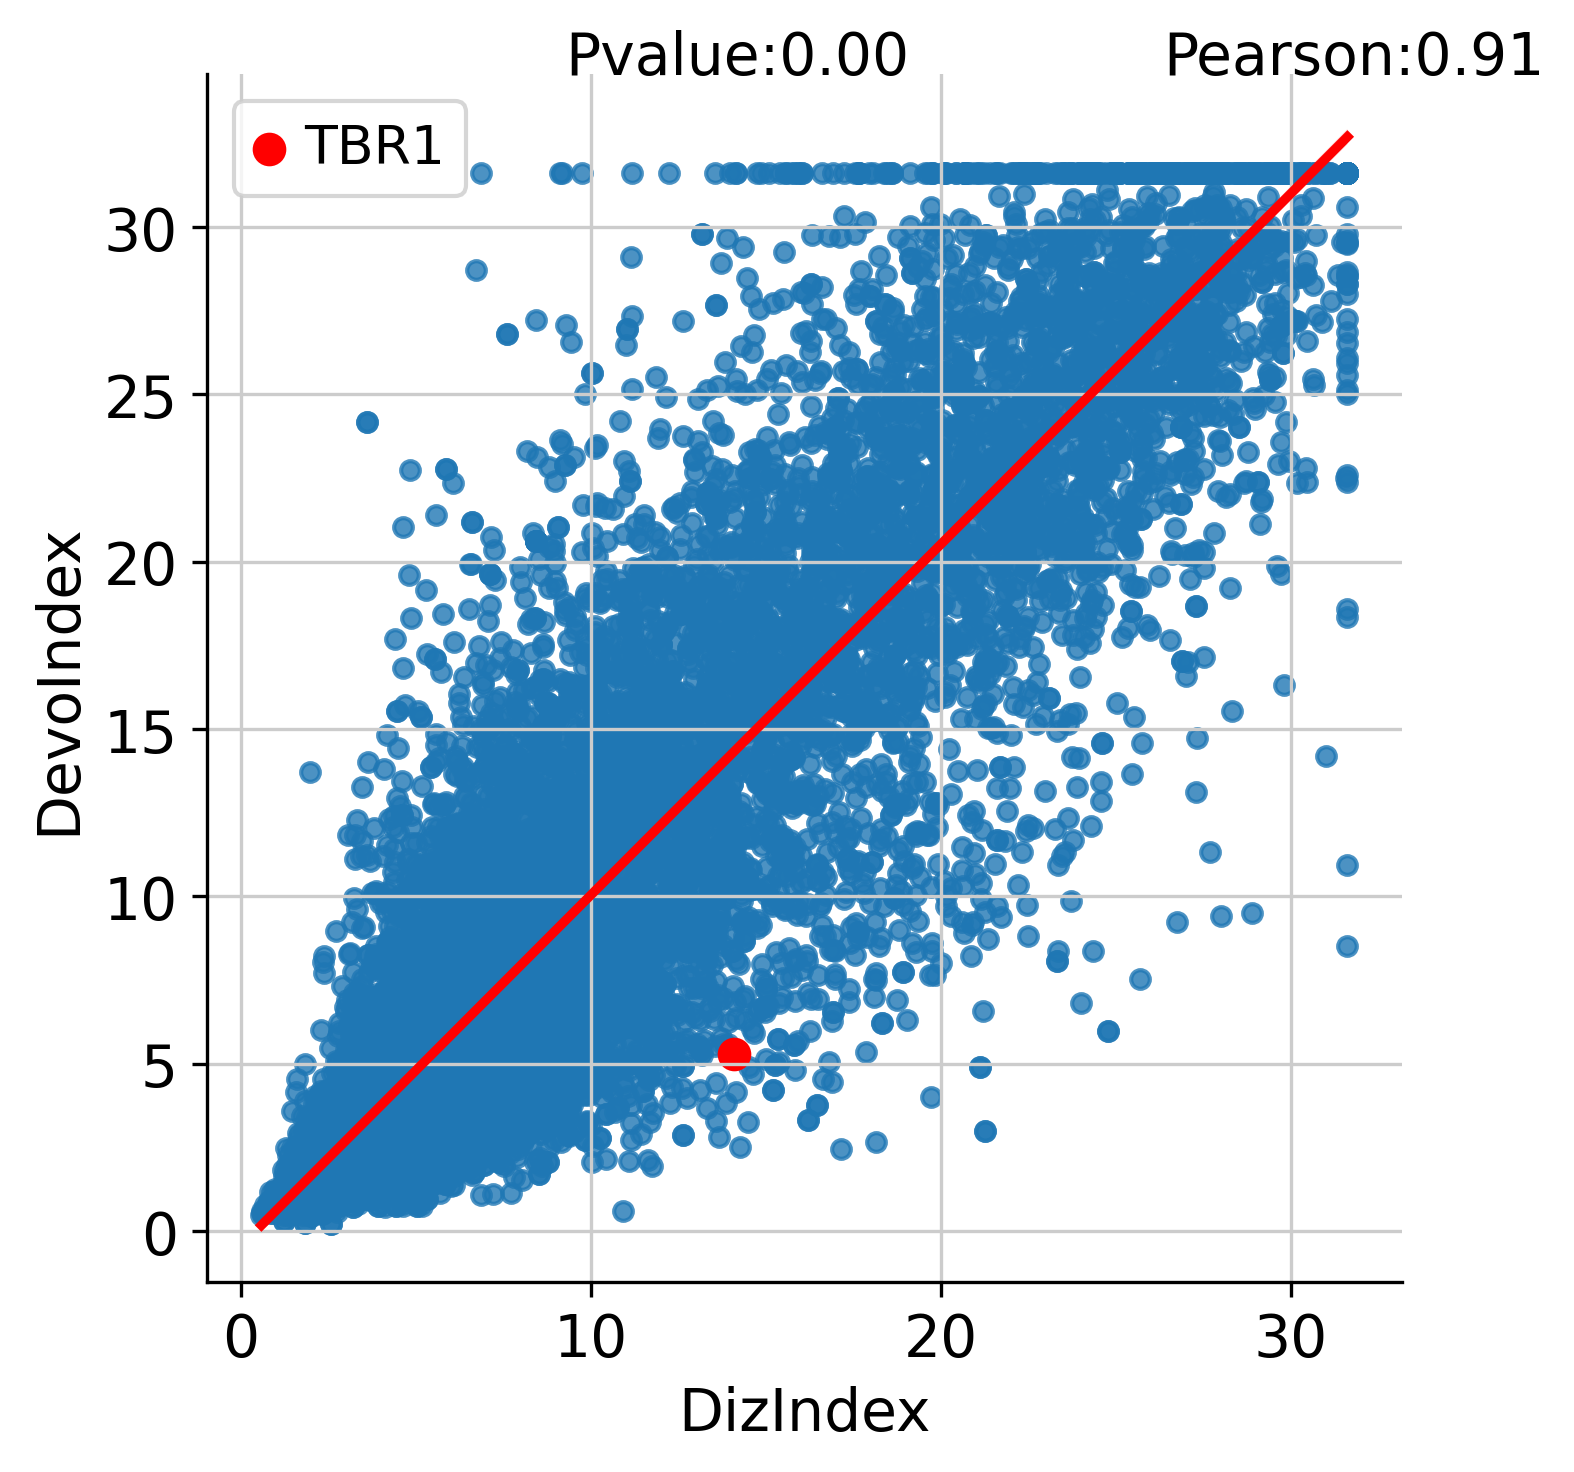
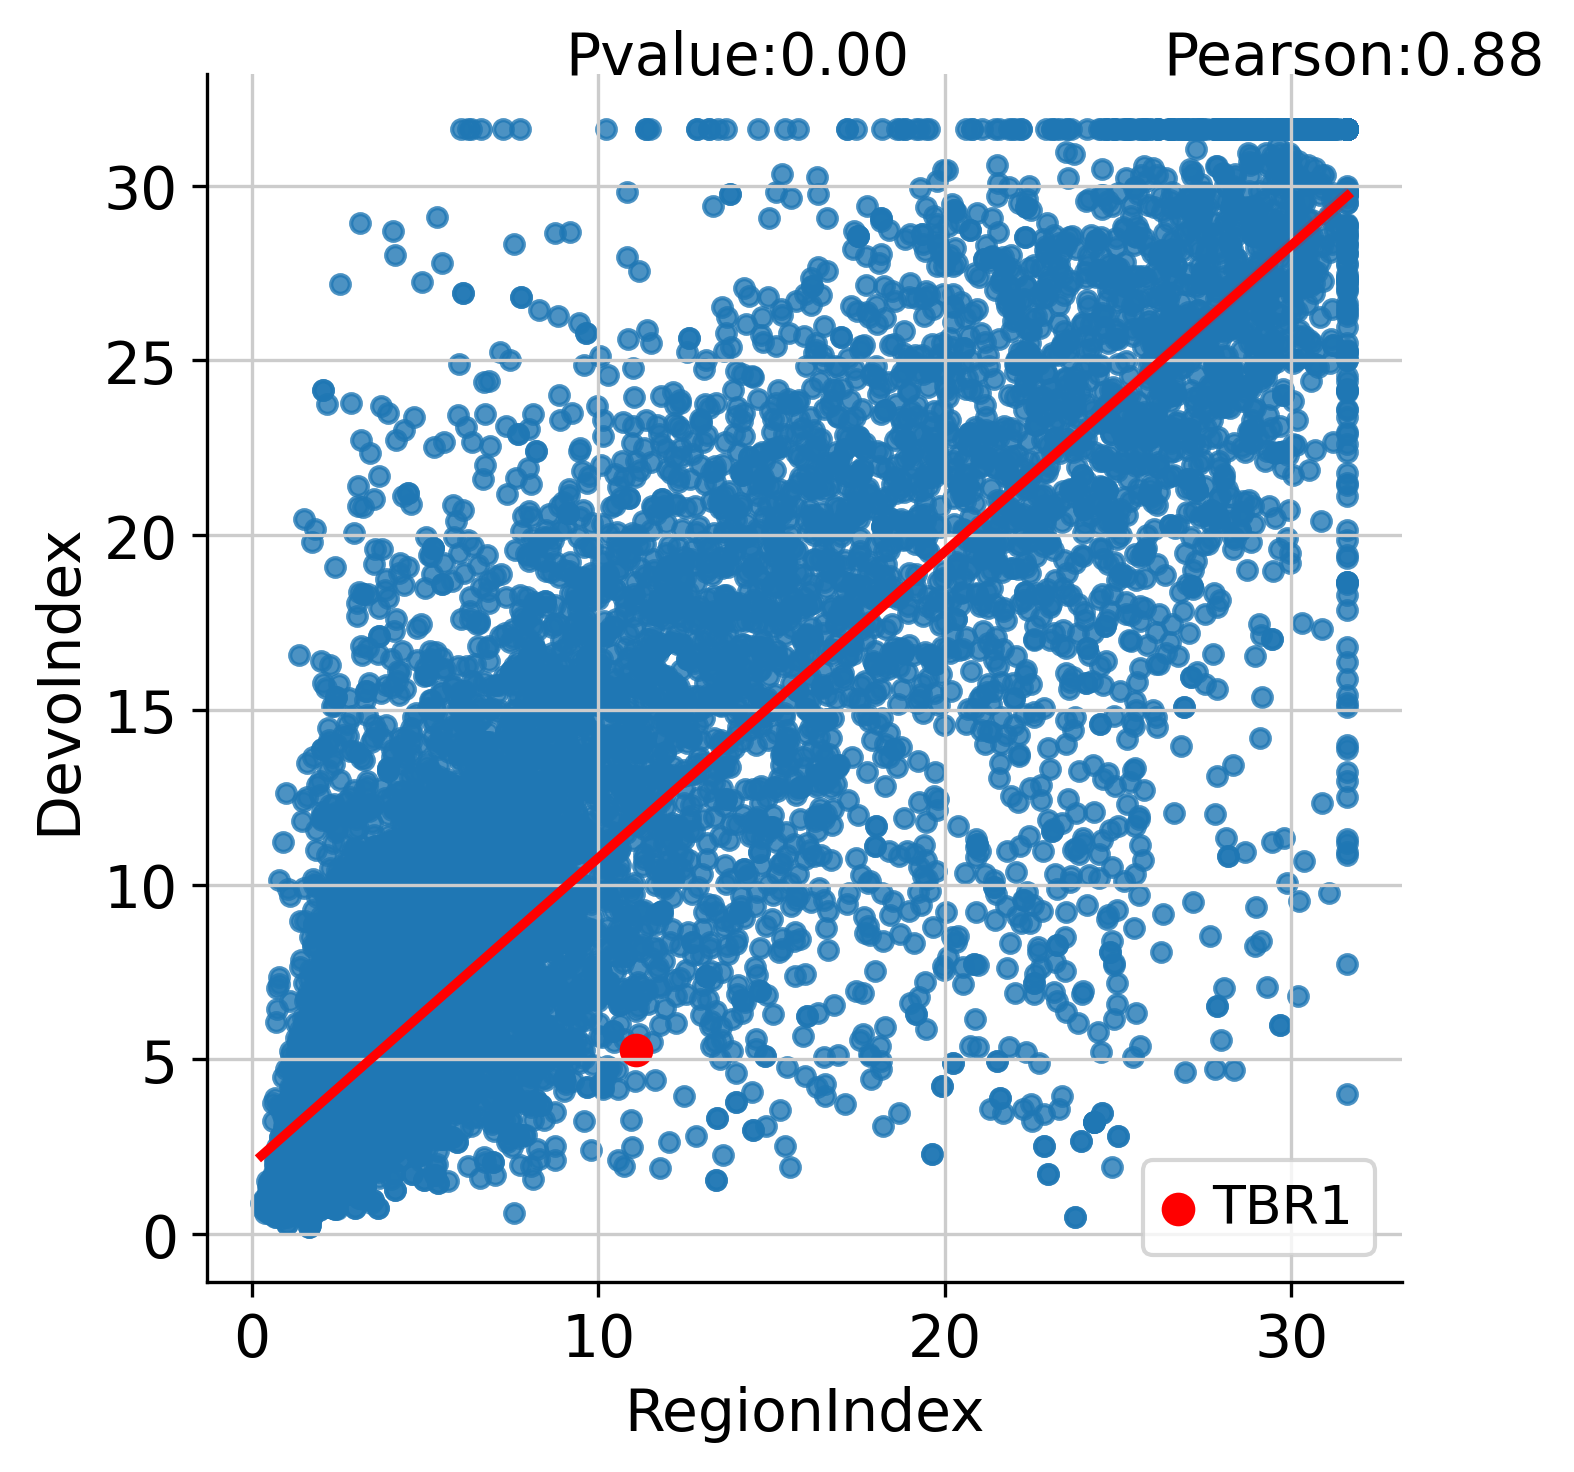
Part13: Index analysis
Index
Part14: Correlation analysis
EvoDevo
EvoDiz
EvoRegion
EvoCellType
DevoDiz
DevoRegion
DevoCellType
DizRegion
DizCellType
RegionCellType
Image
Image
Image
Image
Image
Image
Image
Image
Image
Image
Part15: Therapeutic targets correlation analysis (630 FDA approved therapeutic targets)
Target
Table
Show
10
50
100
1000
entries
Download this file
Search:
Part16: Understanding the mechanism of disease by pathway correlation analysis
Understand
Table
Show
10
50
100
1000
entries
Download this file
Search:
Part17: Resource ACCOrding to atlas ONtology
Raccoon
Part18: External database links
Extend
Part19: Step by step navigation of BrainStorm database from A to Z
SBSnavi
PassportInfo and GenePartners
Heterogeneity
Organogenesis
Spider
Turtle
SpaceDyn
PathologyDyn
AgeDyn
RegionDyn
TissueDyn
AtlasDyn
PathoRank
Index
Correlation
Target
Understand
Raccoon
ExternalLink
SBSnavi