SpaceScope is a spatially resolved transcriptomic brain atlas that allows users to analyze gene expression using high-resolution spatial transcriptomics (ST) data. The module comprises 1,154 spatially resolved sections, covering brain, spinal cord, and embryonic tissues, providing a comprehensive resource for studying spatial gene expression patterns across different developmental and physiological states. SpaceScope offers three key functional modules: sPandora & ePandora allow users to visualize single-gene and gene-set expression across spatially resolved datasets; and cPandora facilitates the exploration of spatial cell-type distributions, enabling comparative analysis across different datasets.
Single-dataset exploration
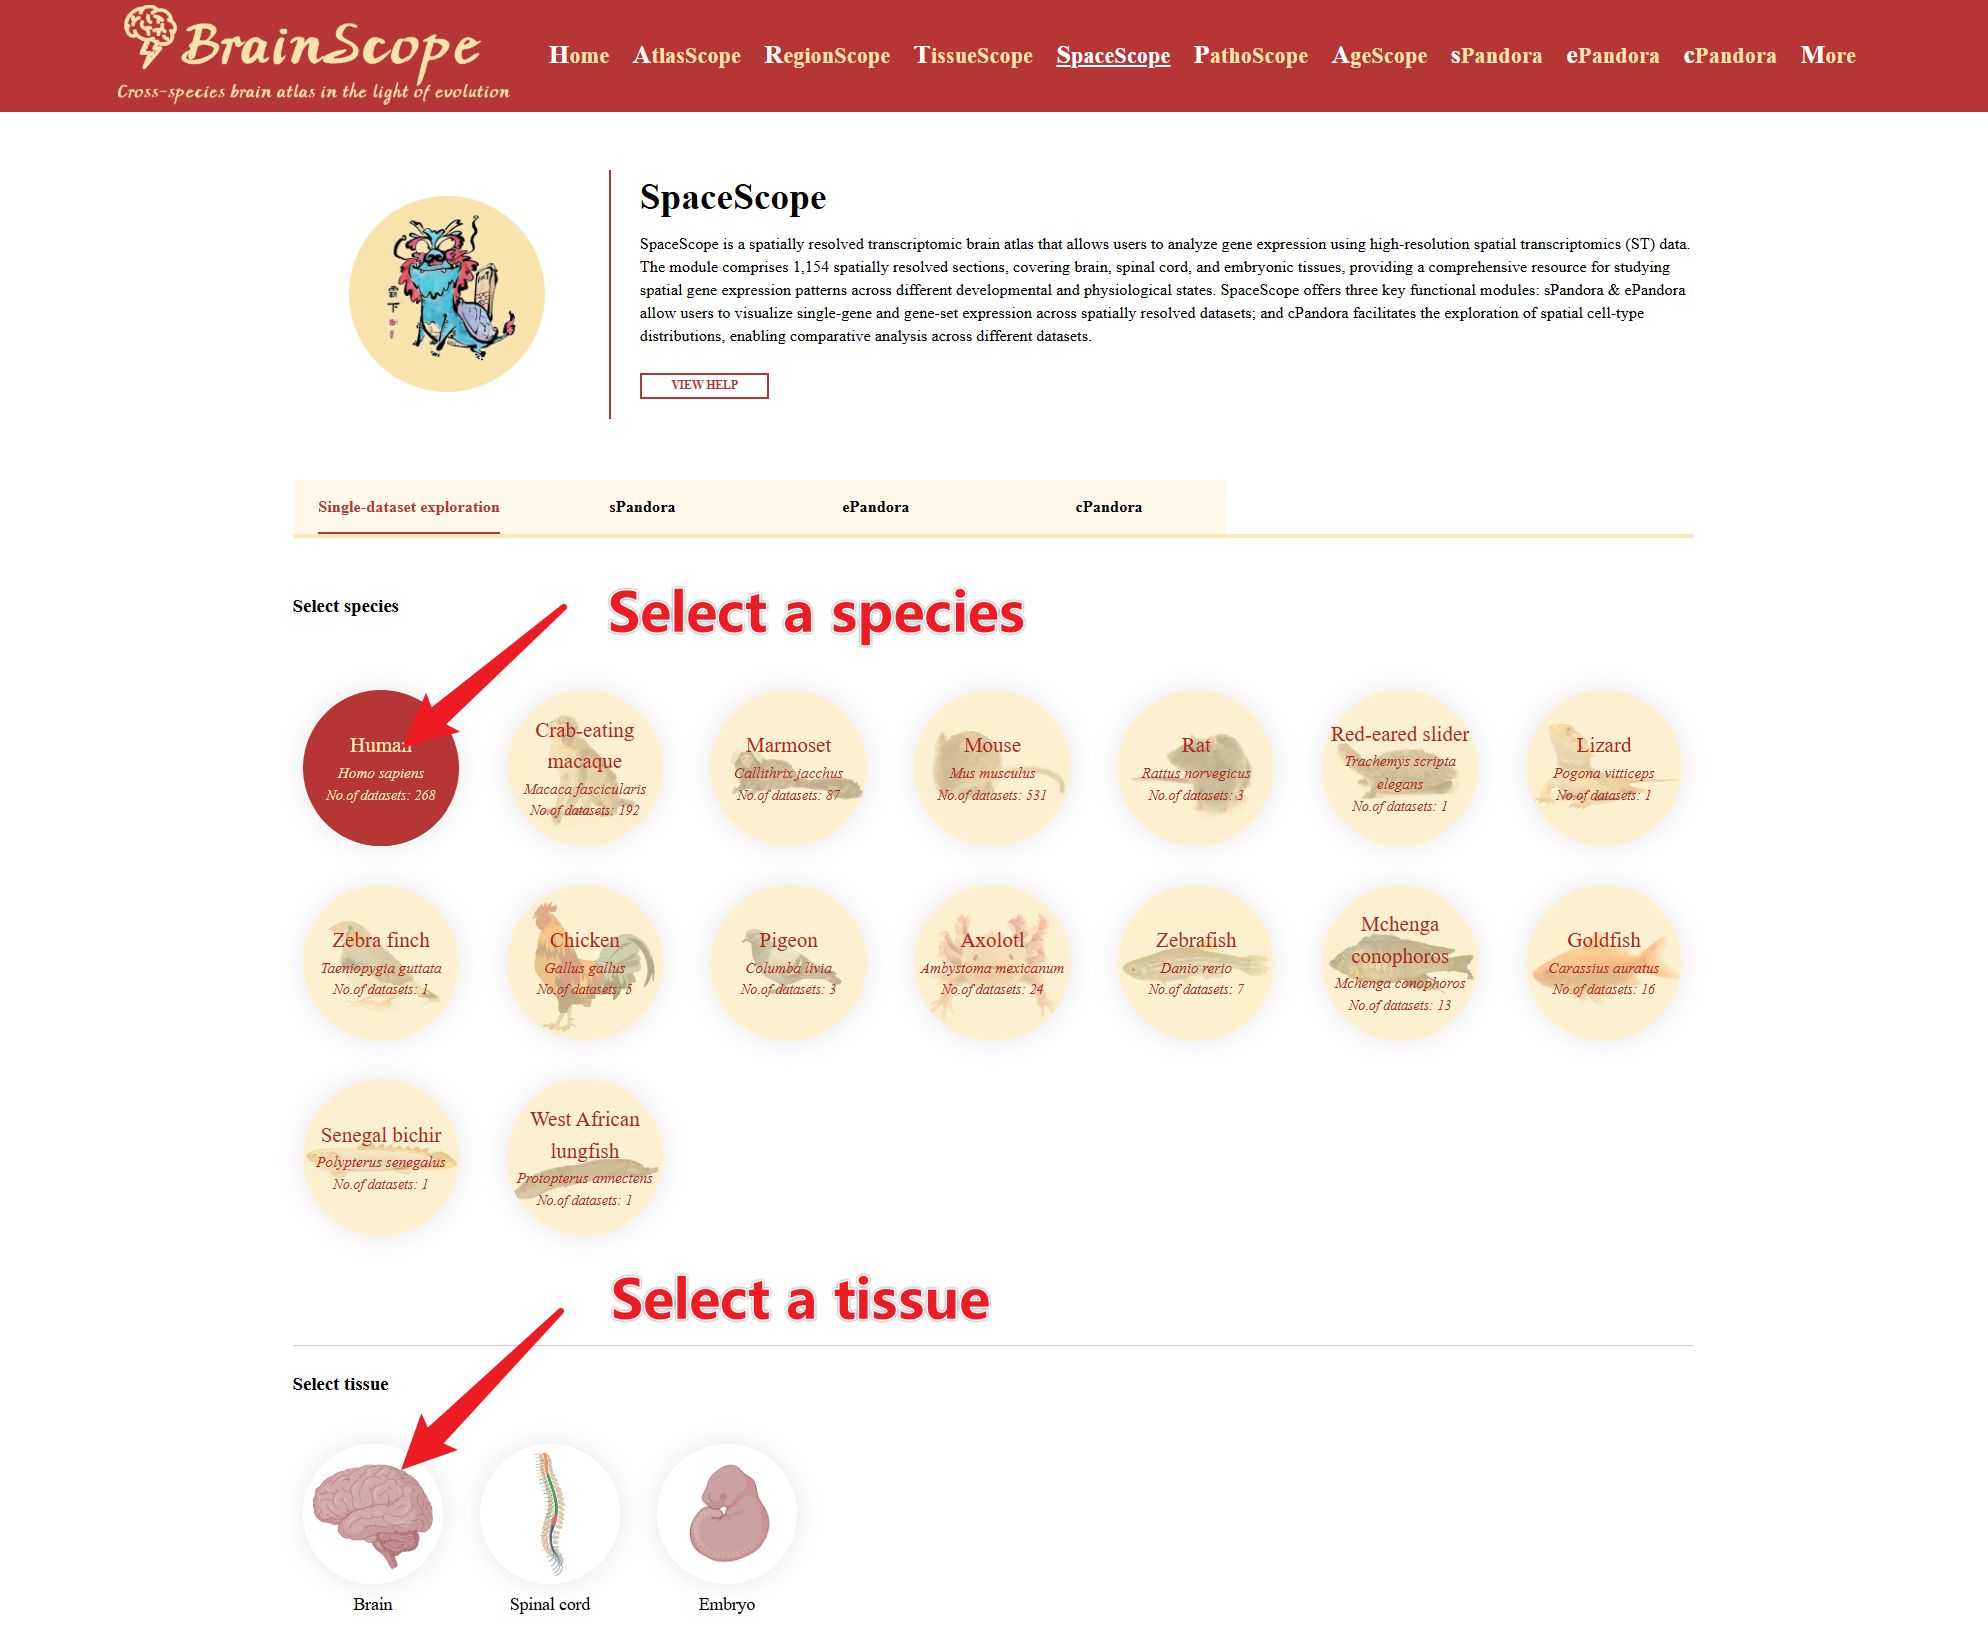
The DataSets tab allows users to filter, select, and retrieve spatial transcriptomics datasets based on species and tissue type.
Select a species of interest by clicking on its image. Choose tissue of interest for spatial transcriptomics analysis.
A table will be displayed, containing key dataset information:SpaceDataSetID (Unique identifier for the dataset), Common Name & Latin Name, Tissue Type, Spatial Transcriptomics Chip ID, Select, Detail, and ViewData options.
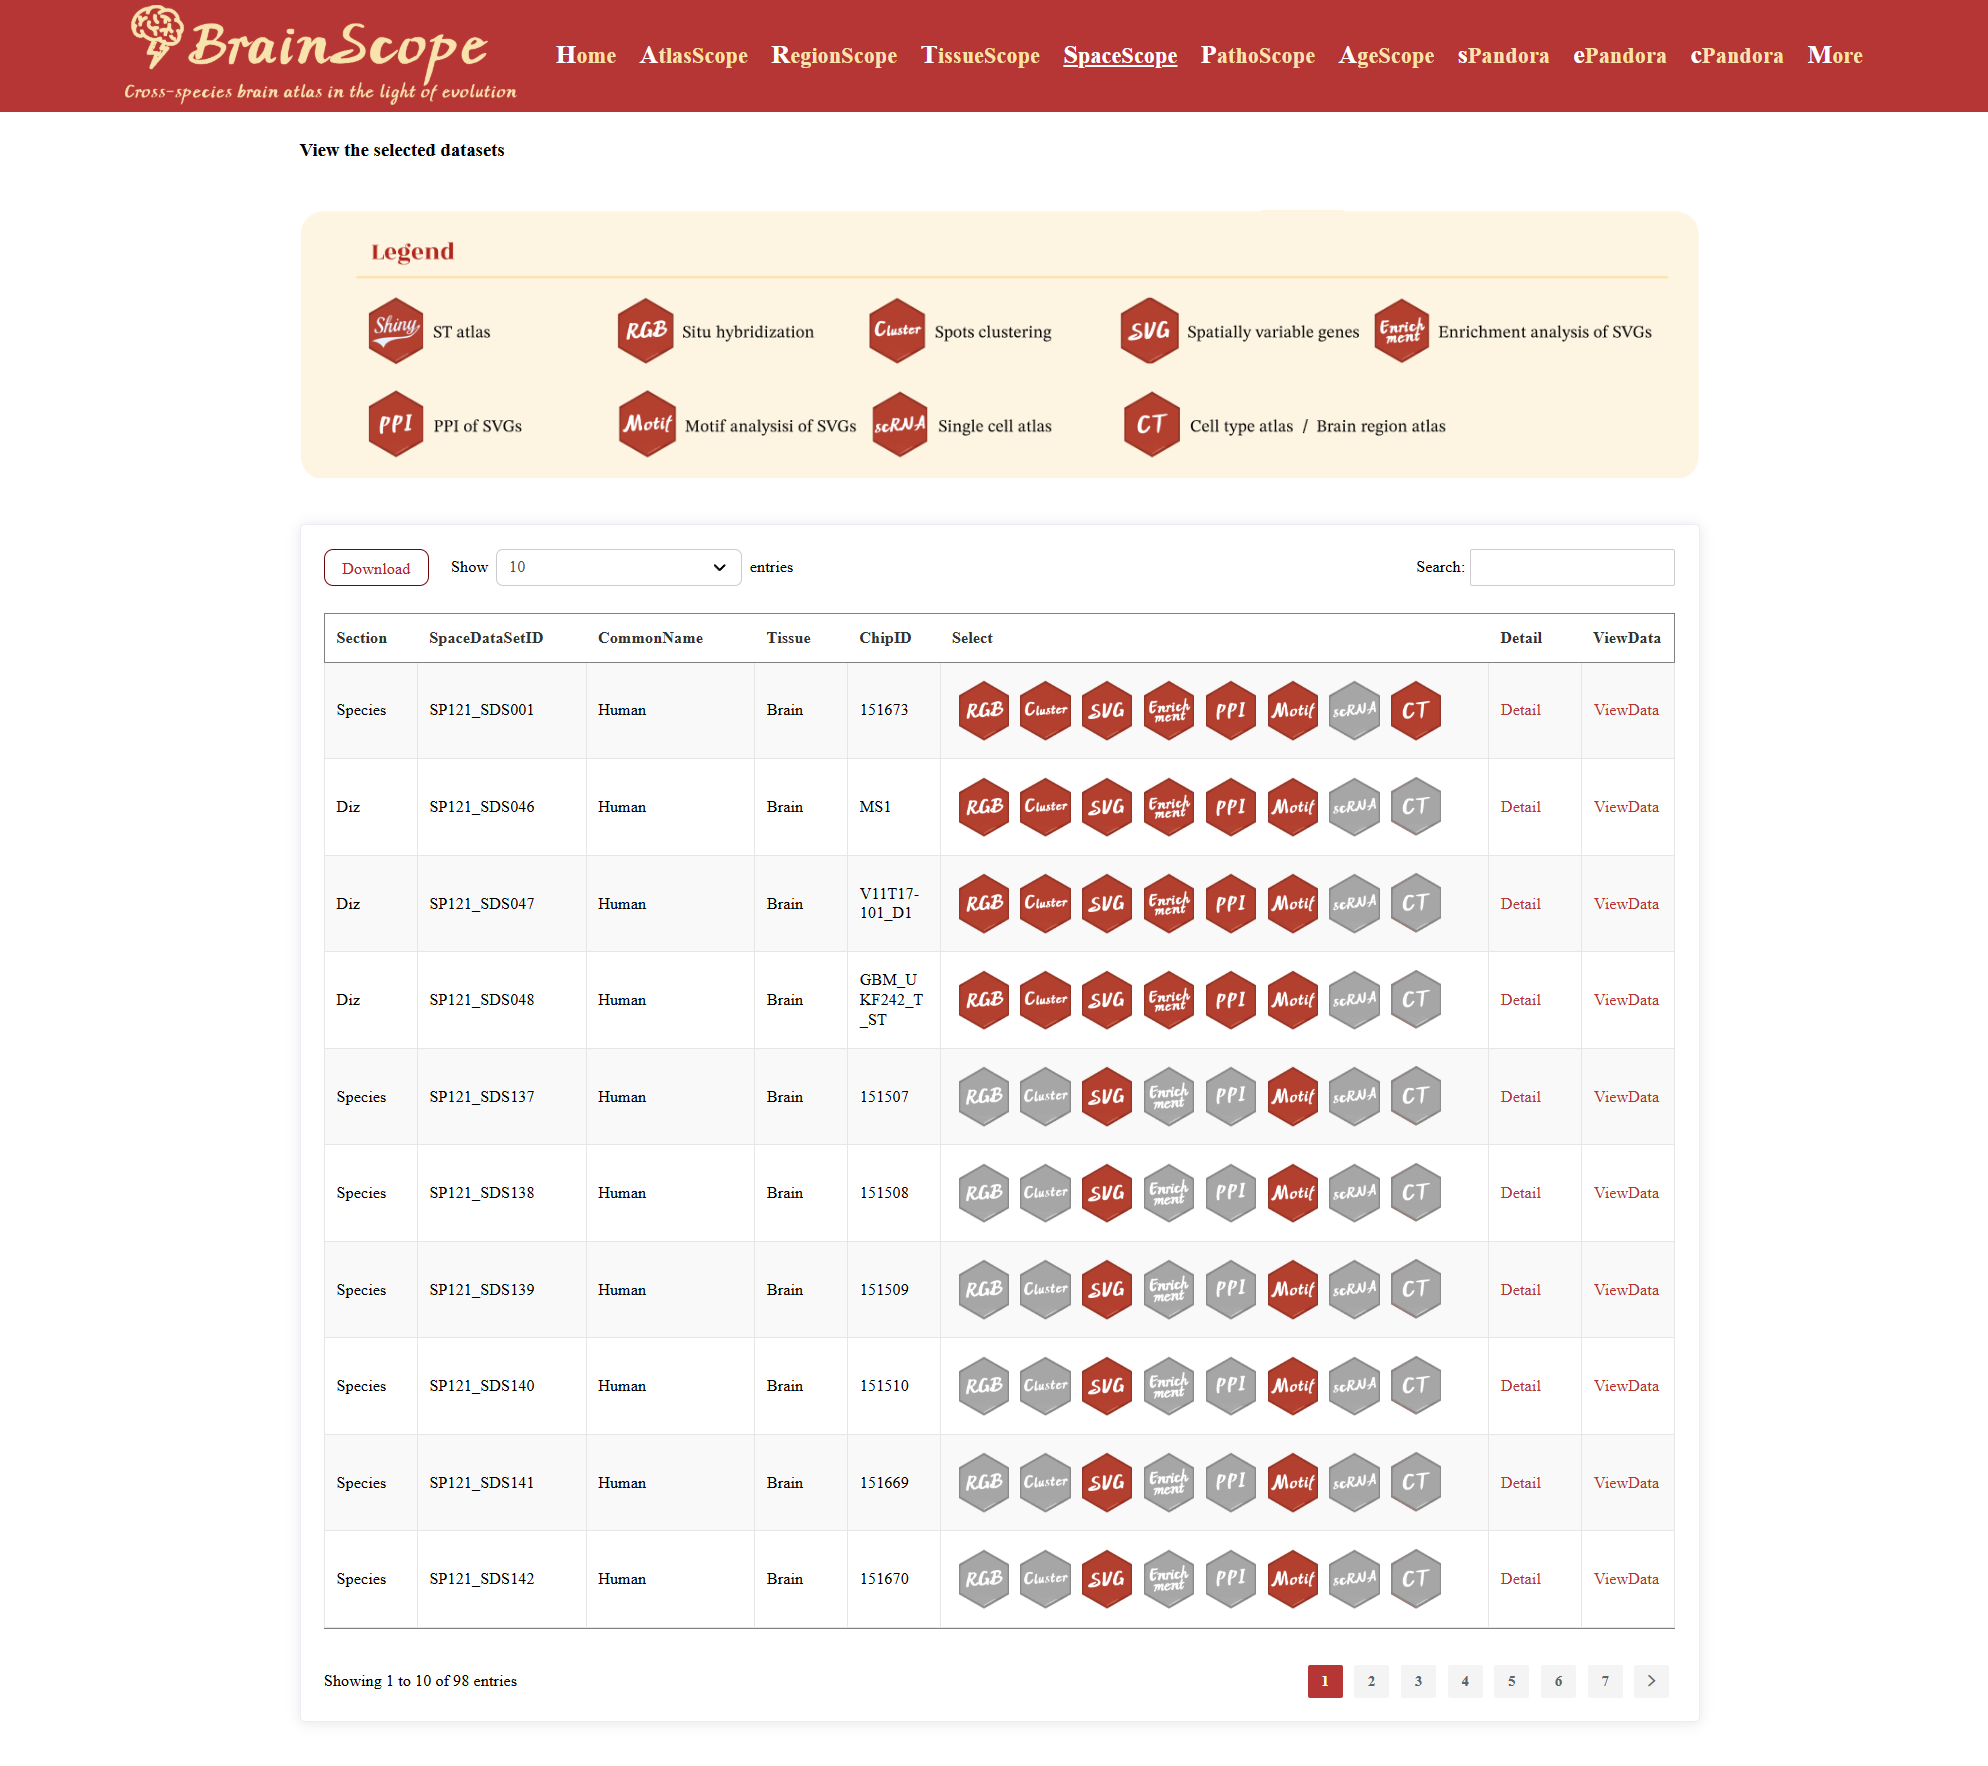
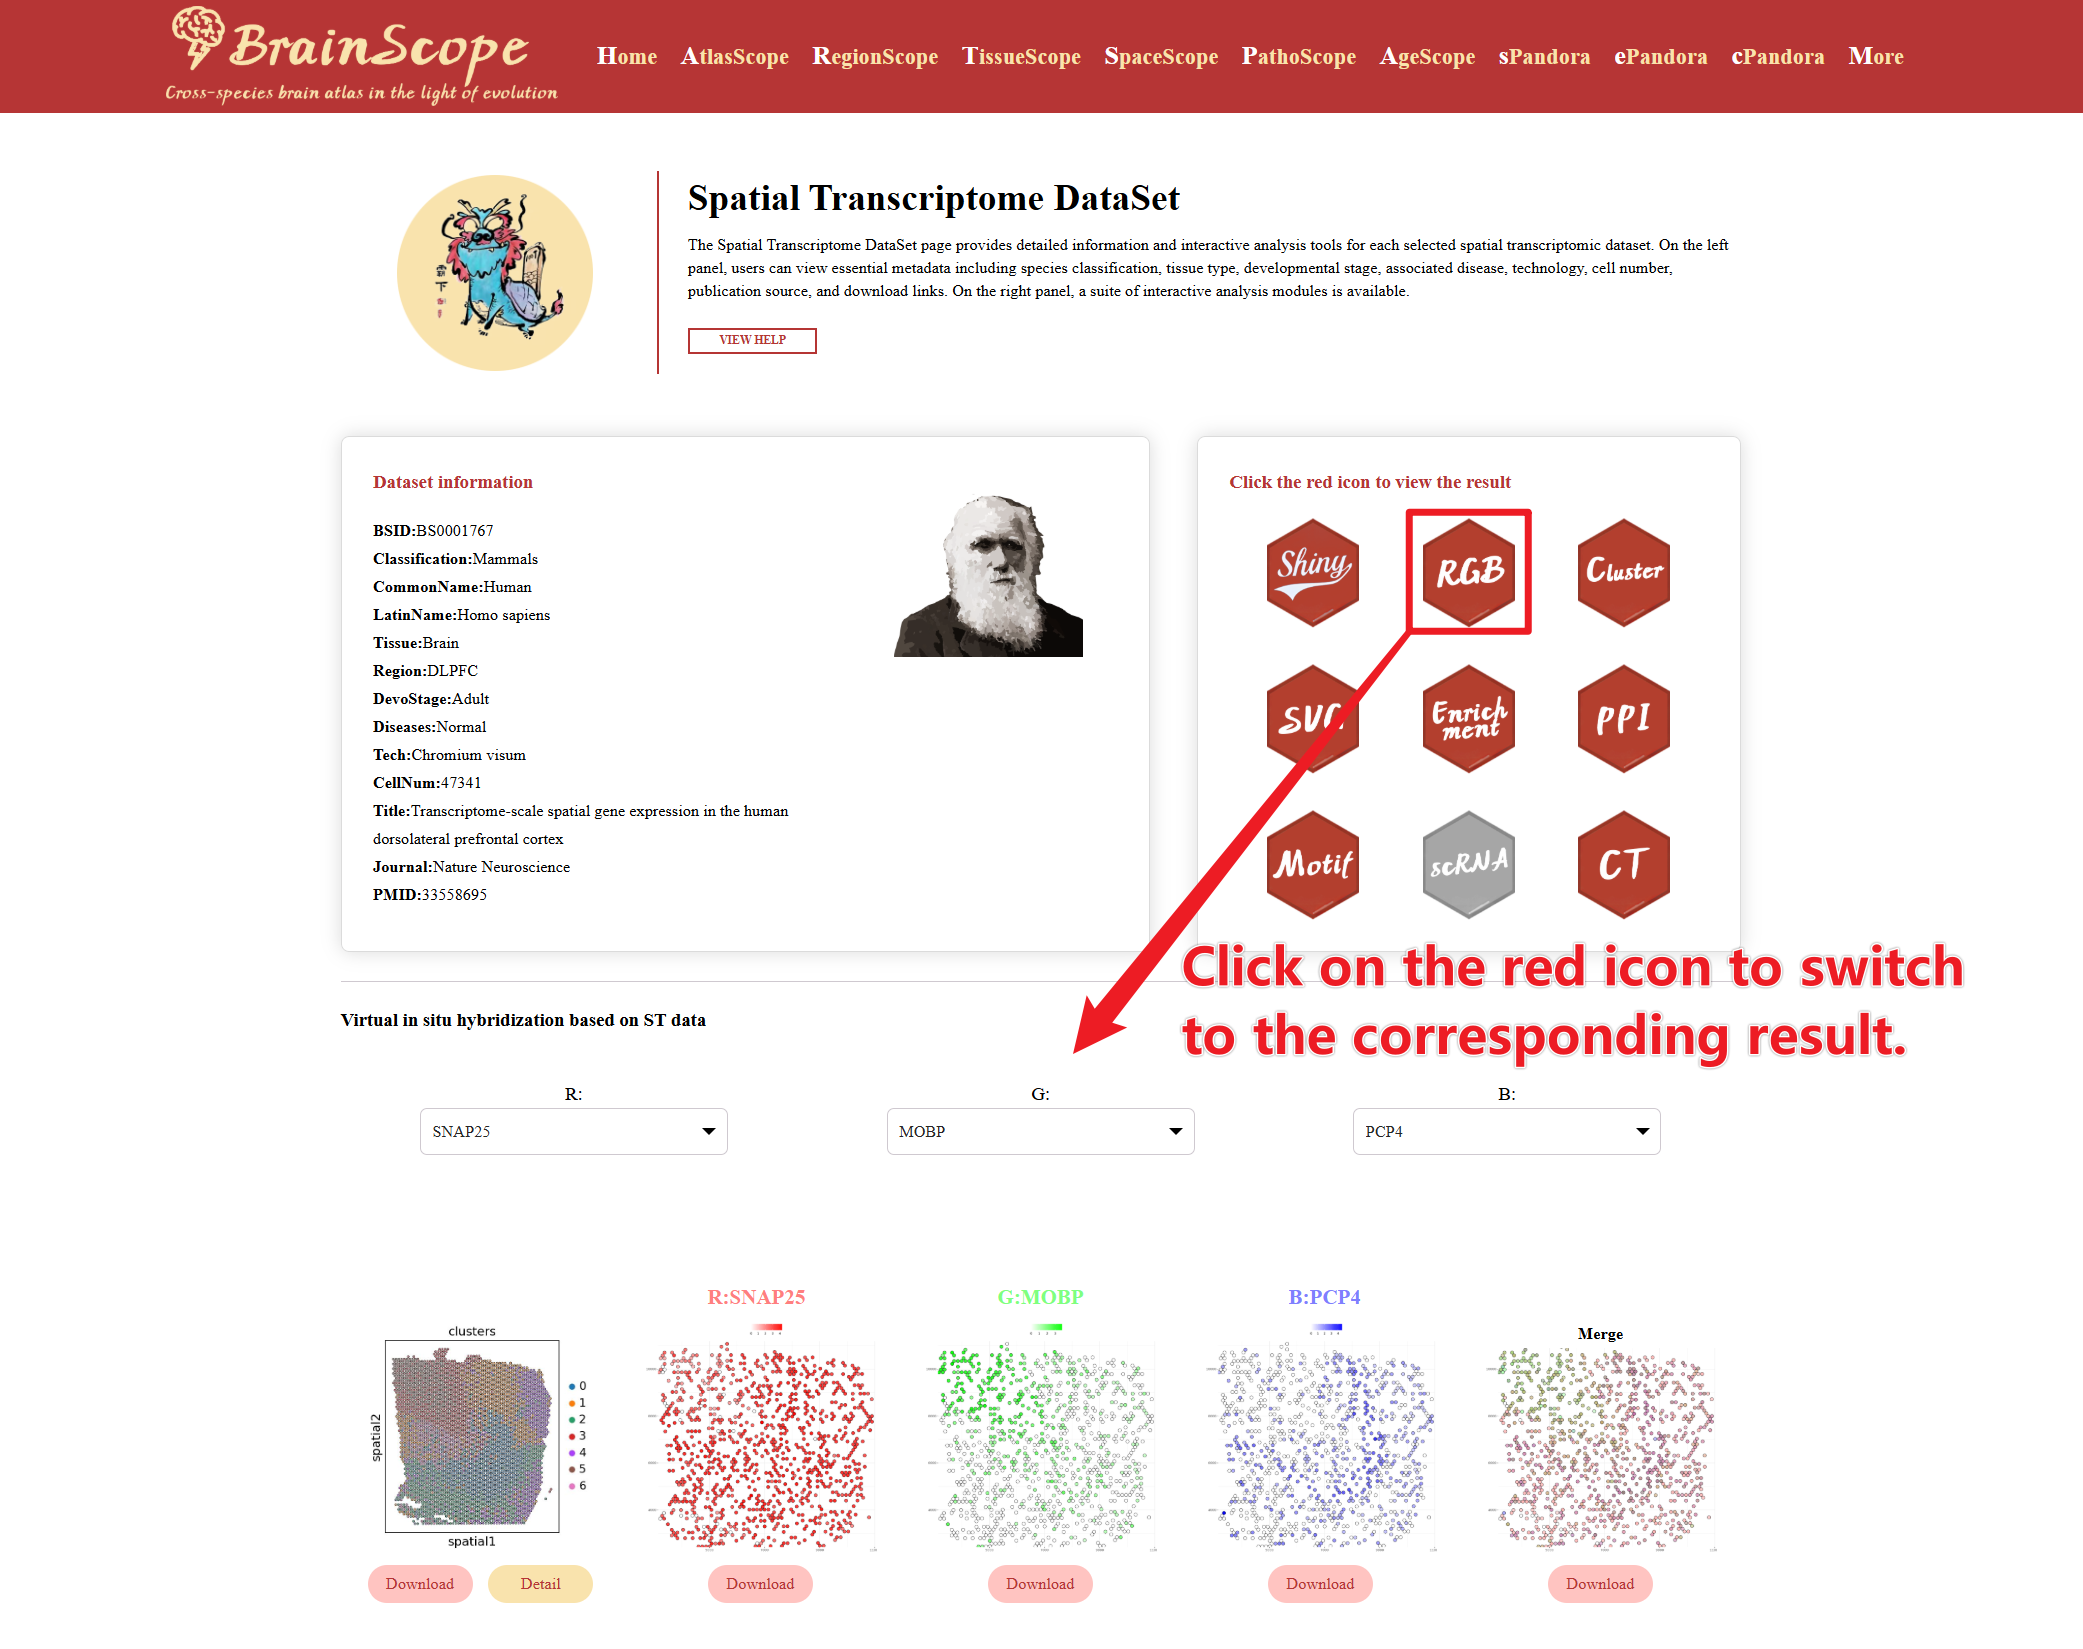
Hexagonal Buttons (“Select” Column)
Each dataset provides multiple spatial analysis options, represented by hexagonal buttons. The legend of these bottons are above the information table. Red buttons indicate that the analysis is available for that datase. Gray buttons indicate that the dataset does not support the corresponding analysis. Click on an available button to generate the respective analysis results.
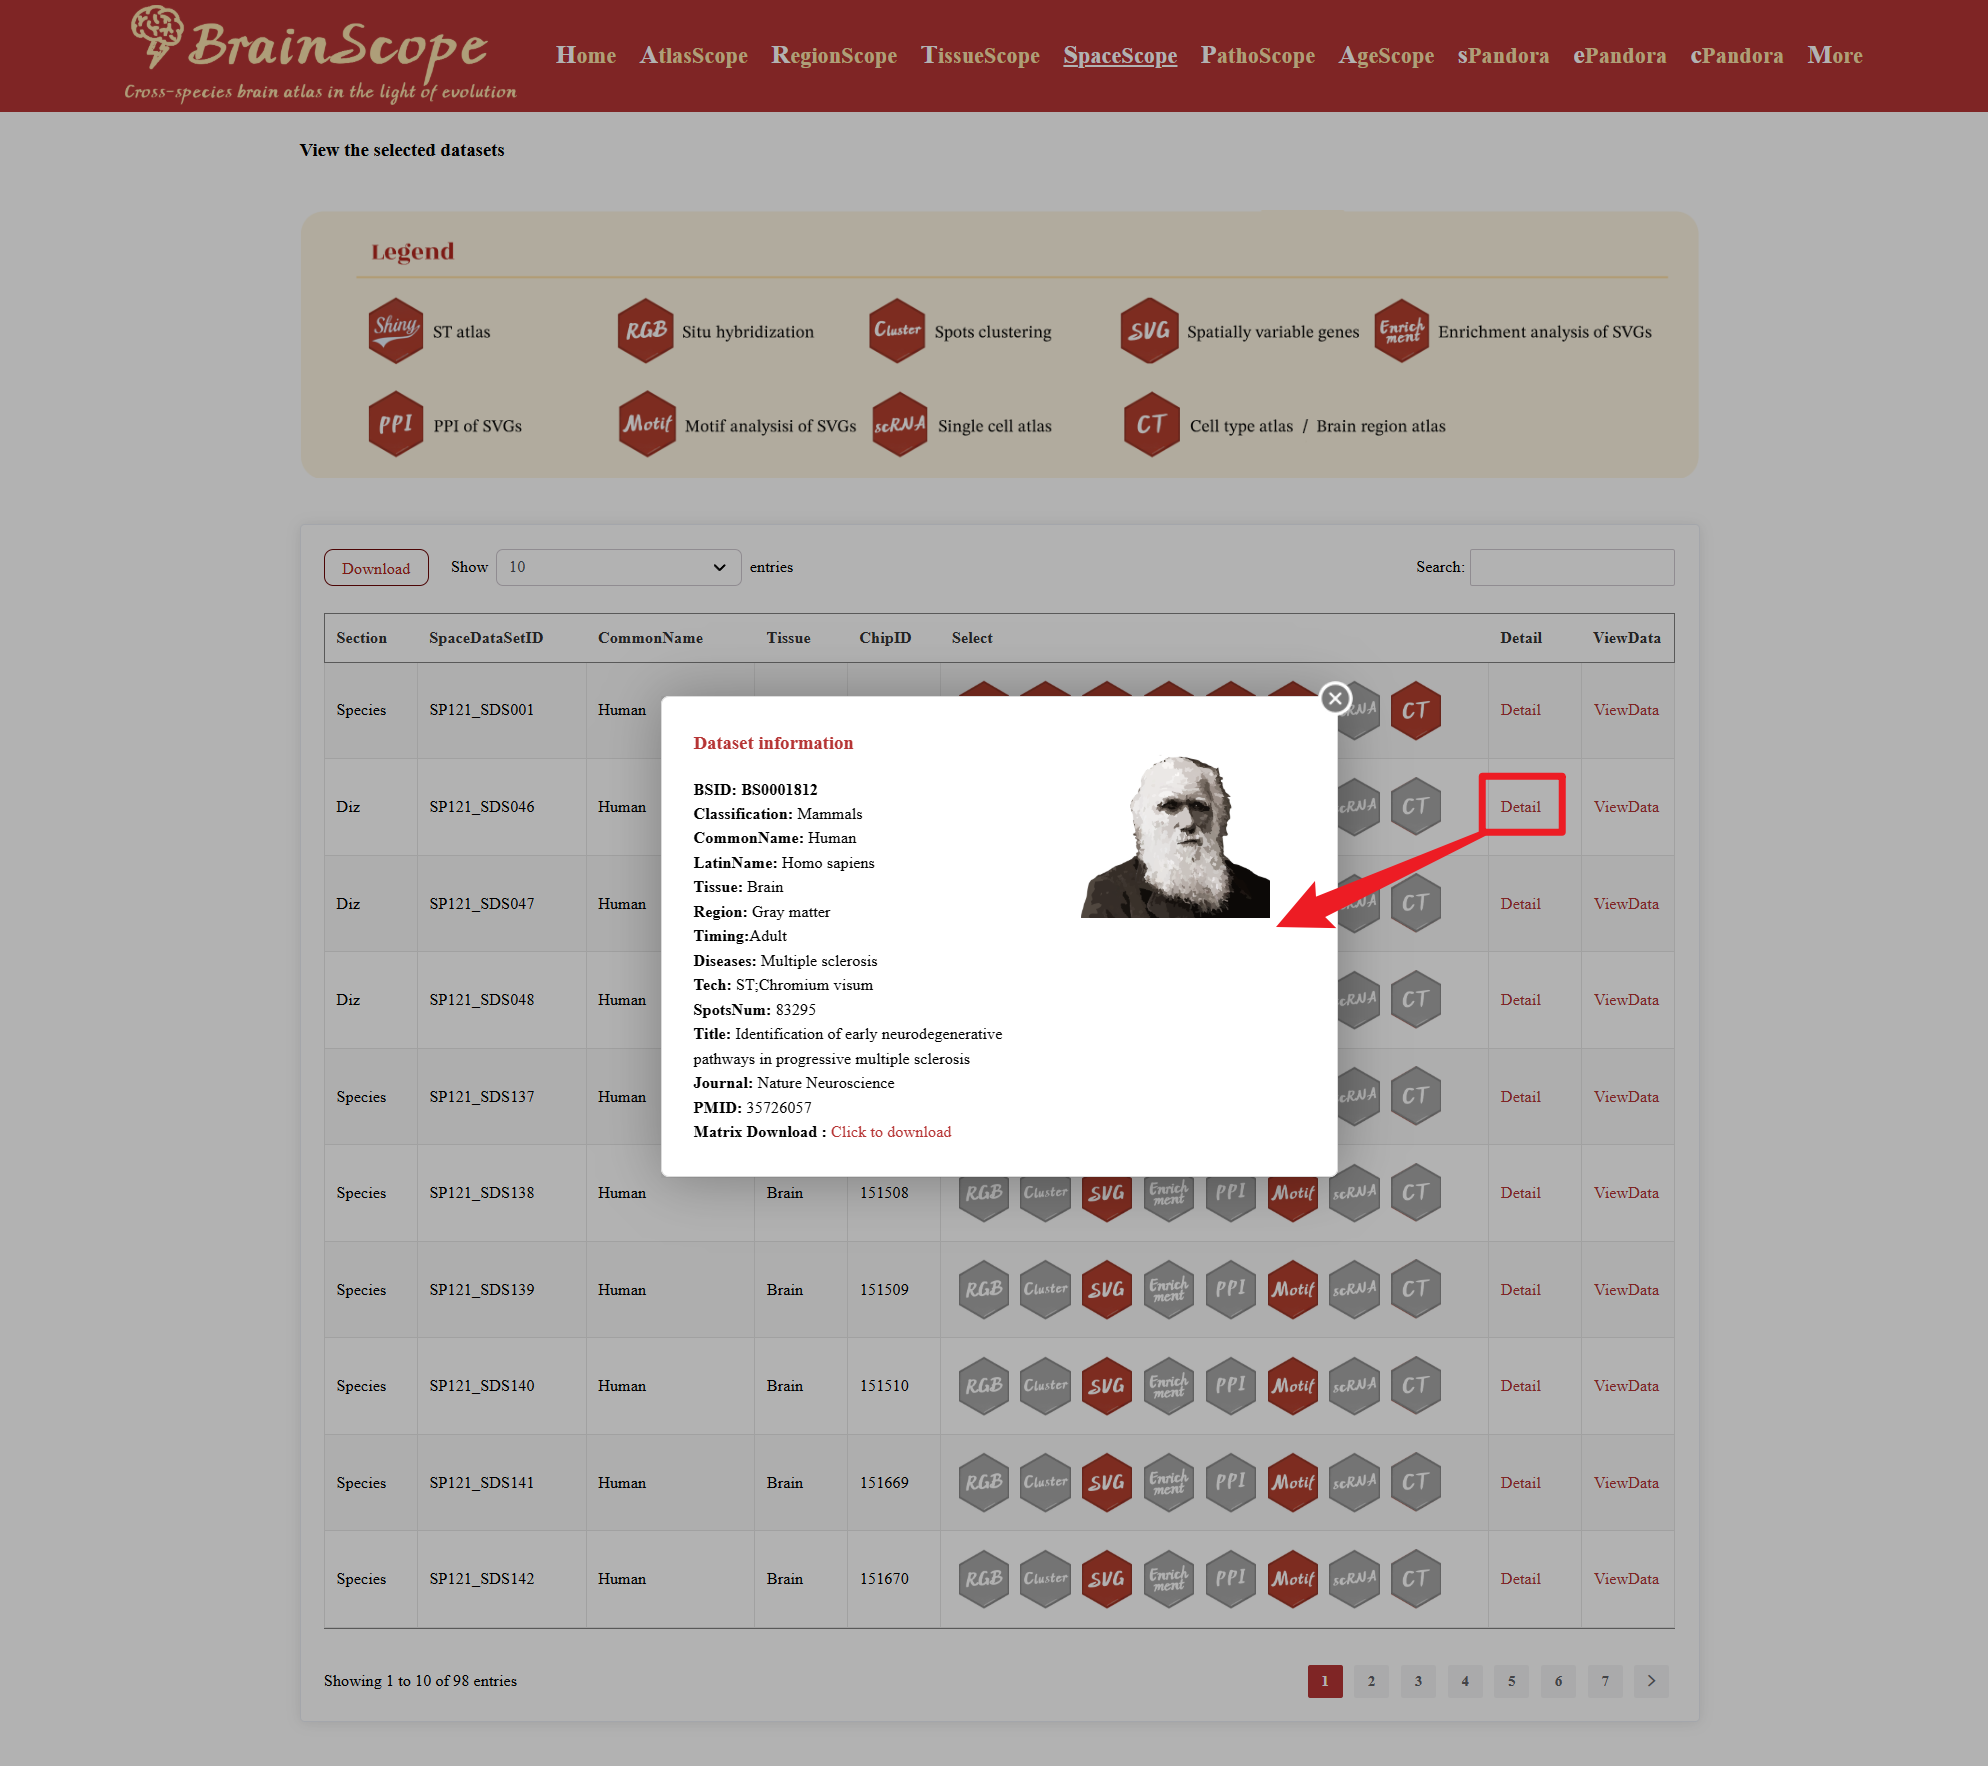
Clicking the “Detail” button will open a Dataset Information window.
Clicking “ViewData” leads to the dataset visualization page, where users can explore.
sPandora
The sPandora module enables users to explore the expression of a specific gene across various spatial transcriptomics datasets.
Enter or select a gene name in the search box (e.g., ADNP)
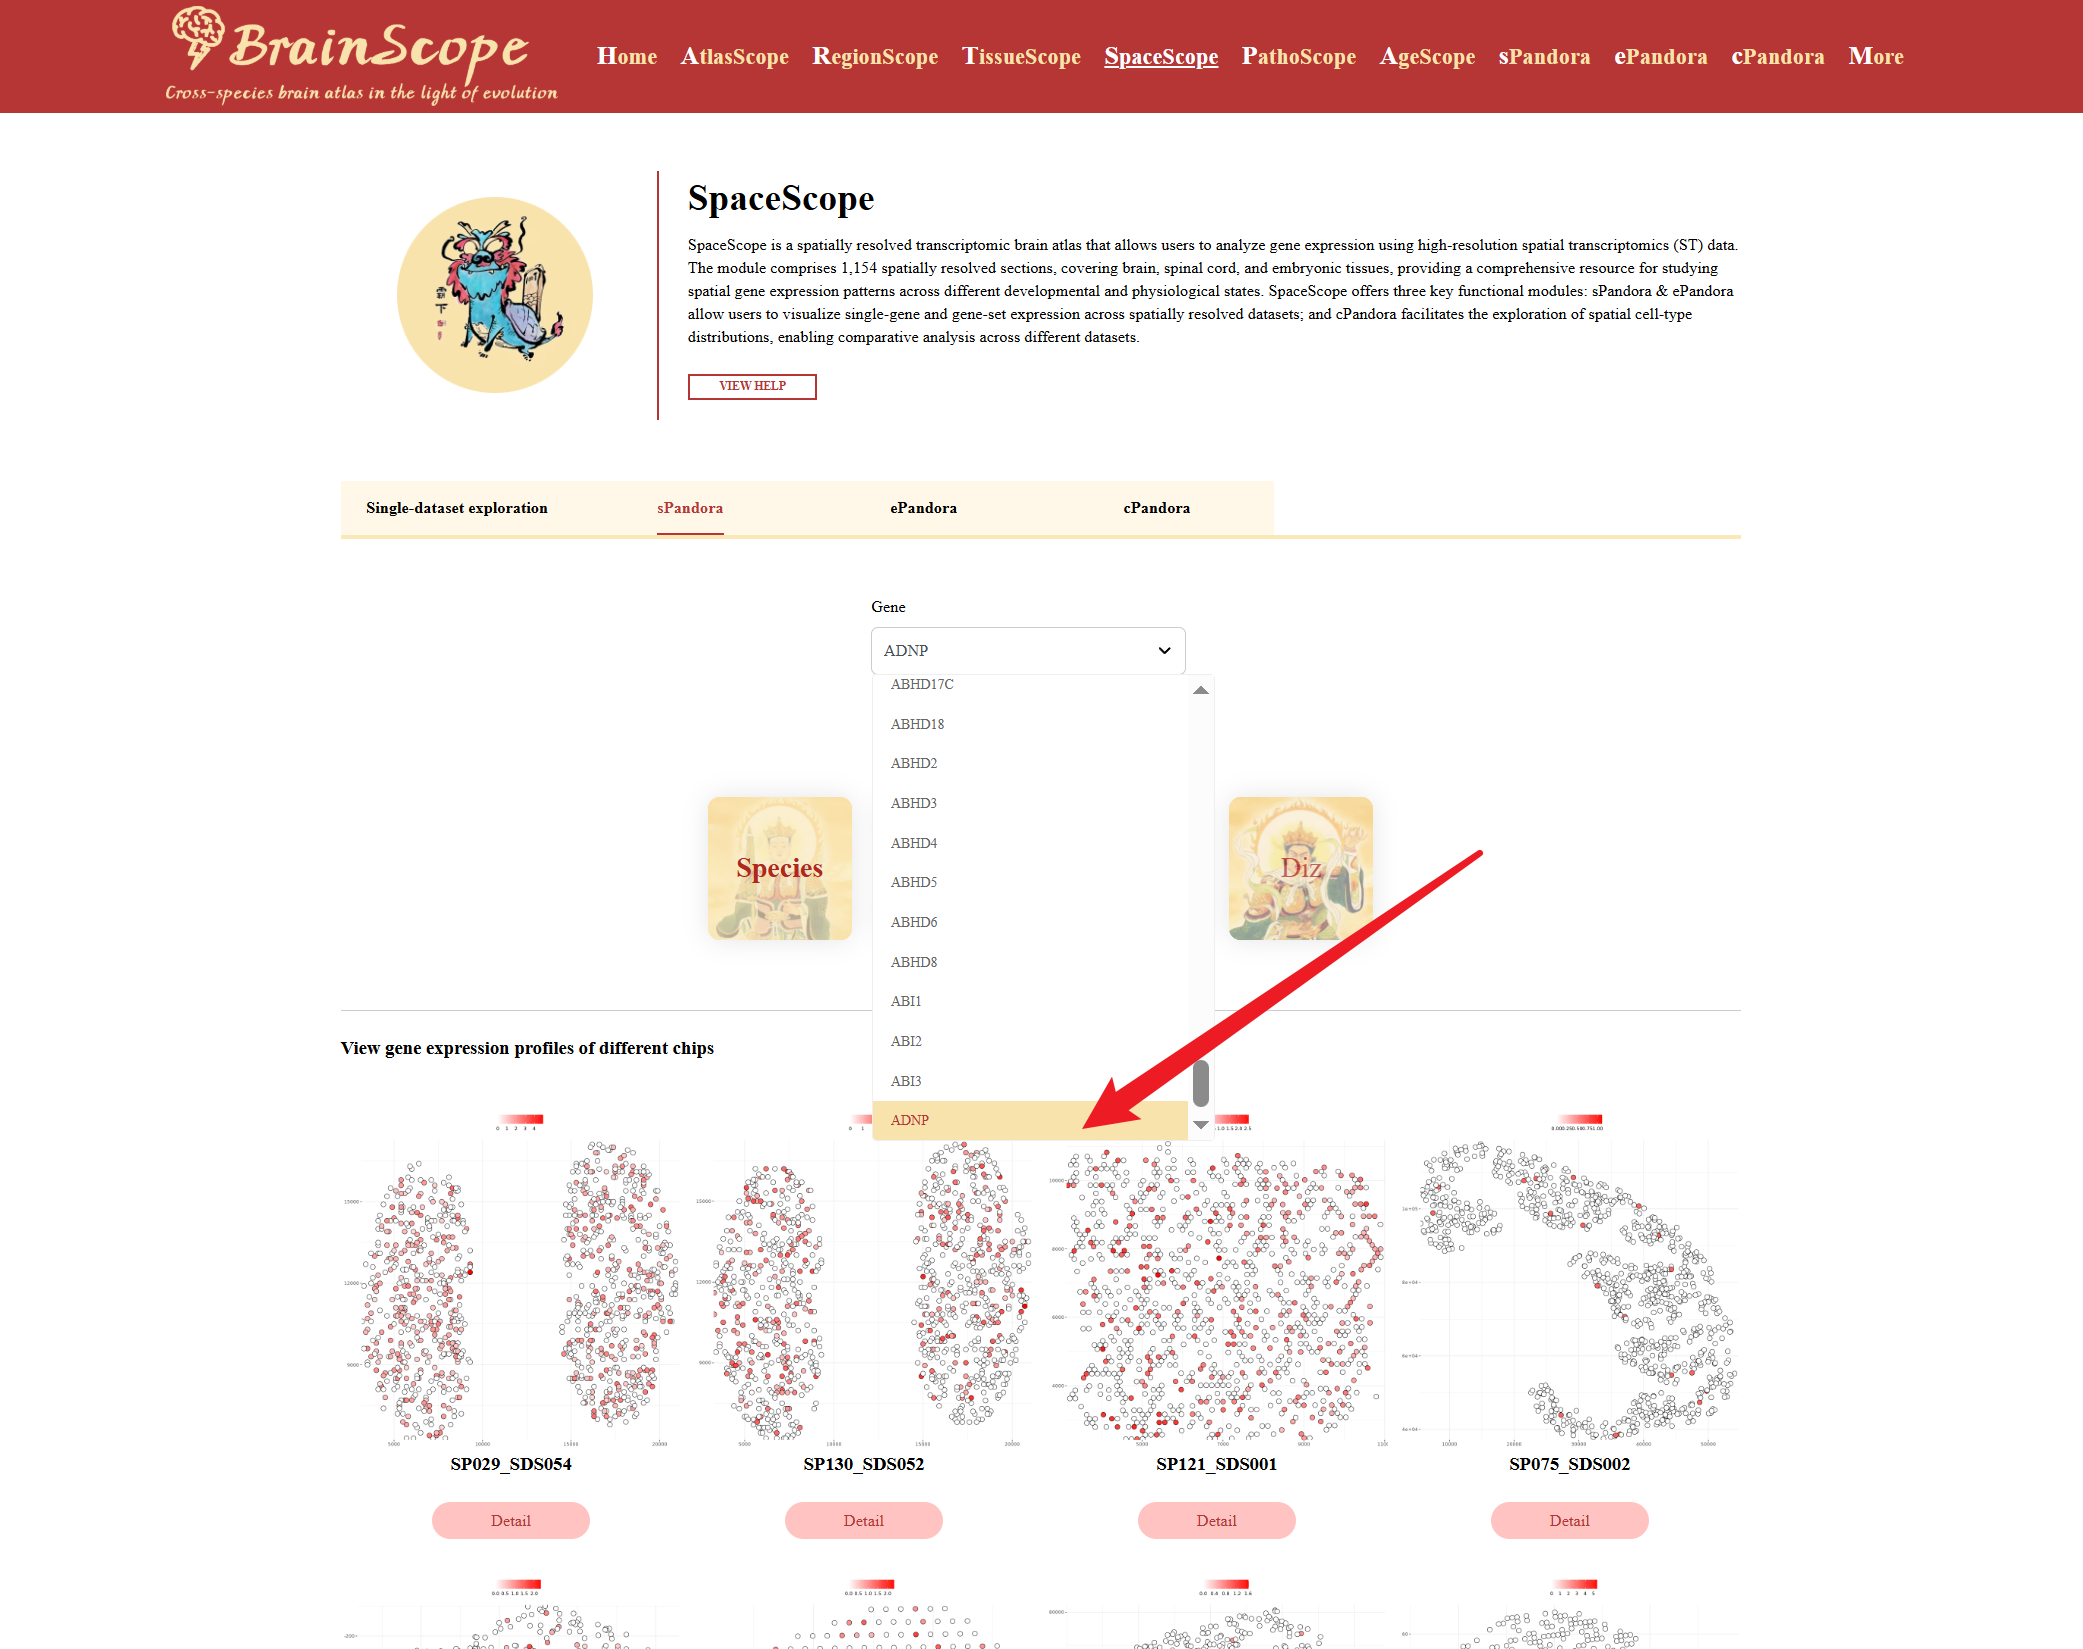
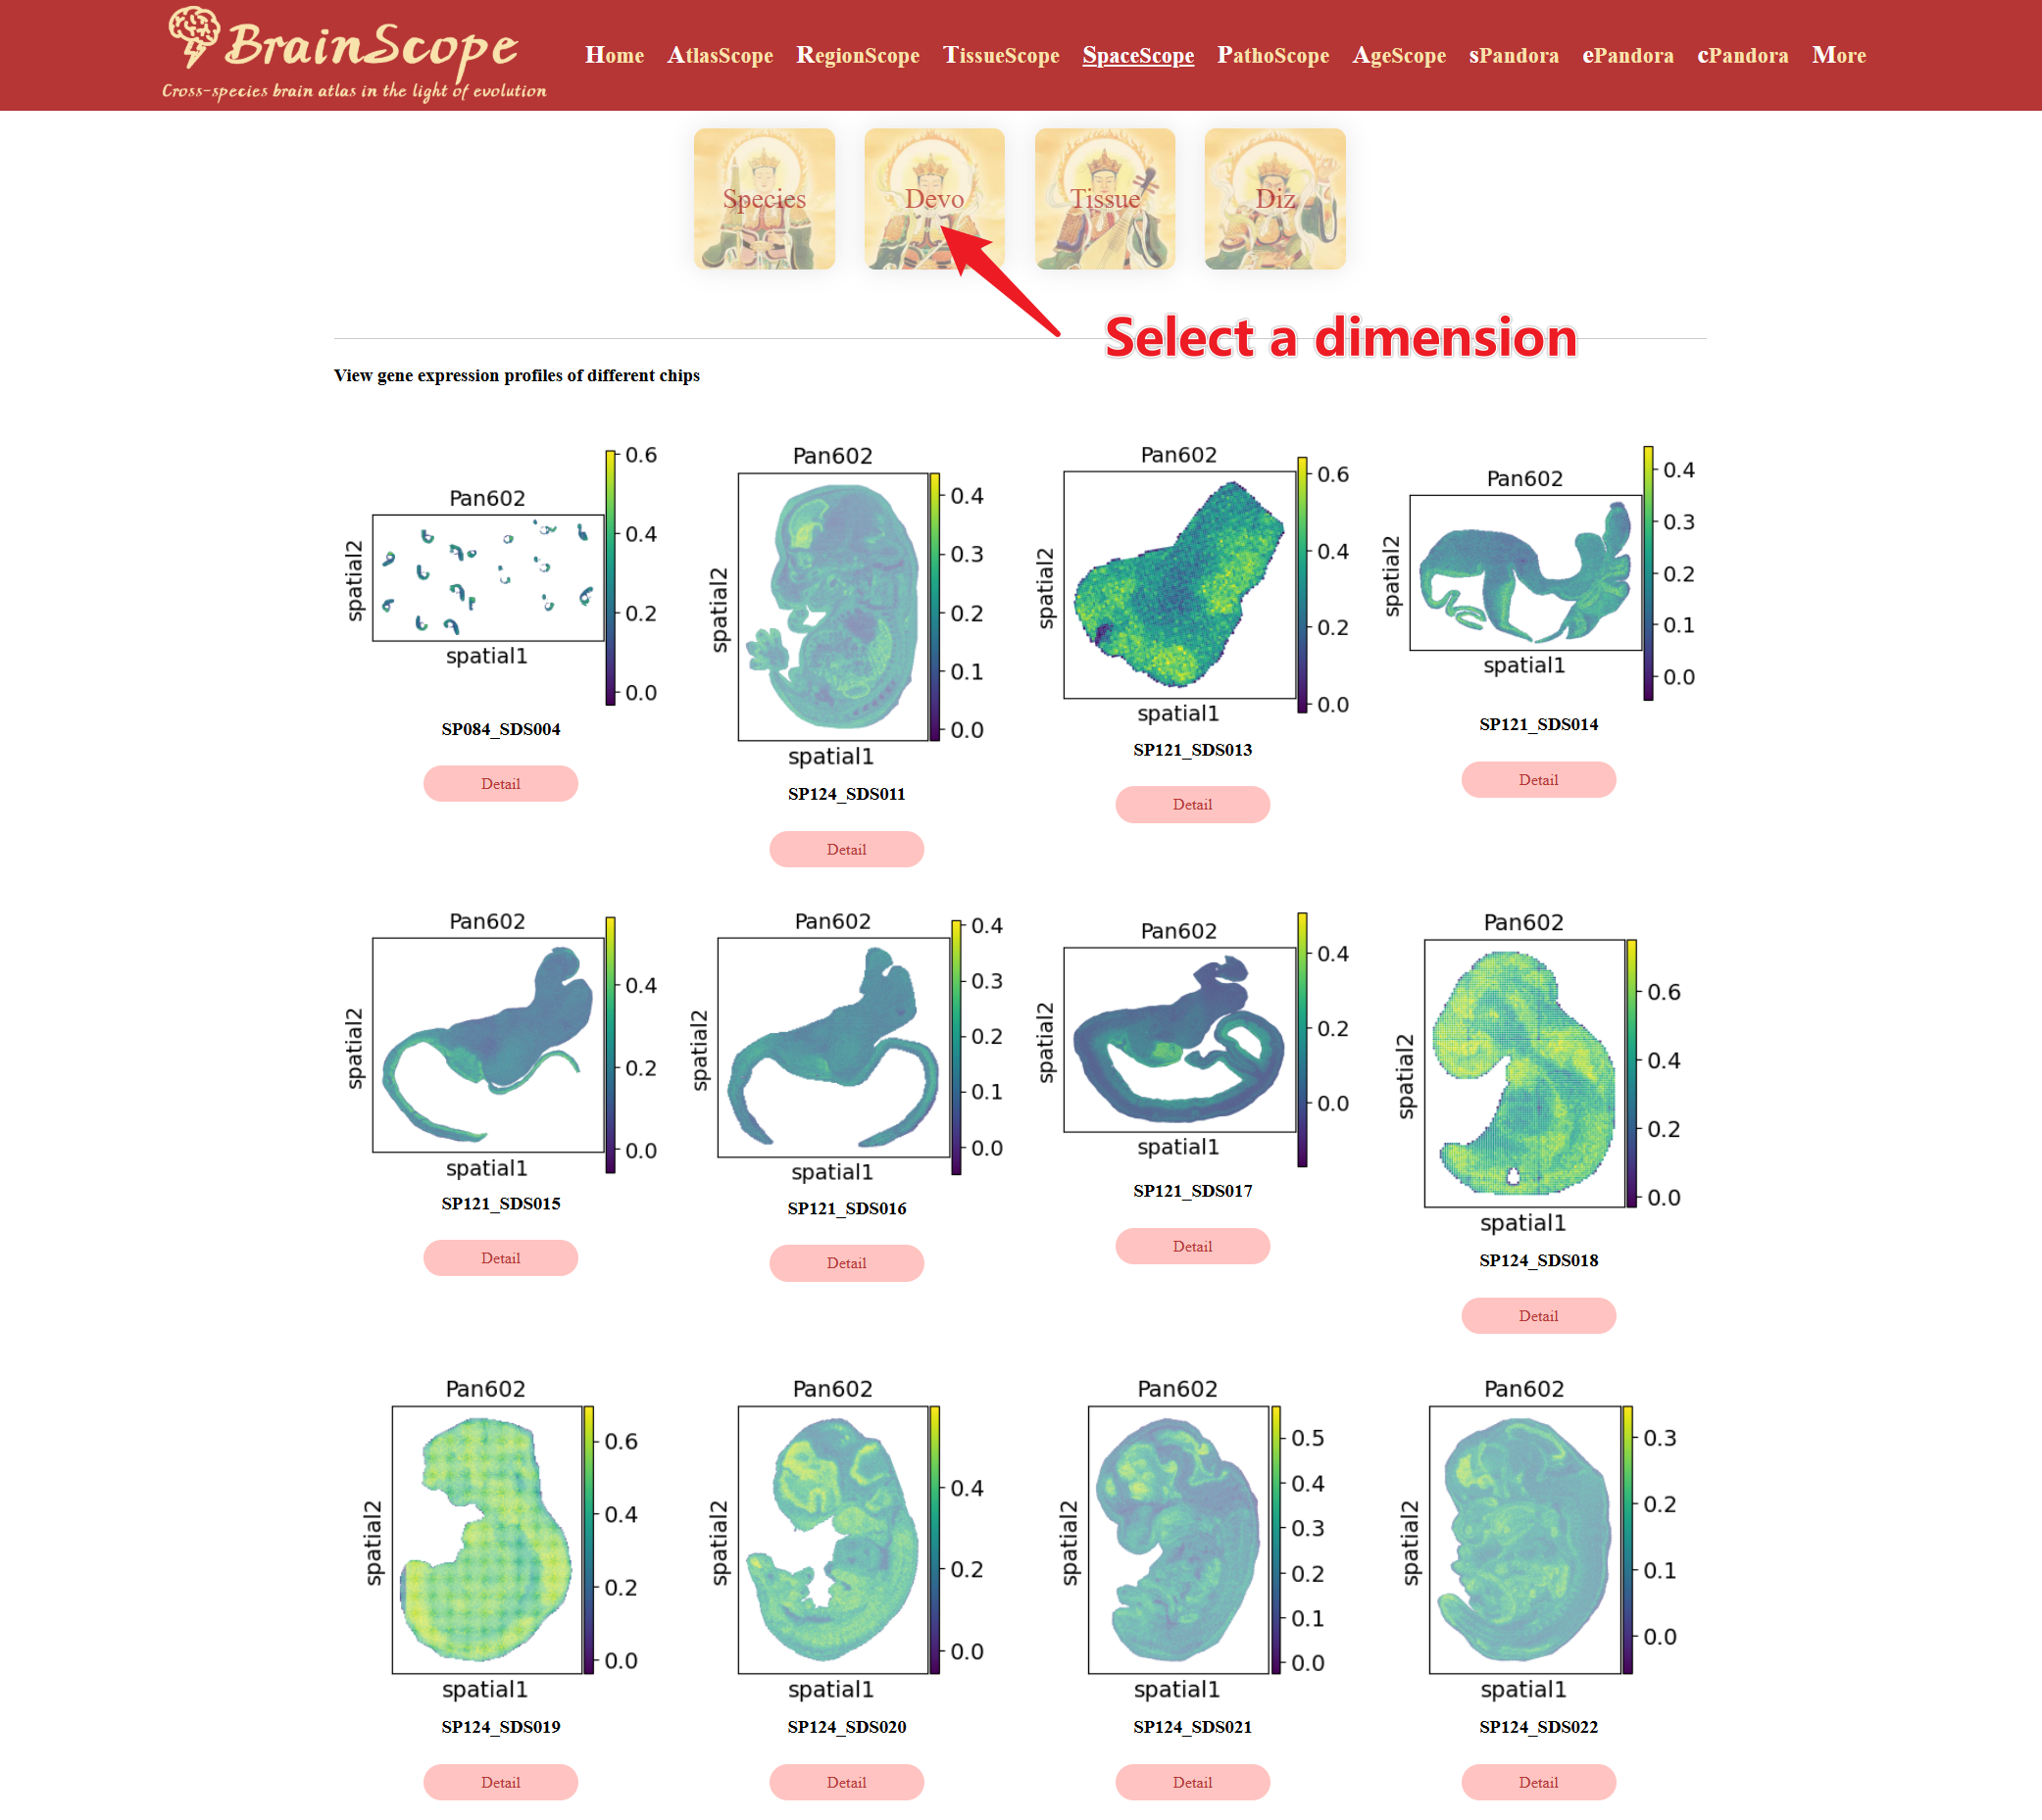
Select the Data Dimension for Analysis. Users can choose from 4 dimensions (Species, Devo, Tissue, Diz)
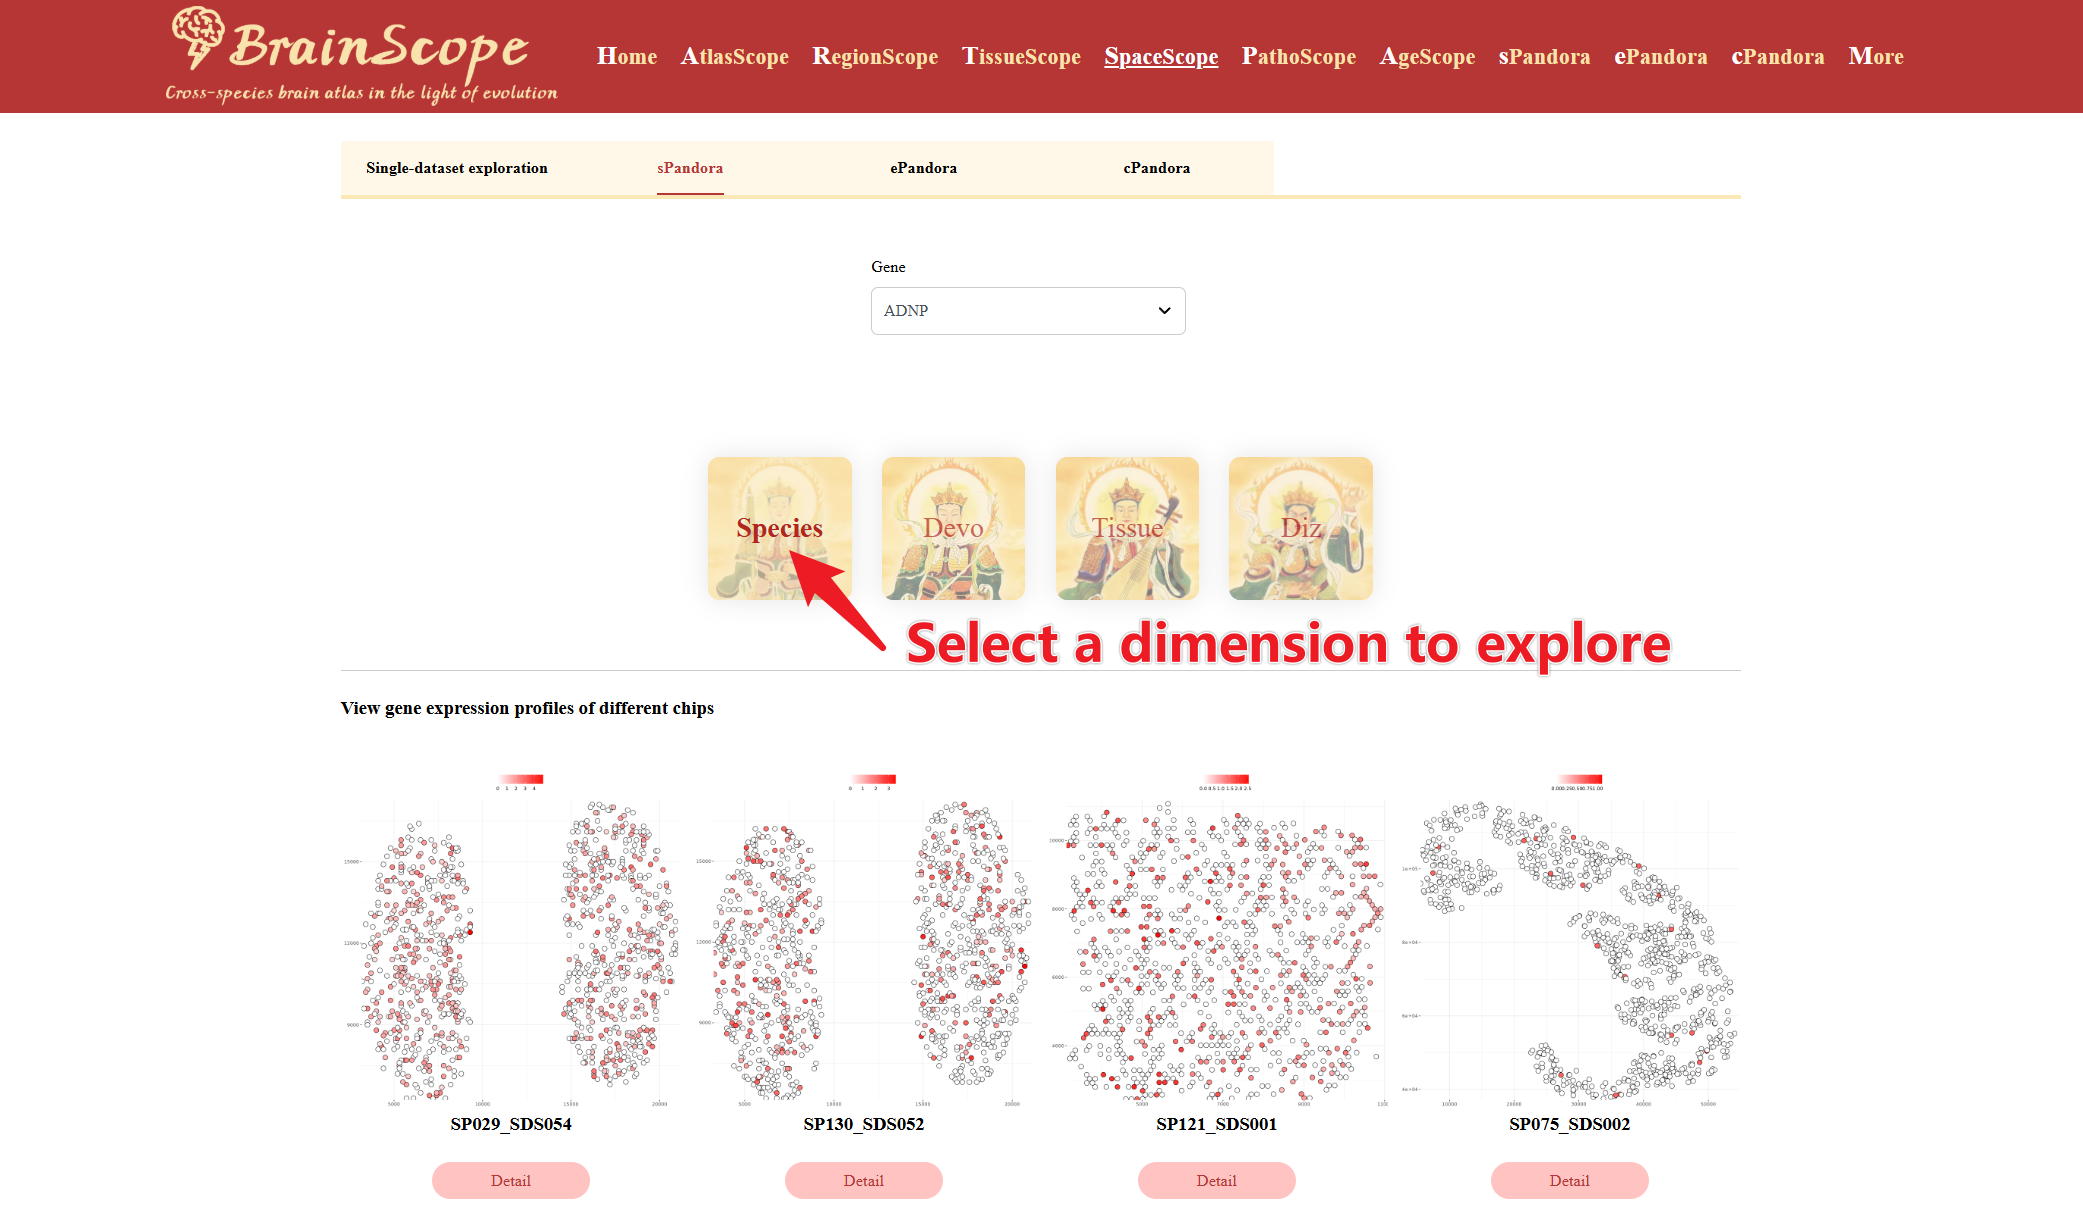
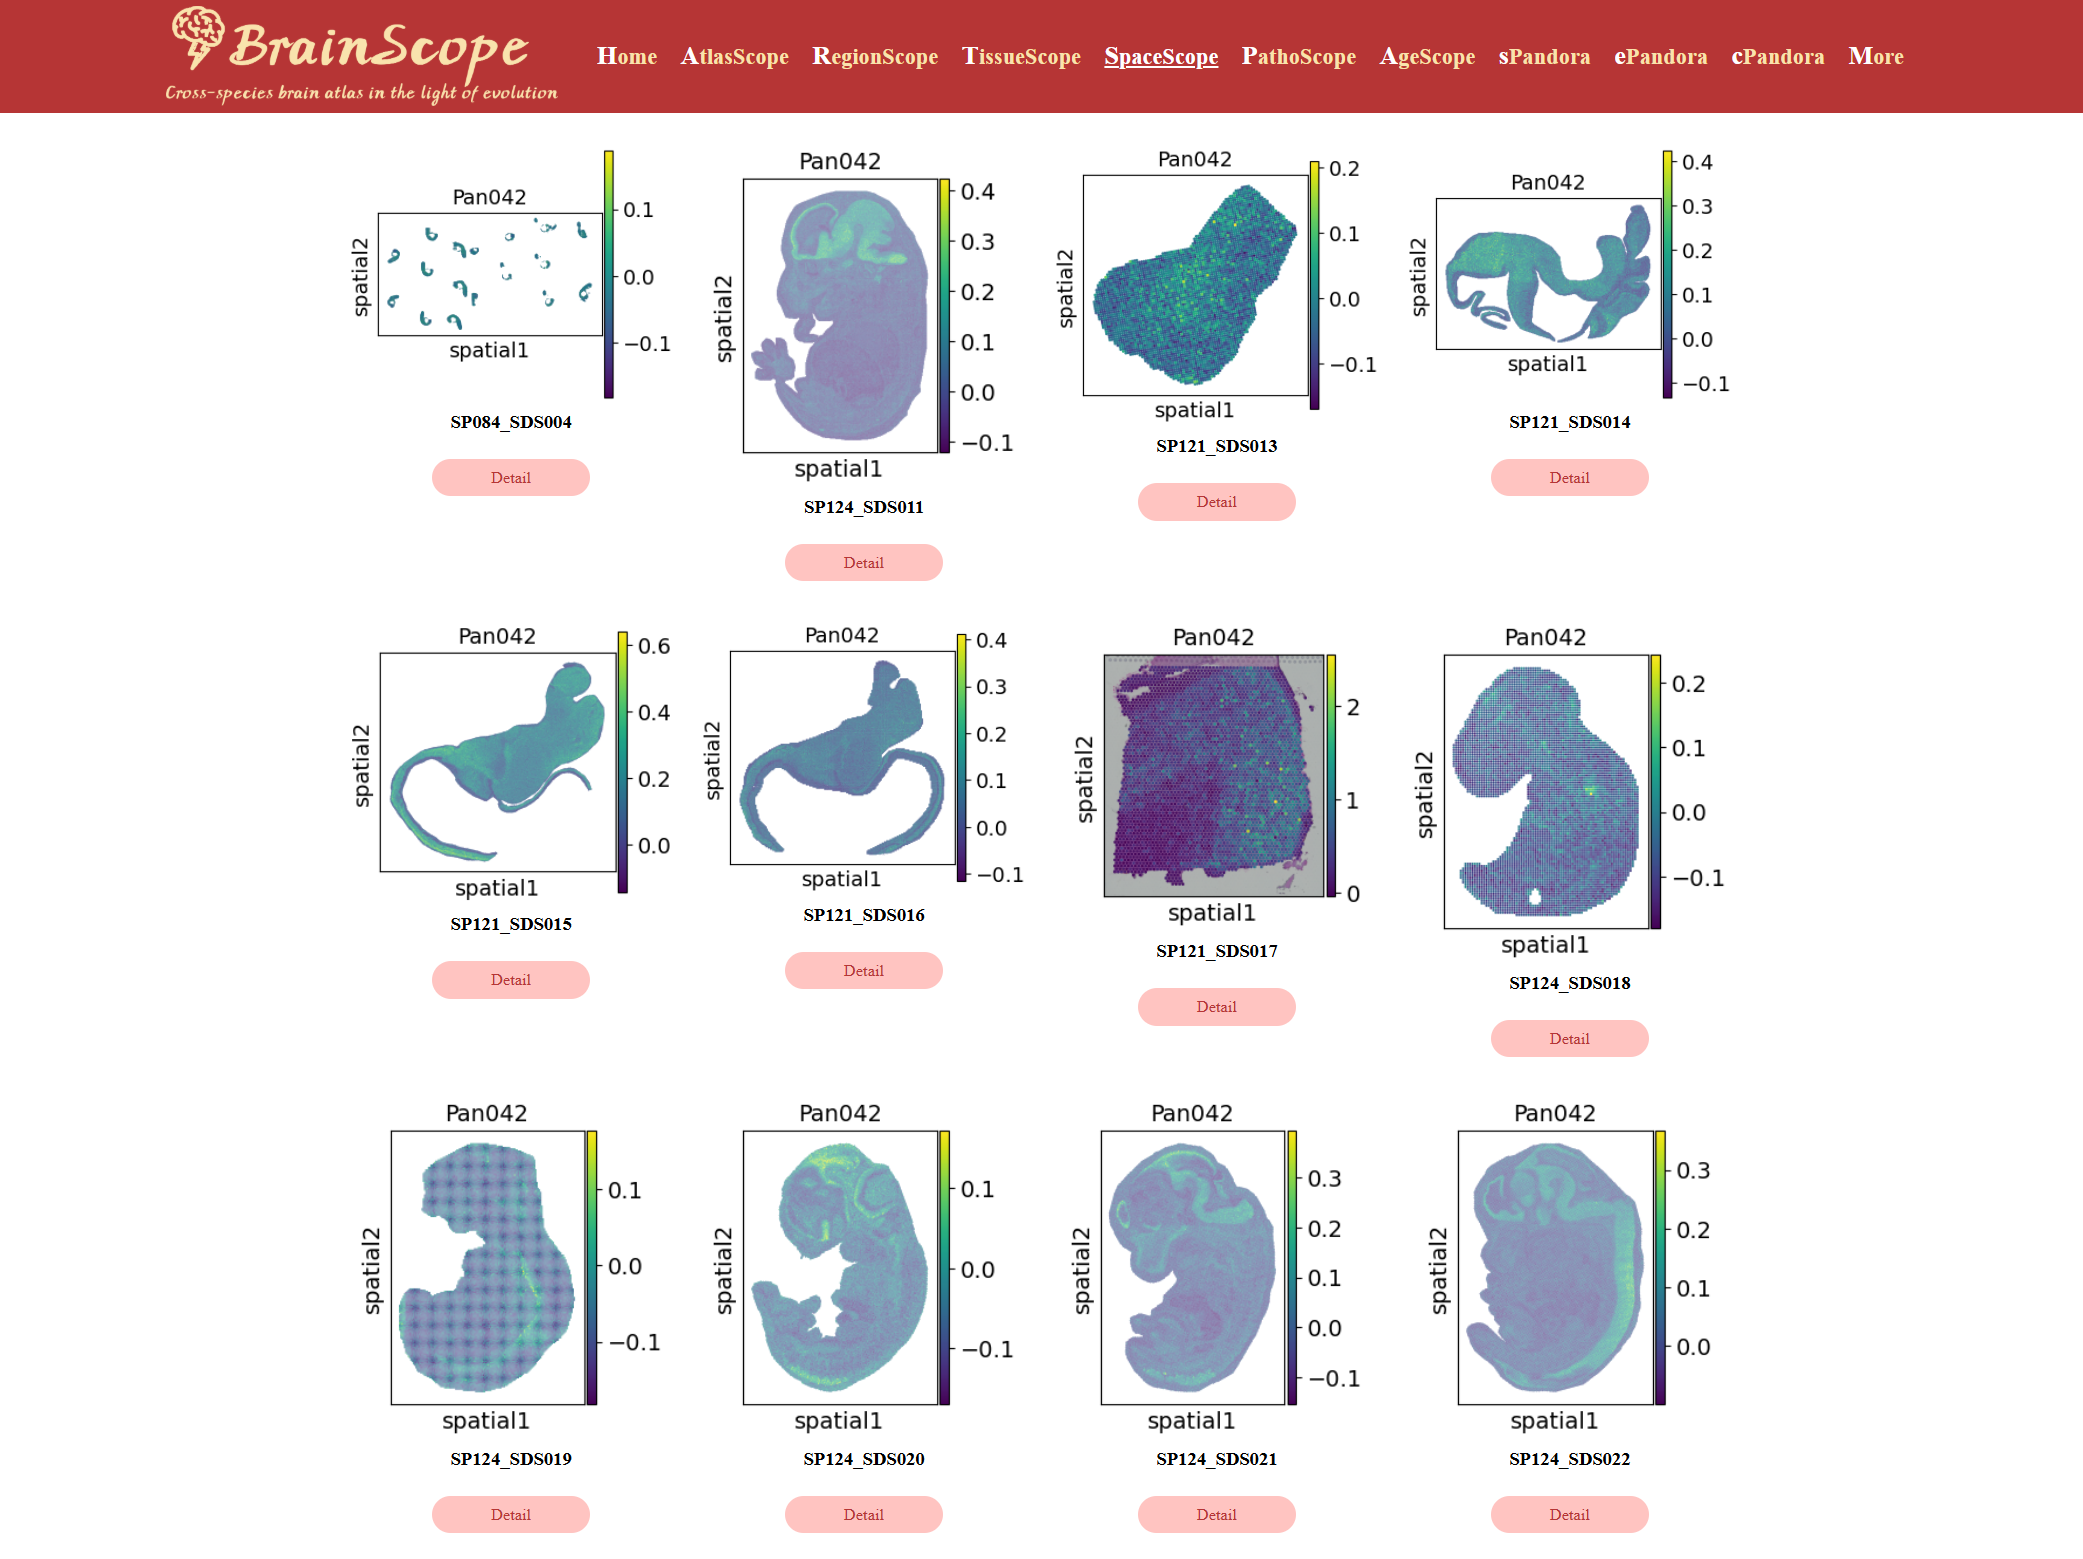
Once the gene and dimension are selected, plots display the expression levels of the gene across different chips, visualizing the gene’s localization and intensity in tissue sections.
ePandora
The ePandora module allows users to analyze the spatial expression of entire gene sets across multiple datasets.
Select a Gene Set Category. Check a Specific Gene List
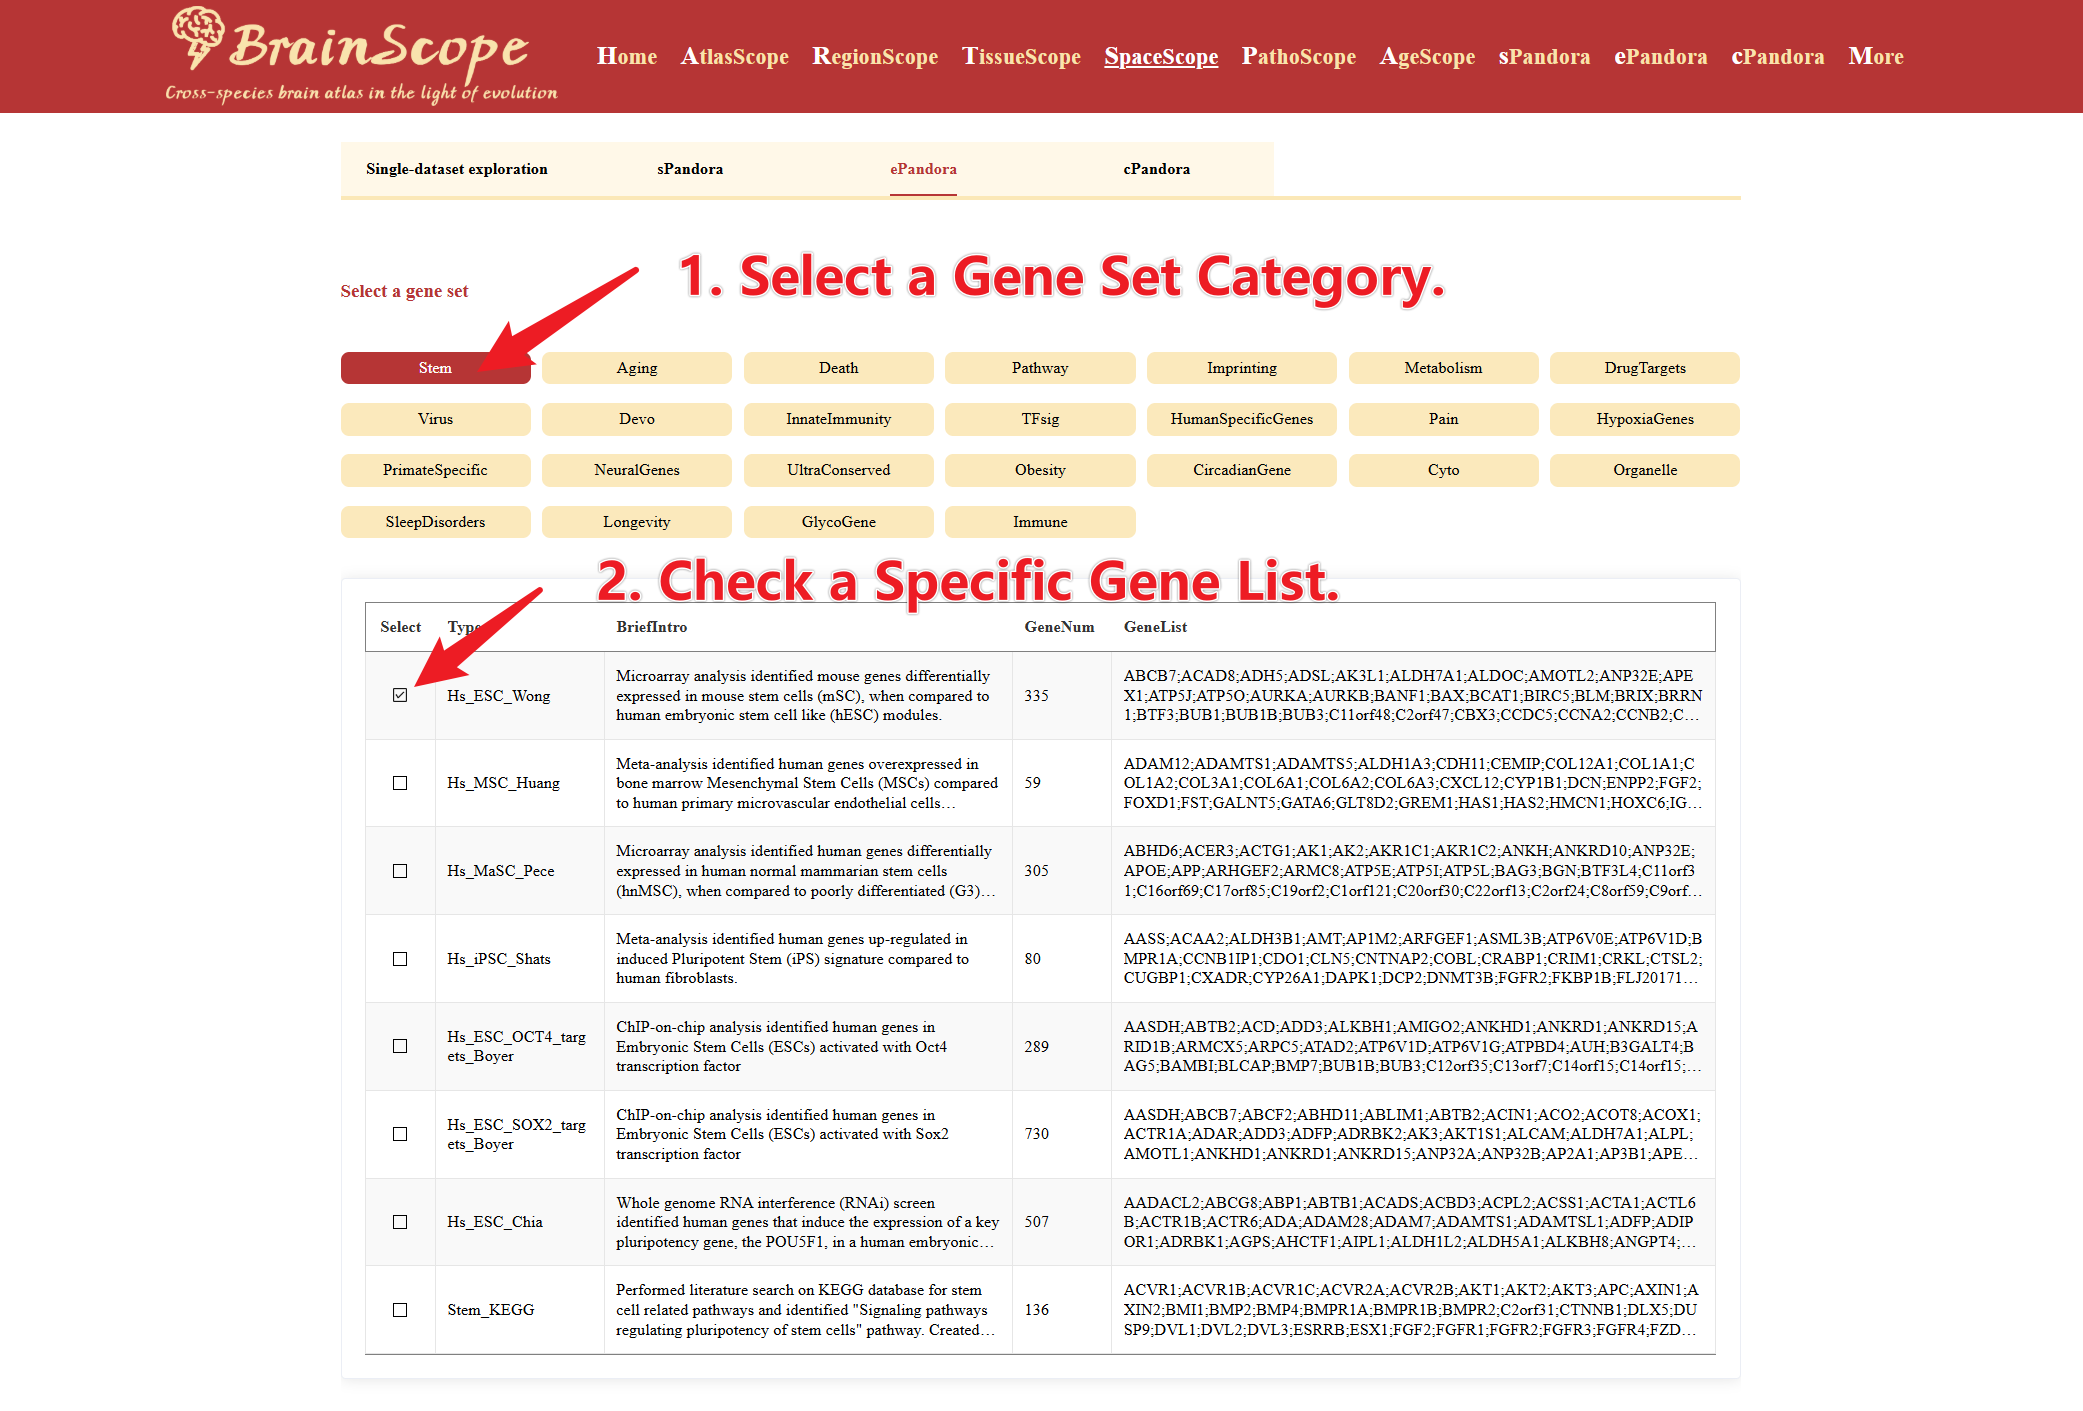
Choose the Data Dimension for analysis. These visualizations illustrate where genes in the list are highly expressed across tissue sections.
cPandora
cPandora allows users to explore the spatial distribution of specific cell types in spatial transcriptomics datasets.
Select a cell type for analysis. Select the data dimension for analysis.
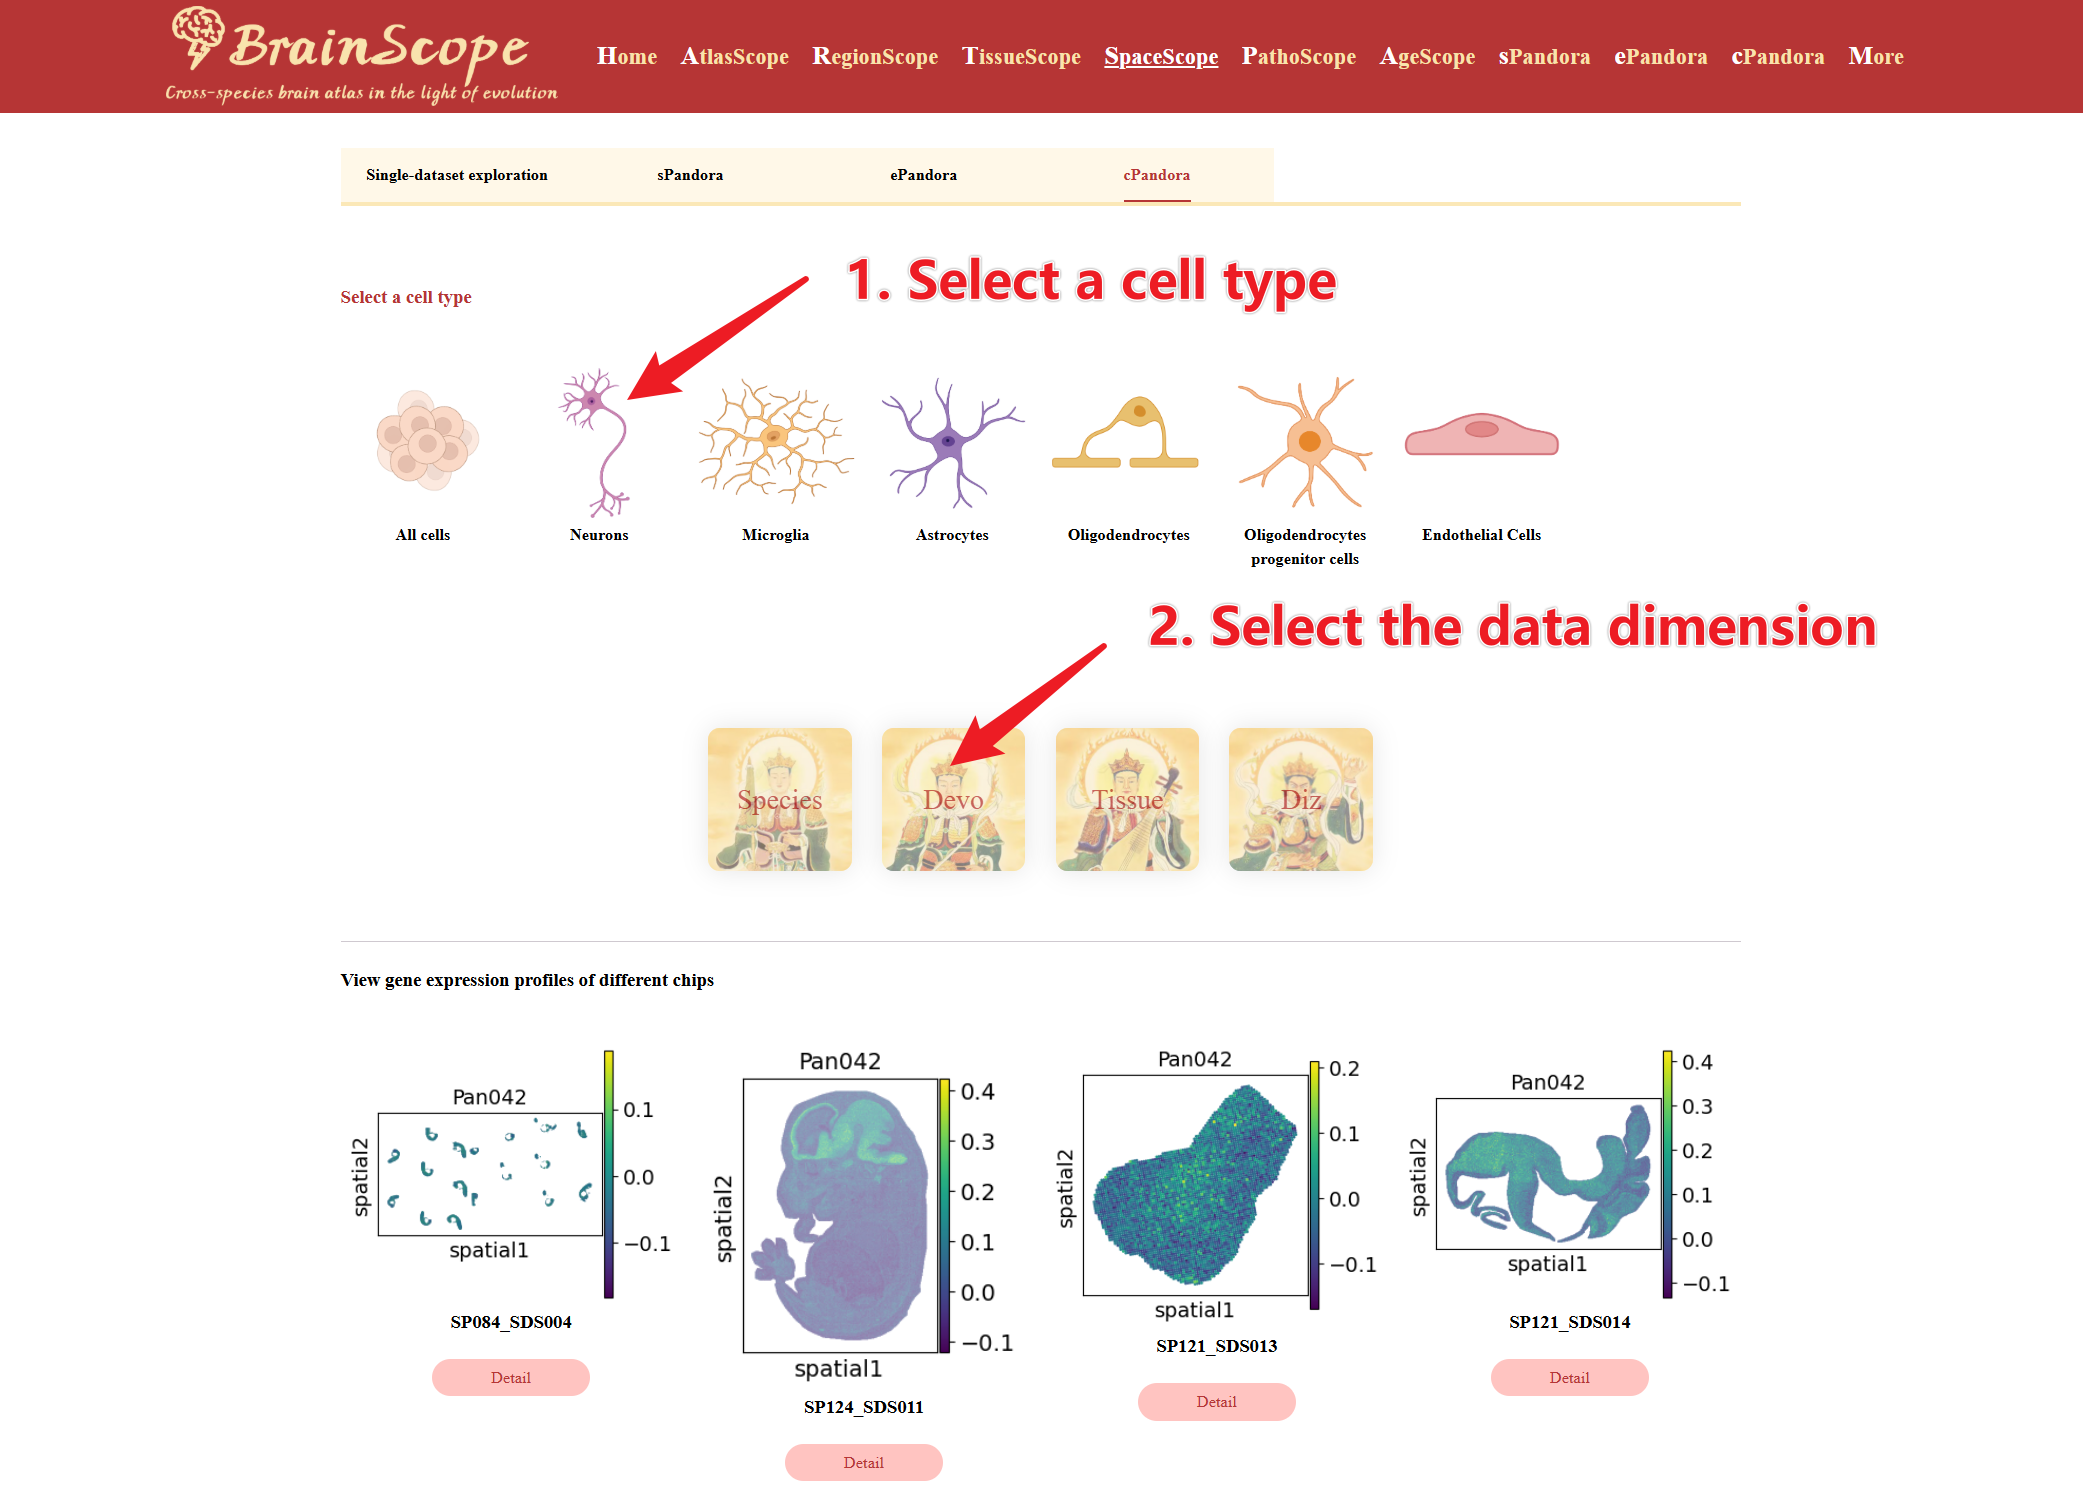
A spatial map will be generated showing locations of the selected cell type across the chosen dataset. Plots display the cell type's location across different chips.