TissueScope is a cross-species bulk RNA-seq brain atlas designed for large-scale transcriptomic comparisons across species and tissues, allowing users to explore evolutionary gene expression patterns and tissue-specific transcriptomics. It concludes 290 species spanning 109 mammals, 20 birds, 11 reptiles, 6 amphibians and 144 fishes. TissueScope offers key functional modules: sPandora & ePandora, allowing single-gene and gene-set expression analysis; GeneLists, providing access to differentially expressed gene lists for specific tissues; and TimeTree, which visualizes phylogenetic relationships among species for evolutionary insights.
There are five main tabs: Single-dataset
exploration, sPandora, ePandora, GeneLists, TimeTree.
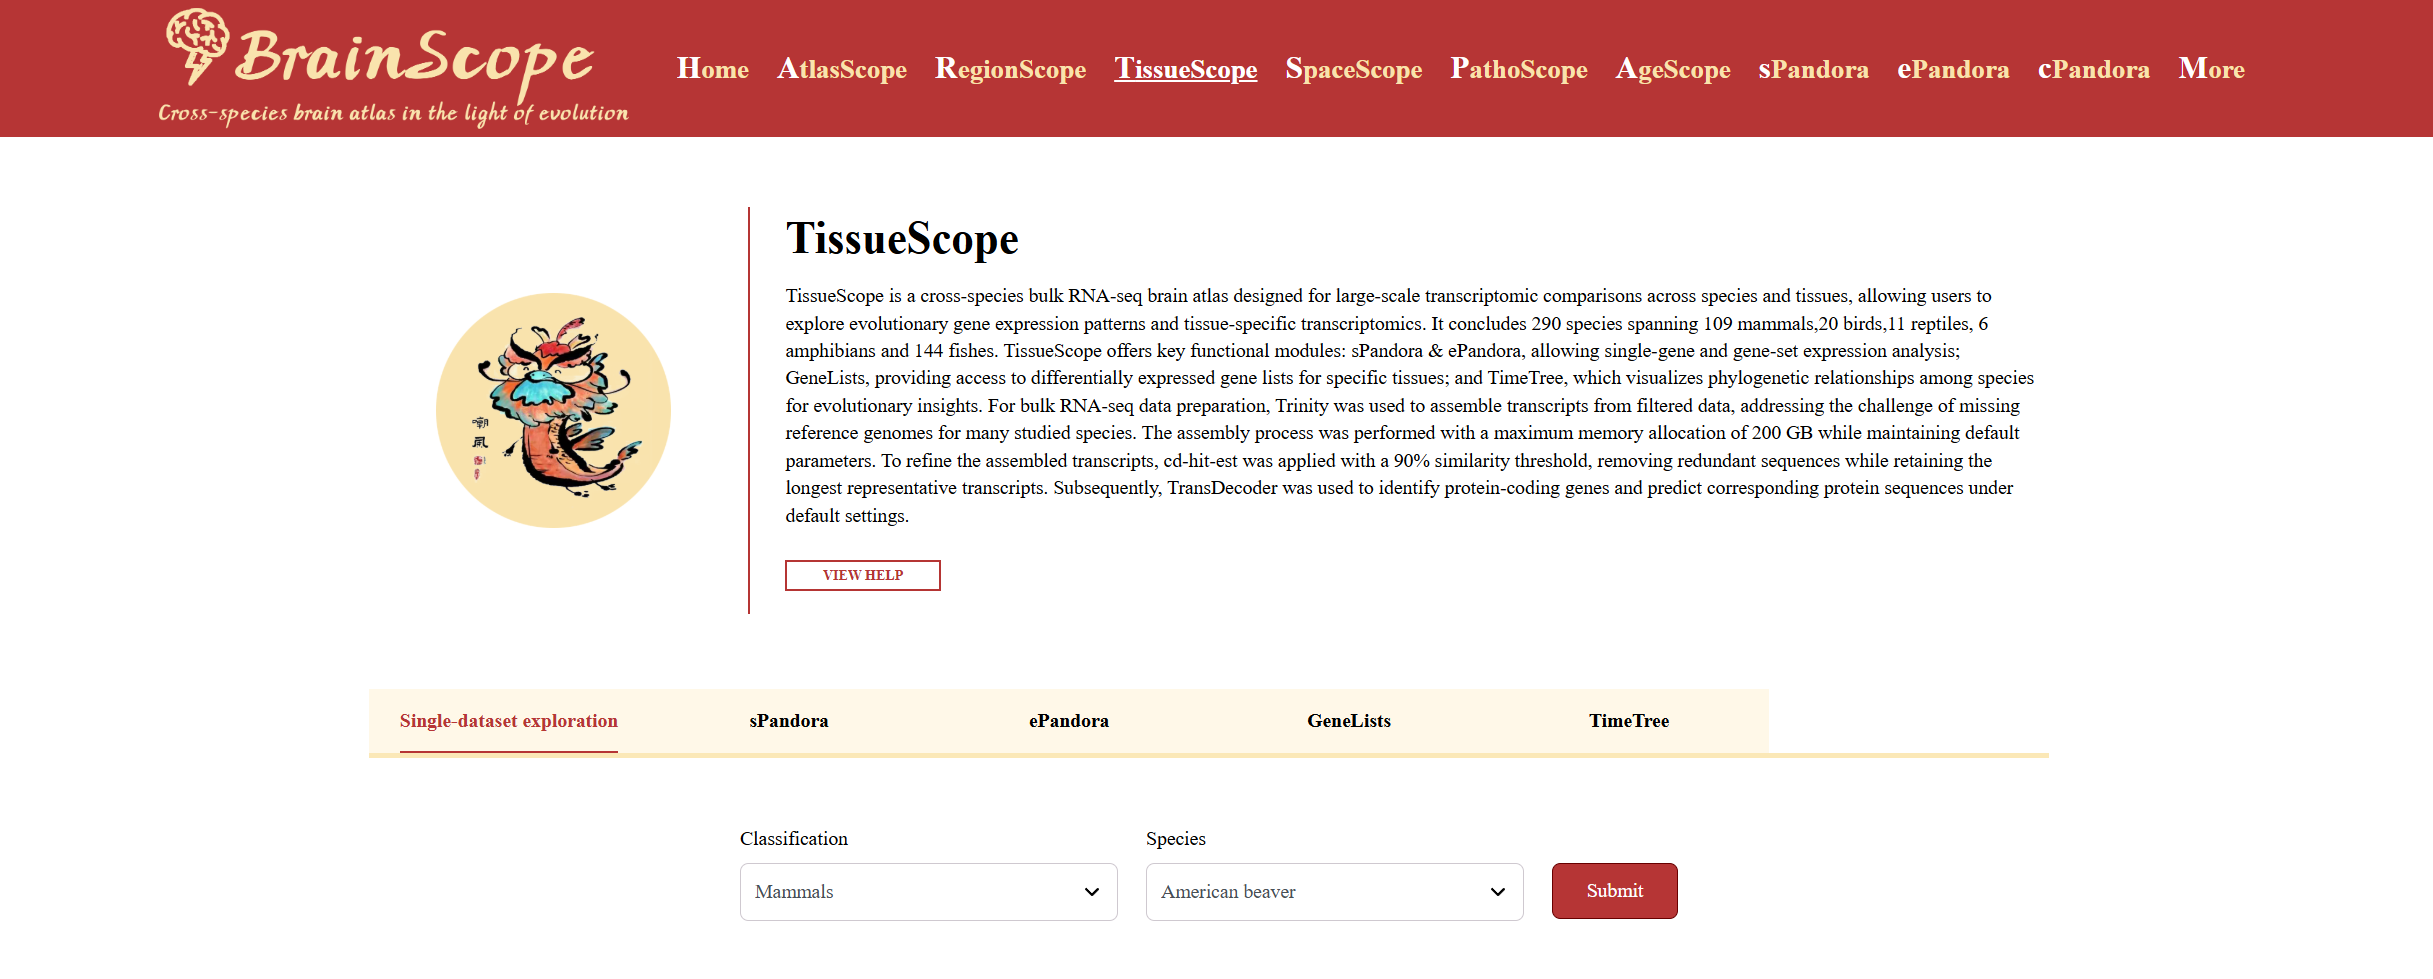
Single-dataset exploration
Users can explore brain bulk RNA-seq sequencing data for species of interest at Single-dataset exploration.
Users can explore the data of species of interest in two ways:
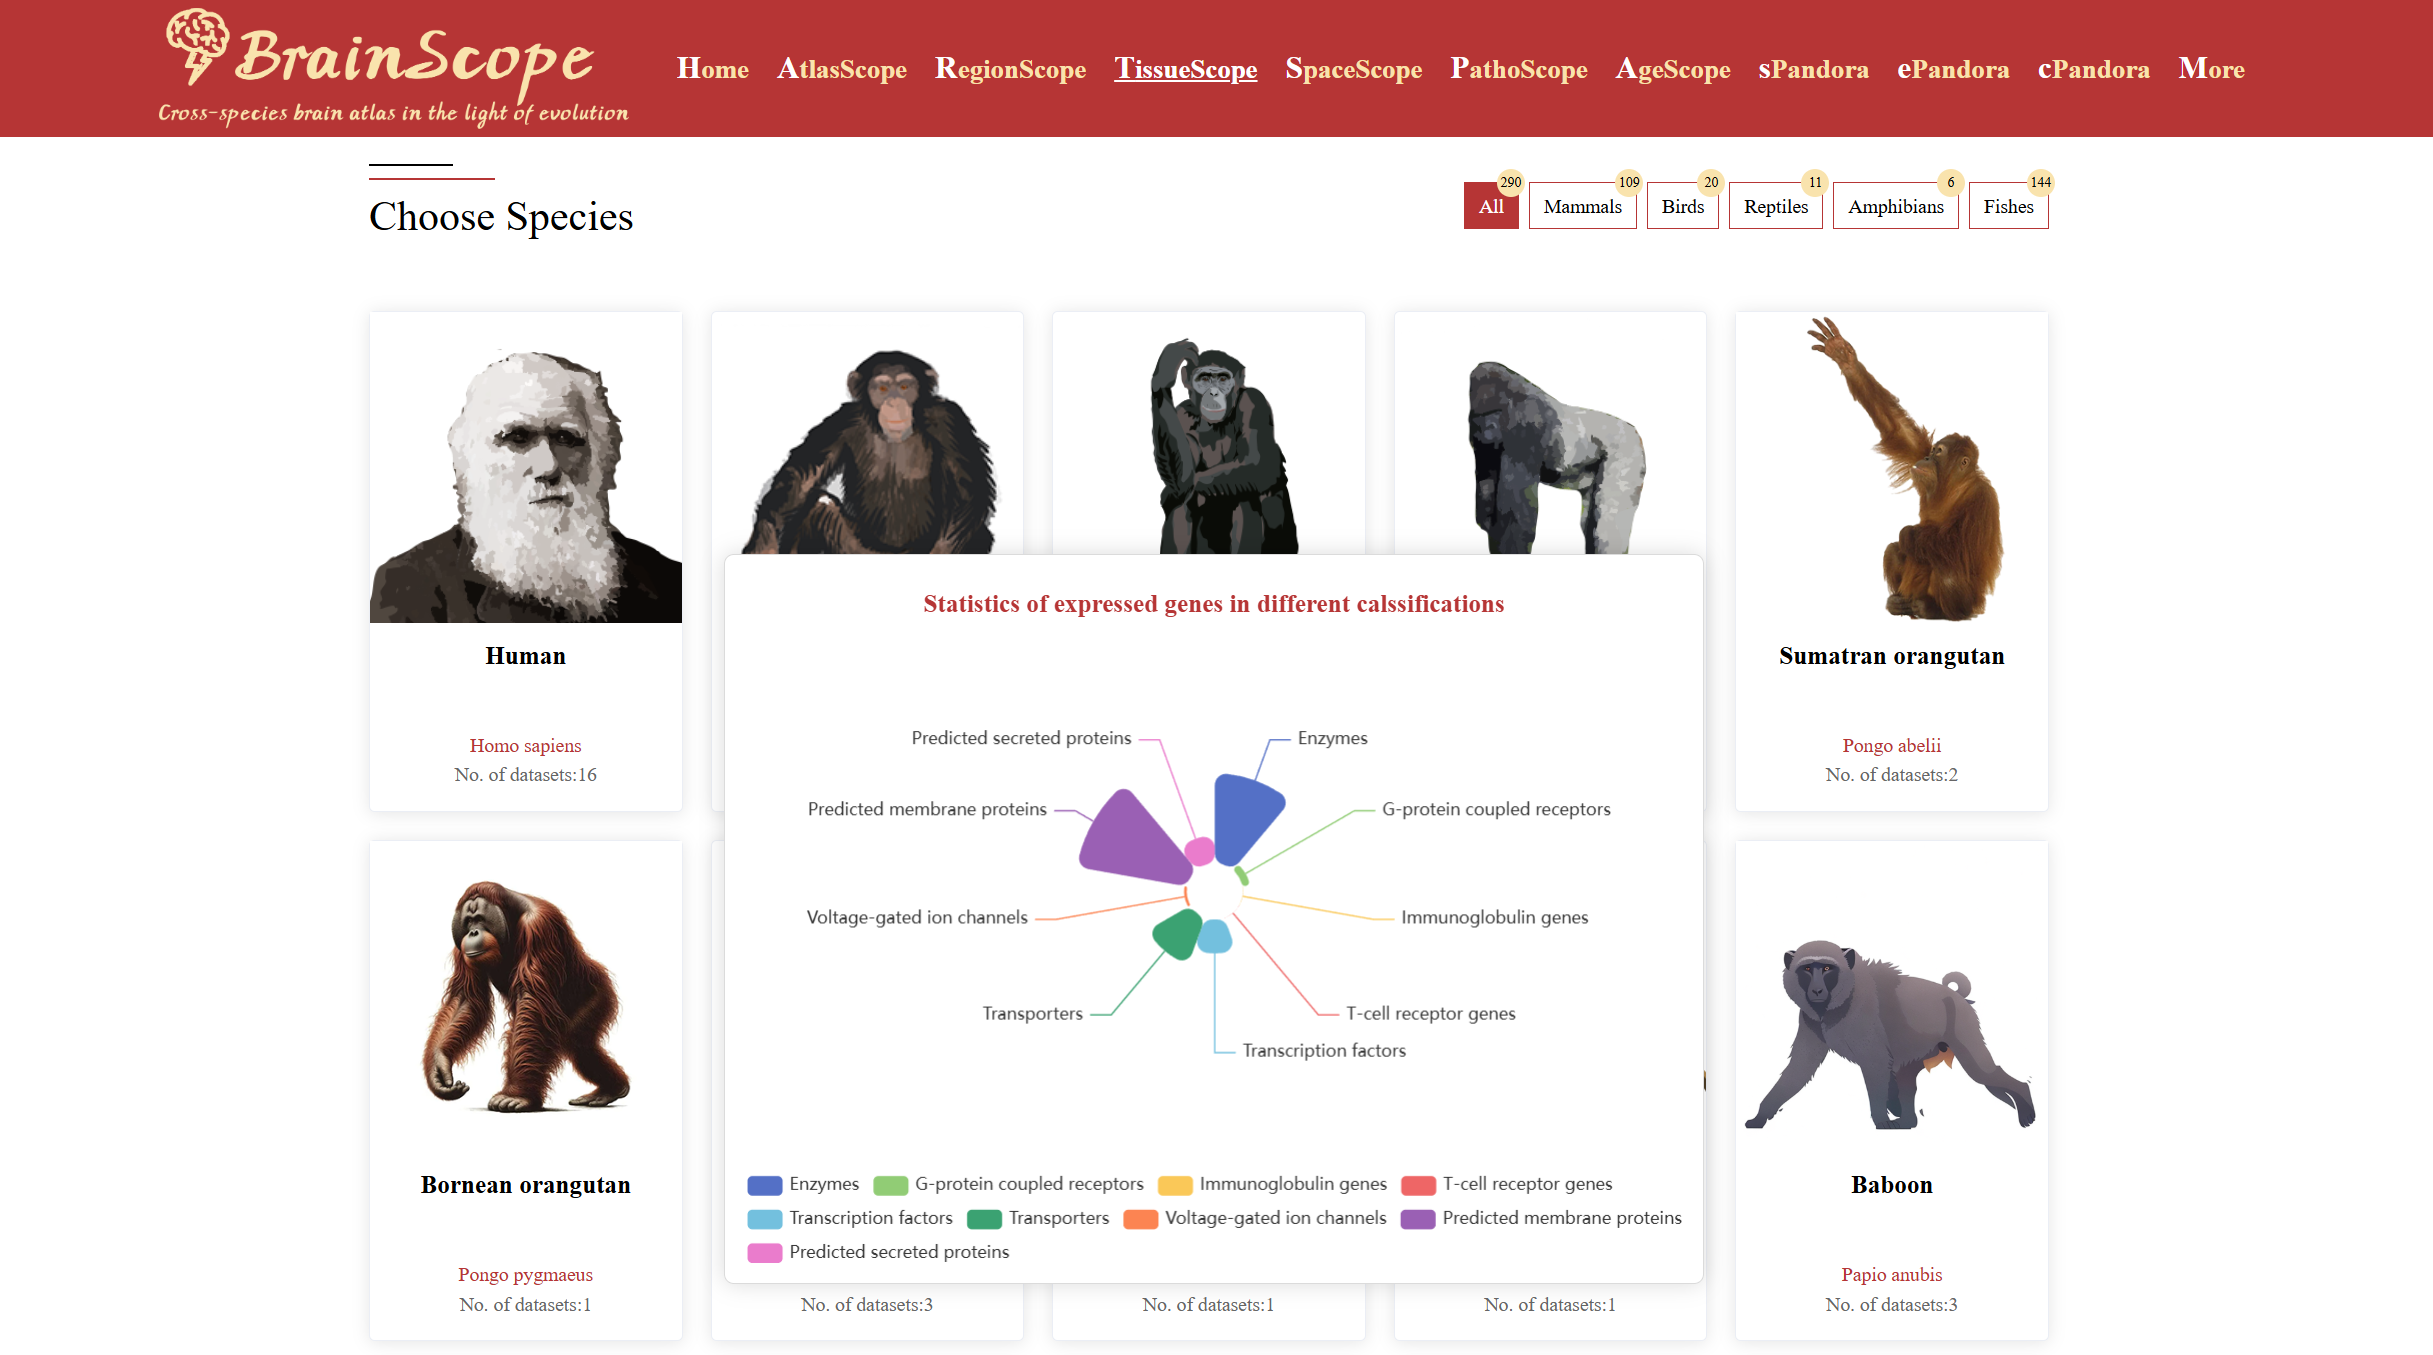
1. Filter Selection – Use the filter panel to select specific species.
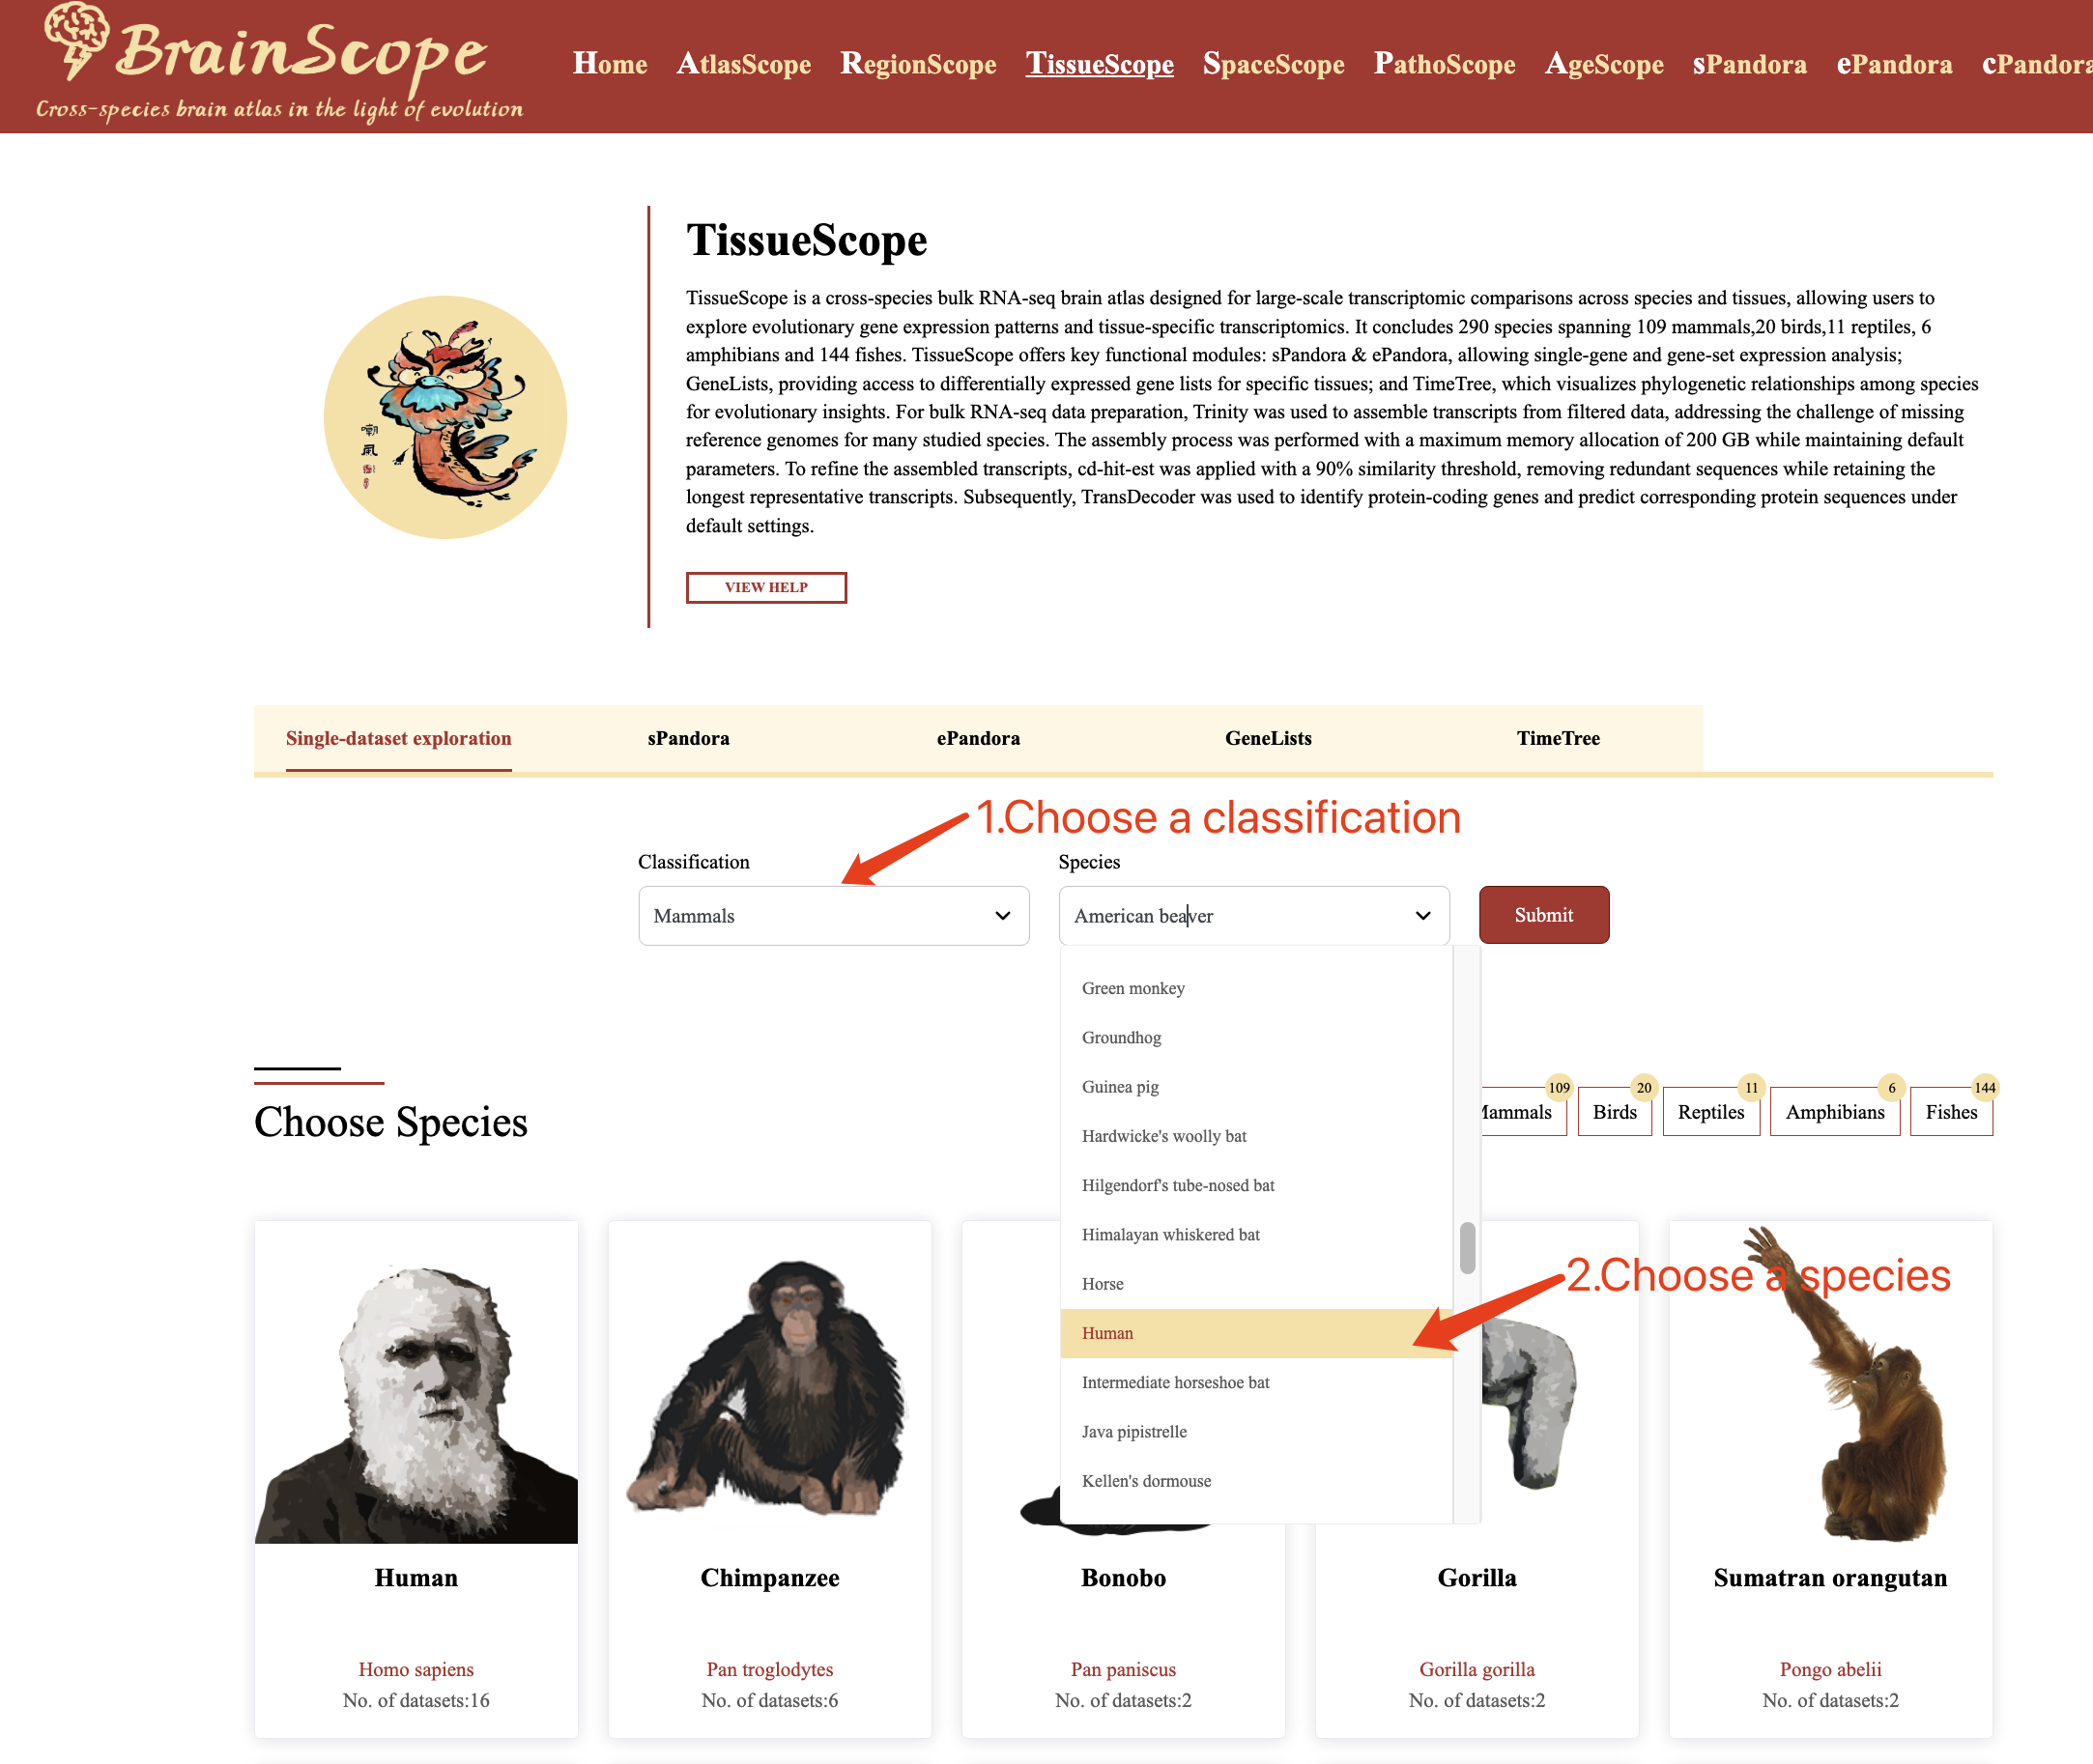
2. Clicking Species Images – Click on an image of the species of interest to access its brain single-cell datasets.
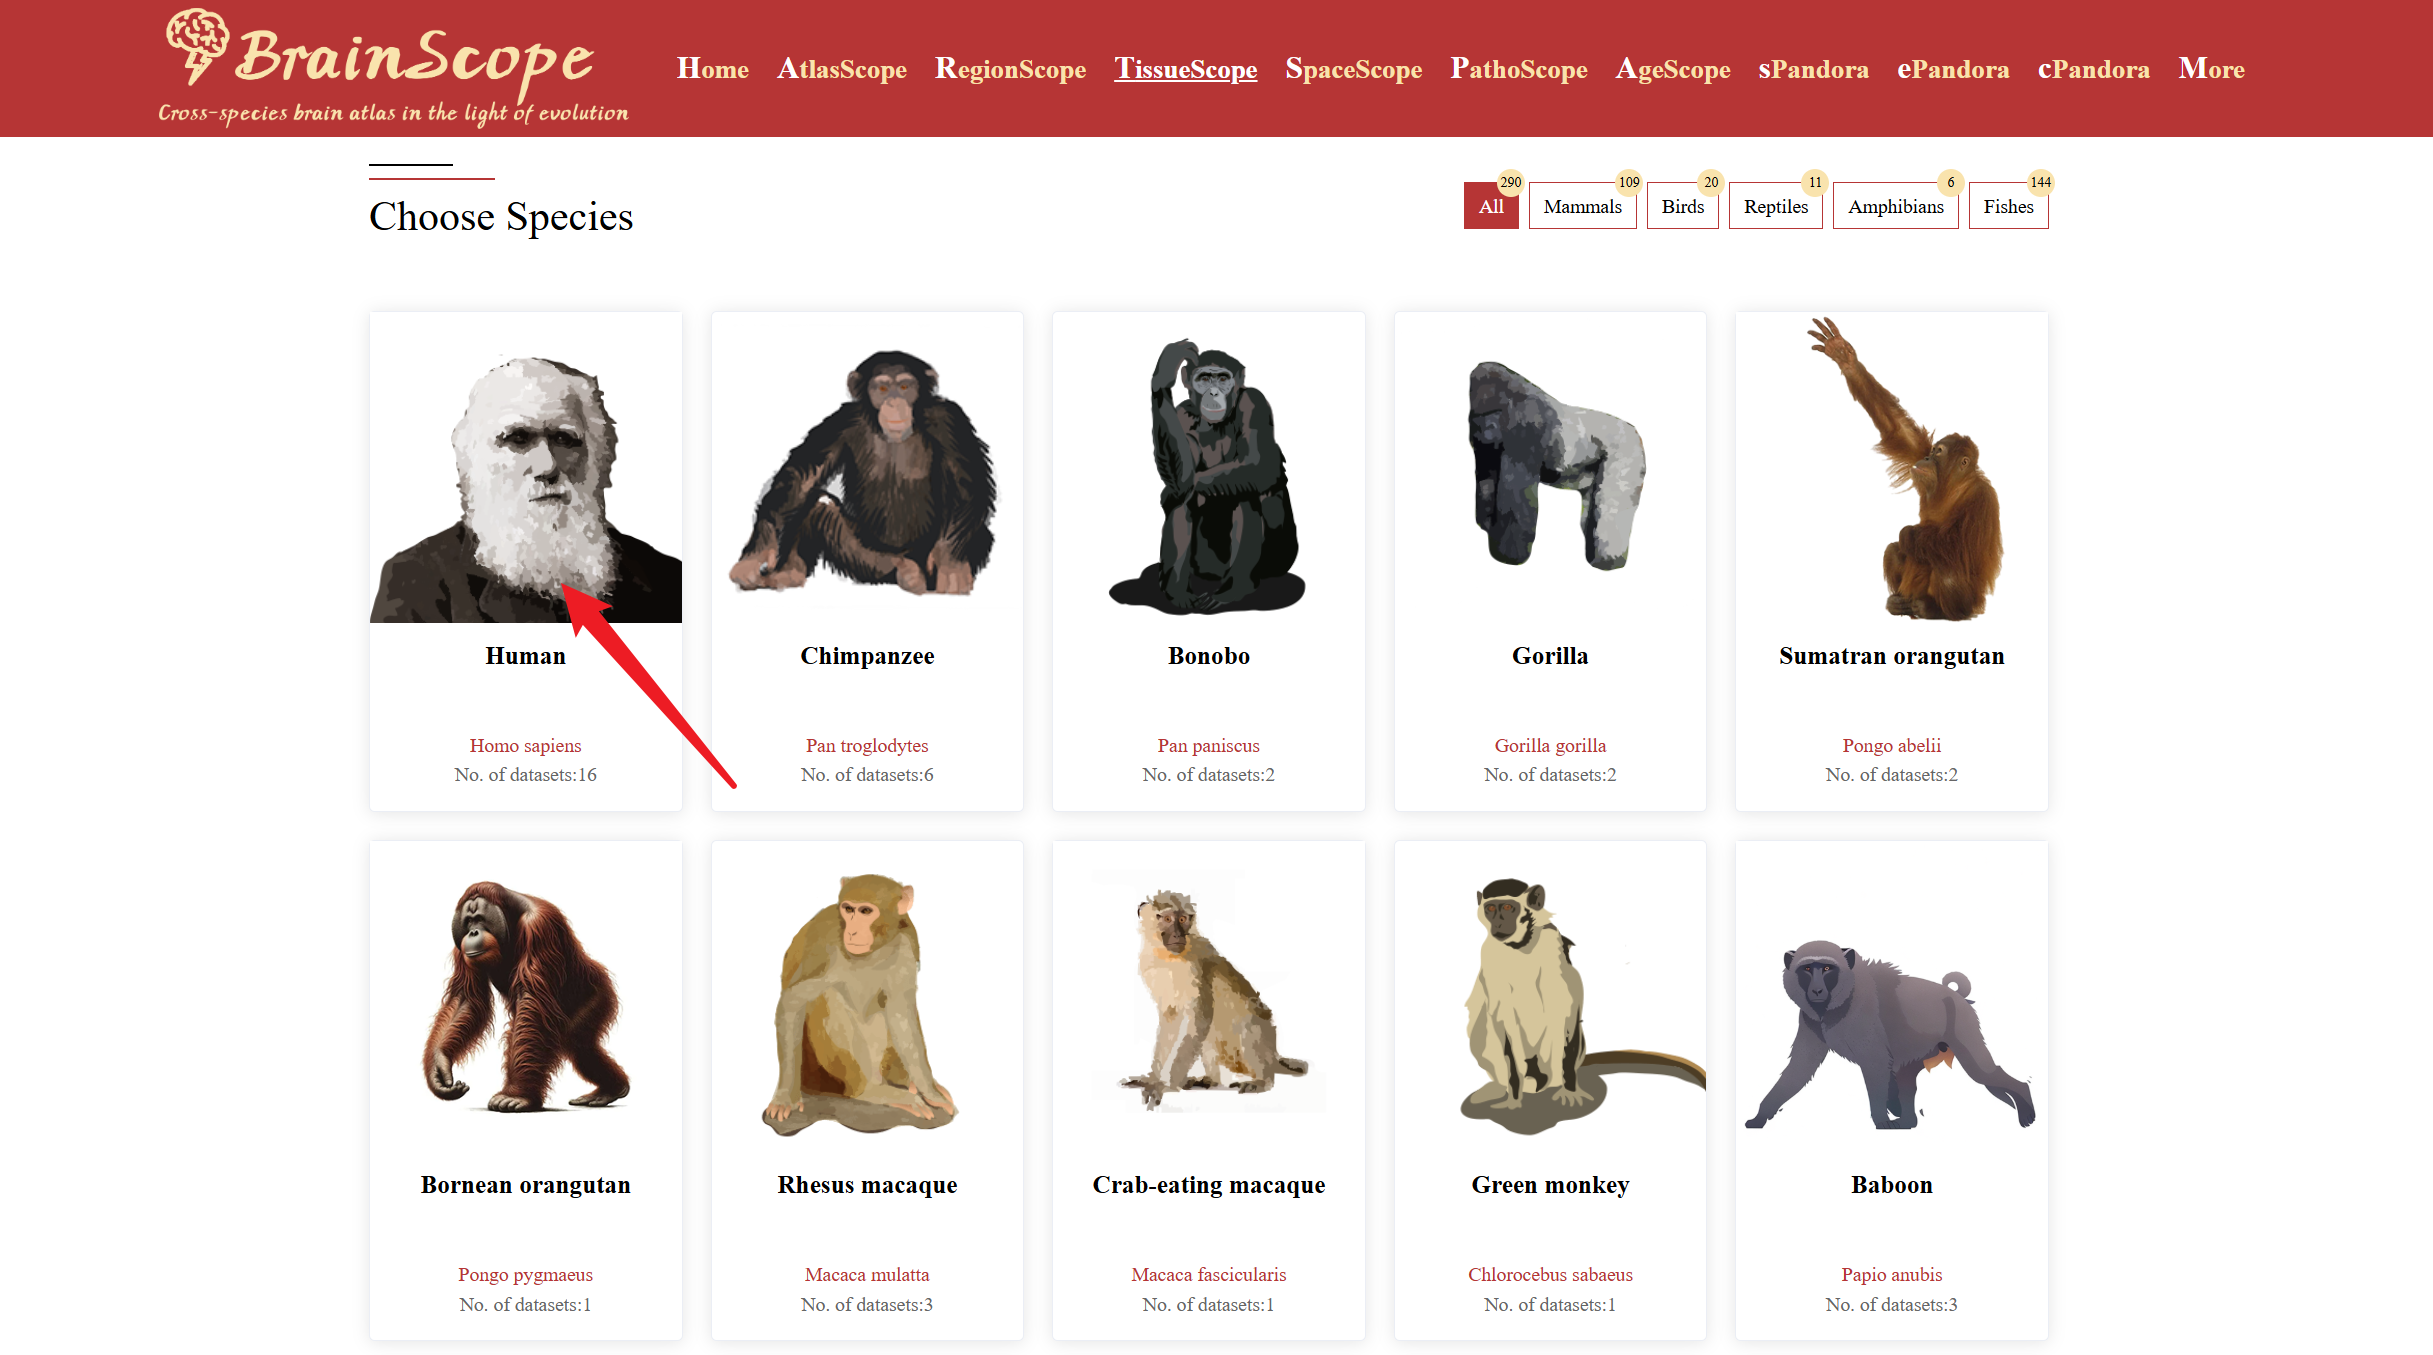
When your mouse move over an image of a species of interest, a pop-up visualization will appear, displaying statistic of expressed gene categorized into various functional groups (e.g., enzymes, transcription factors, transporters).
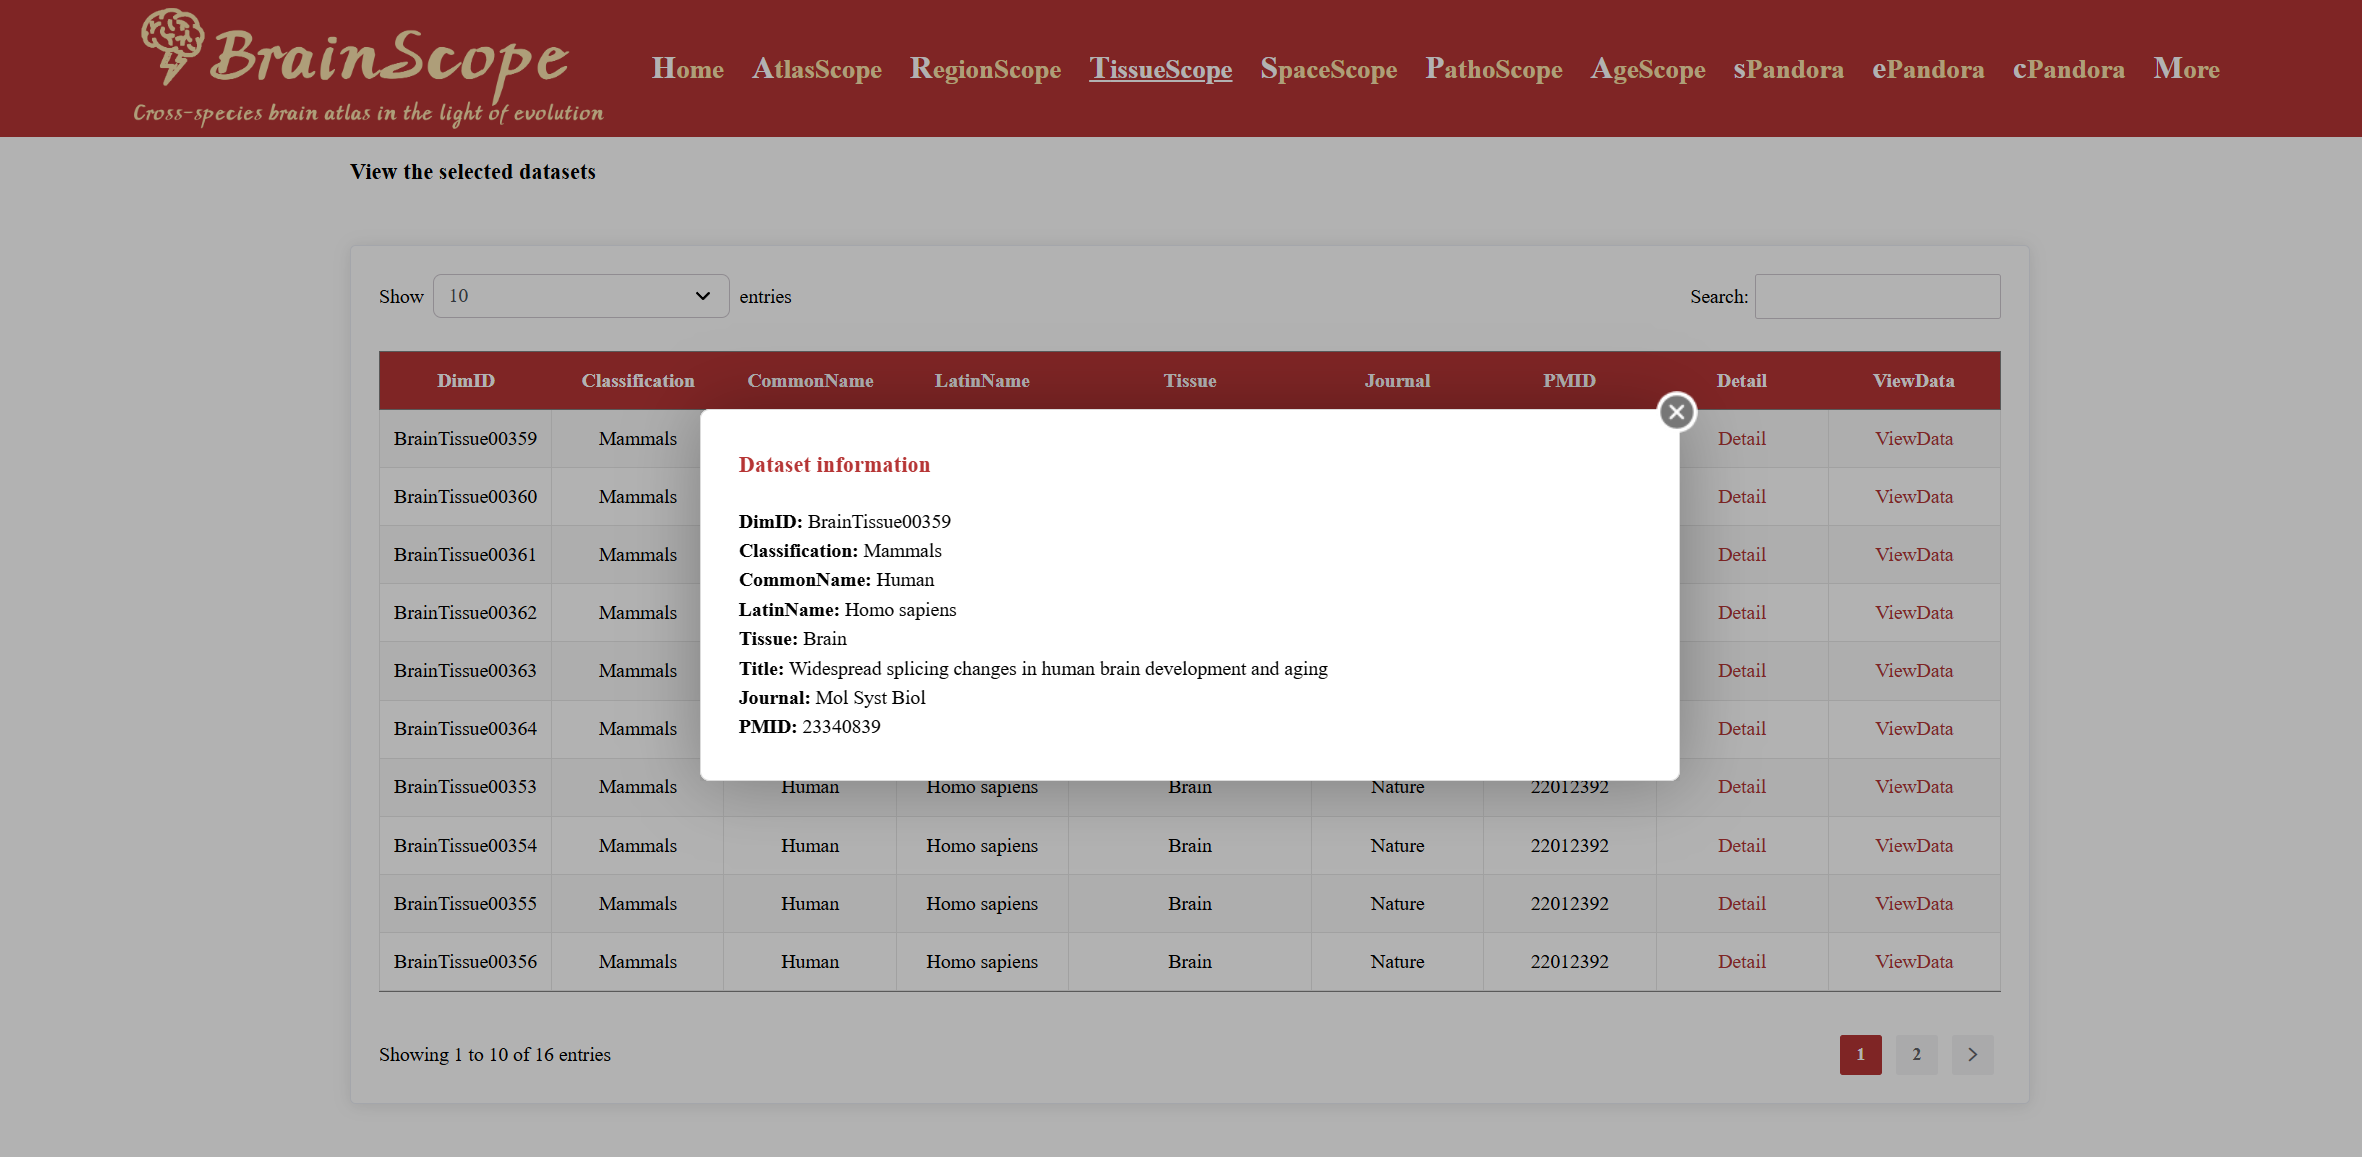
When you choose a species of interest,
there is a dataset table, which includes: Classification, Common
Name & Latin Name, Tissue Source, Journal & PMID Informatin,
Detail and ViewData.
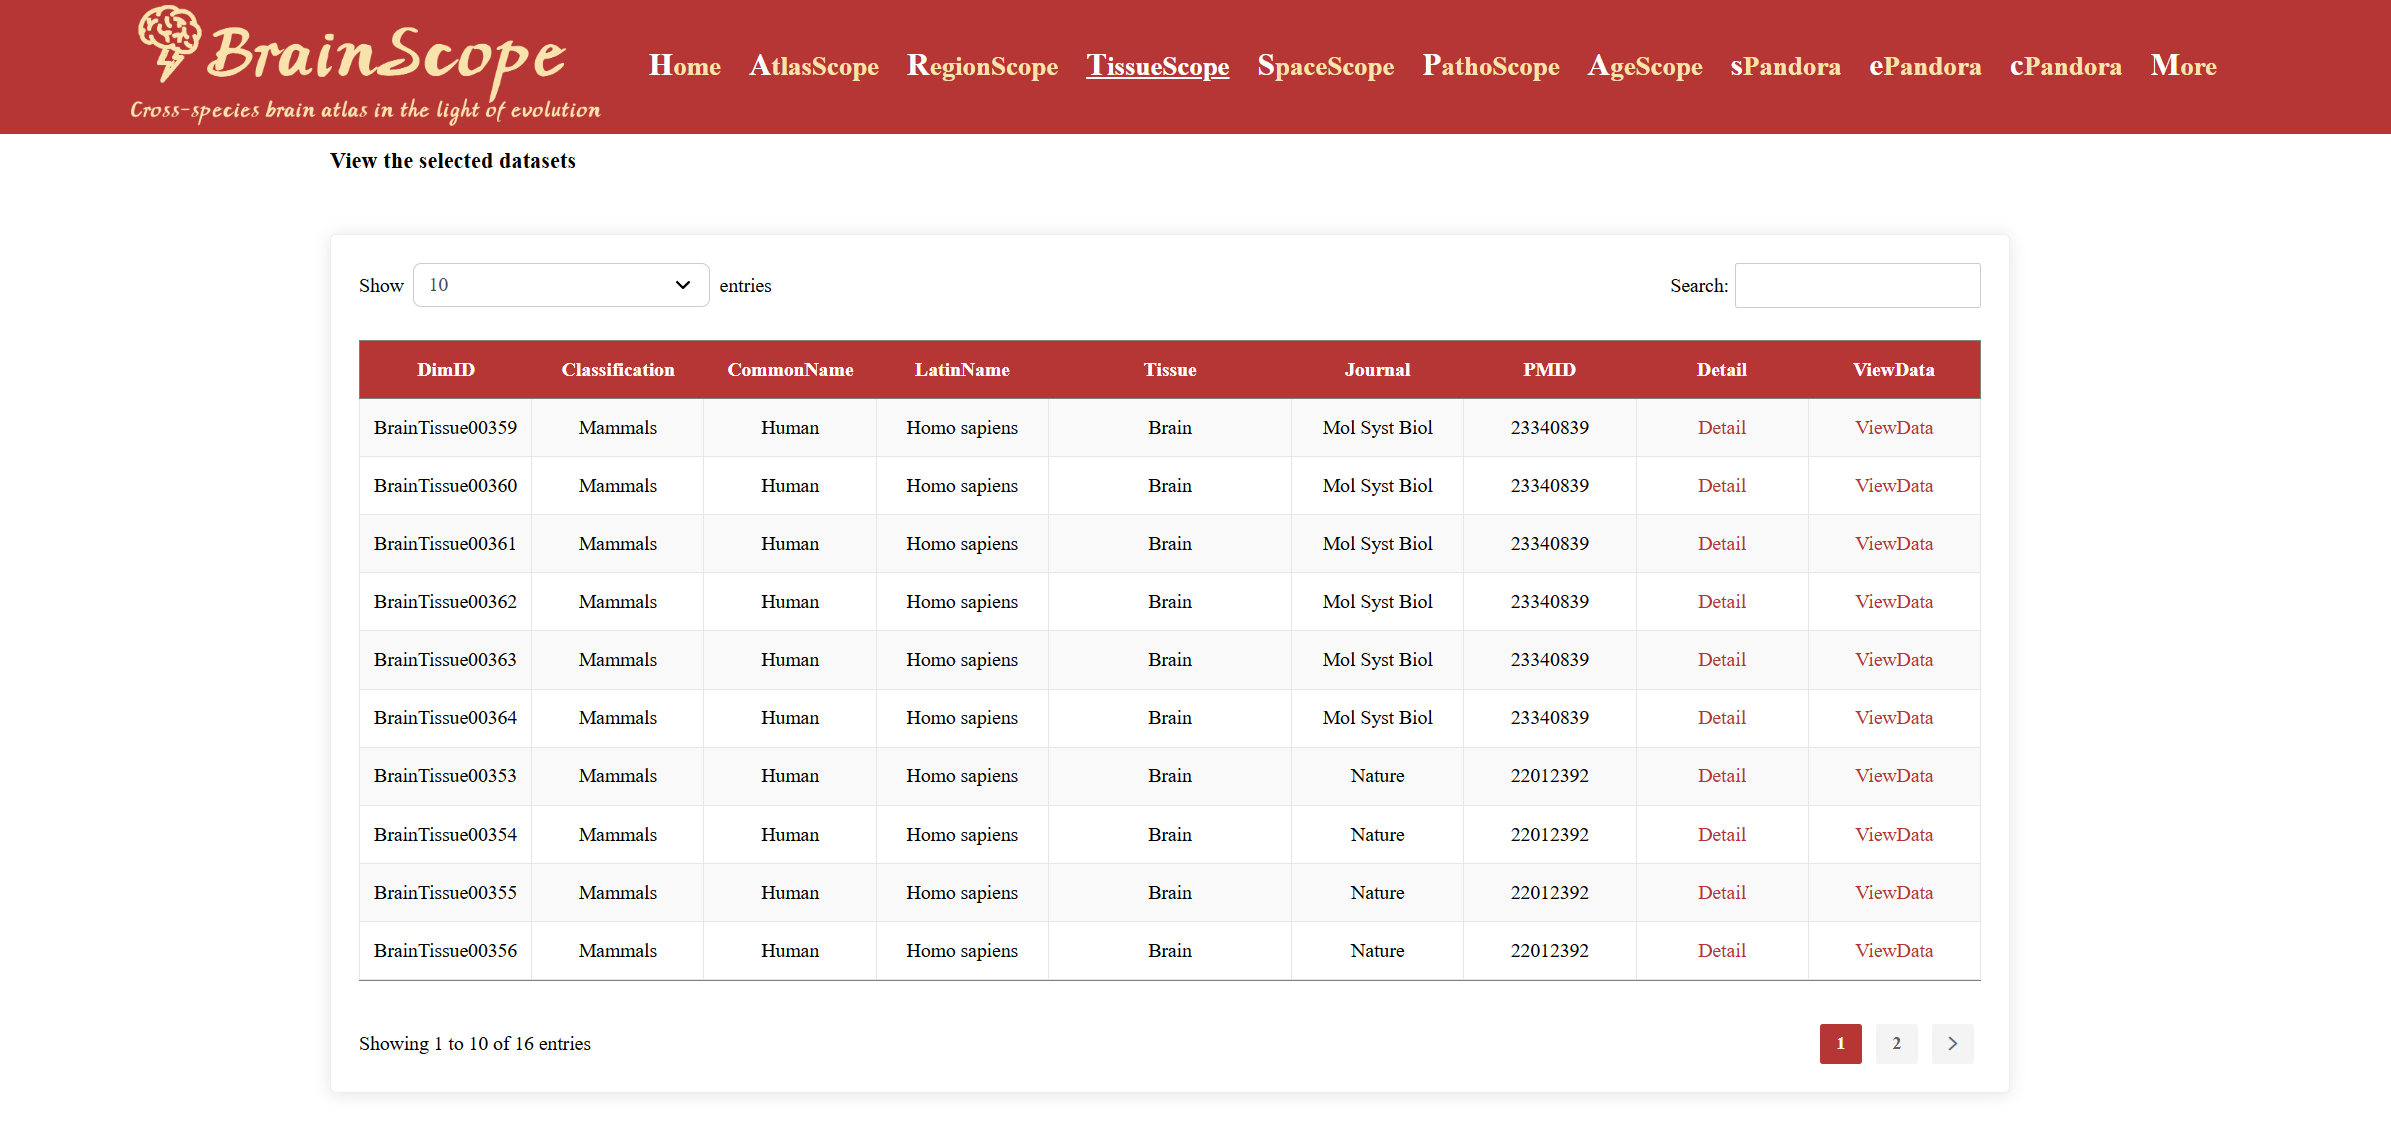
Click “Detail” to view in-depth dataset metadata, including study title, journal, PMID, and more.
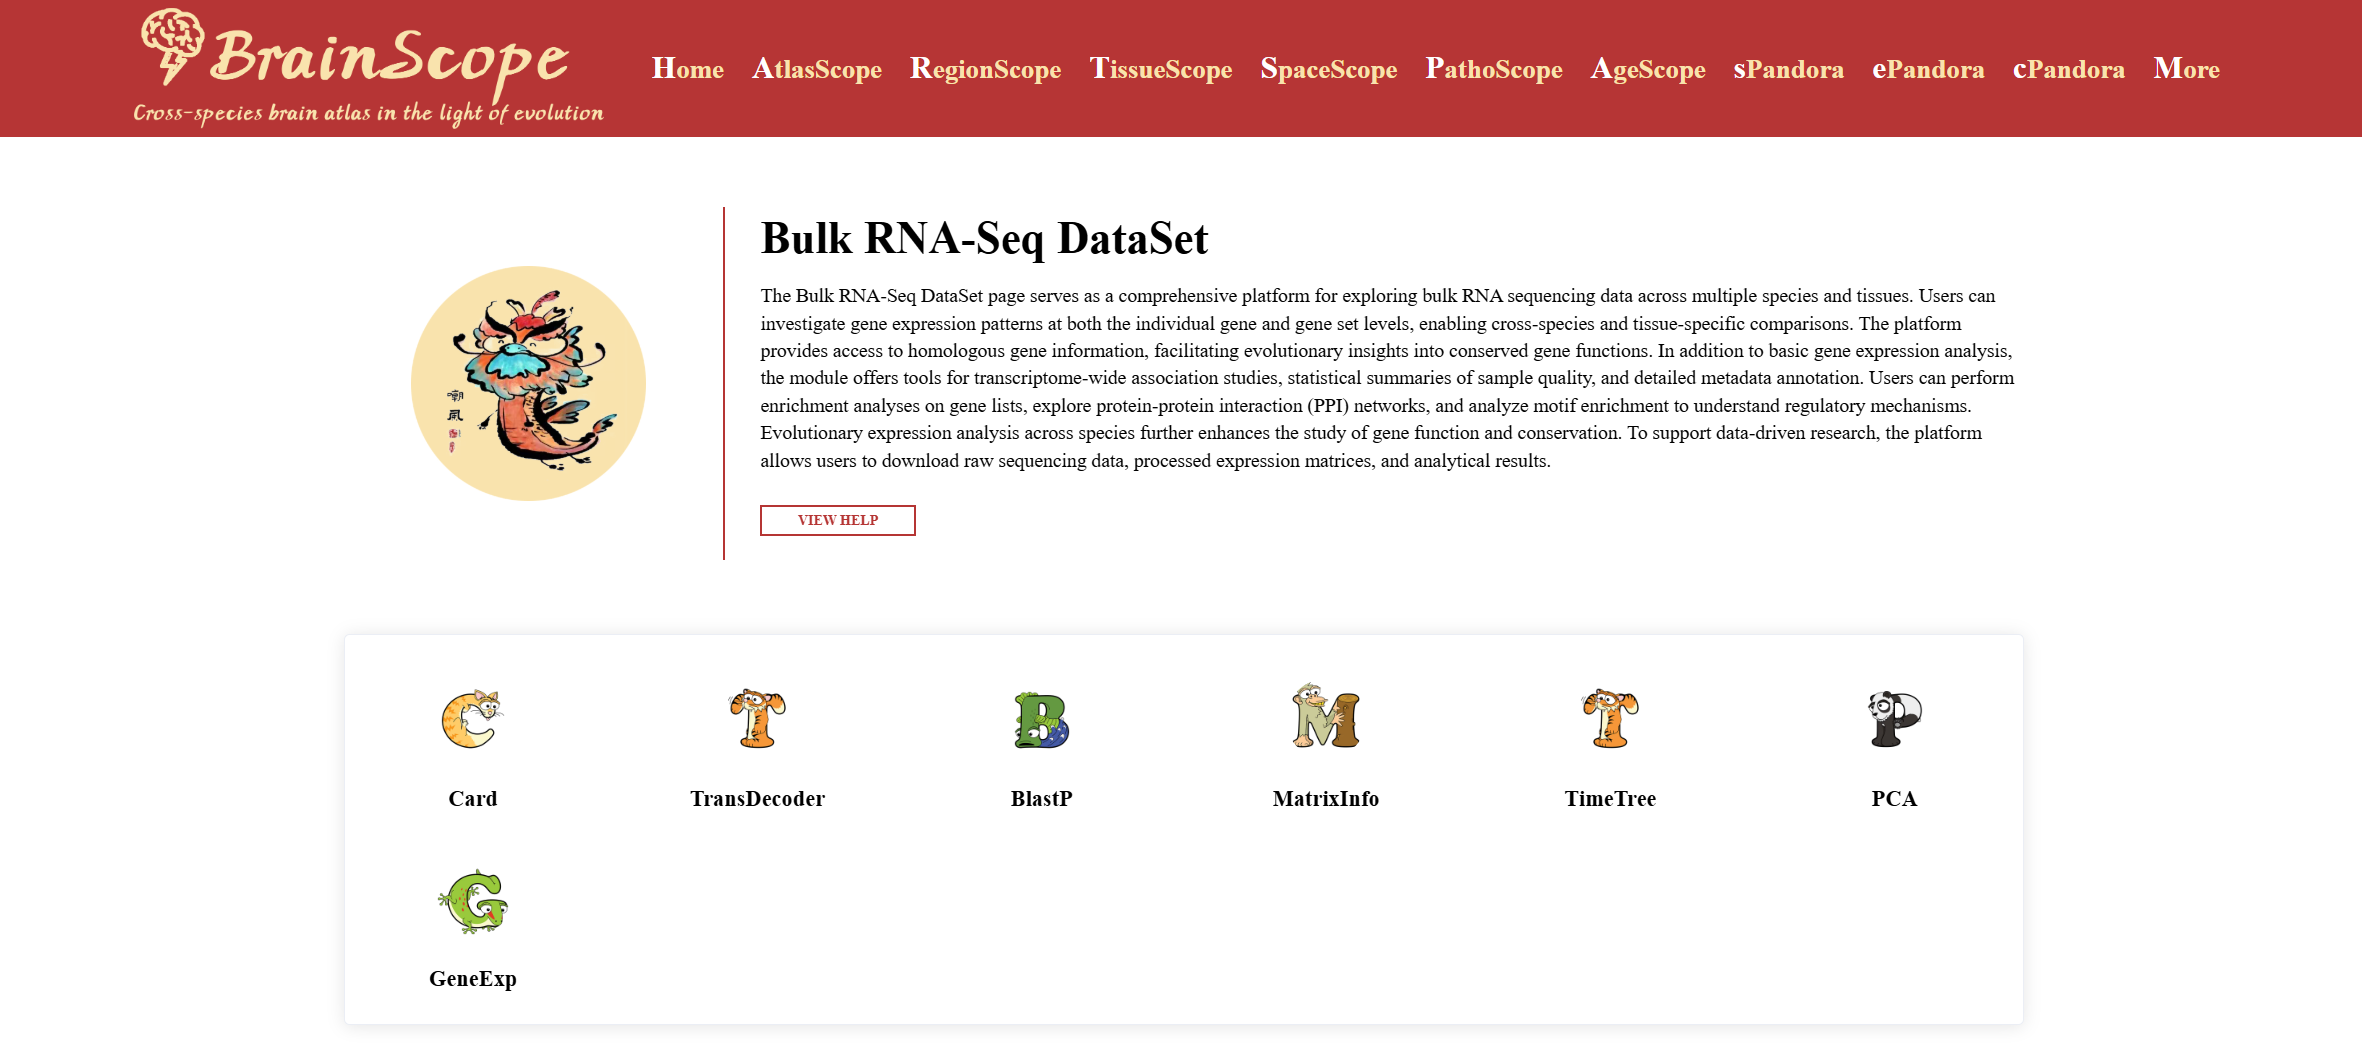
Click “ViewData” to enter the bulkRNA-Seq Dataset page for further exploration.
sPandora
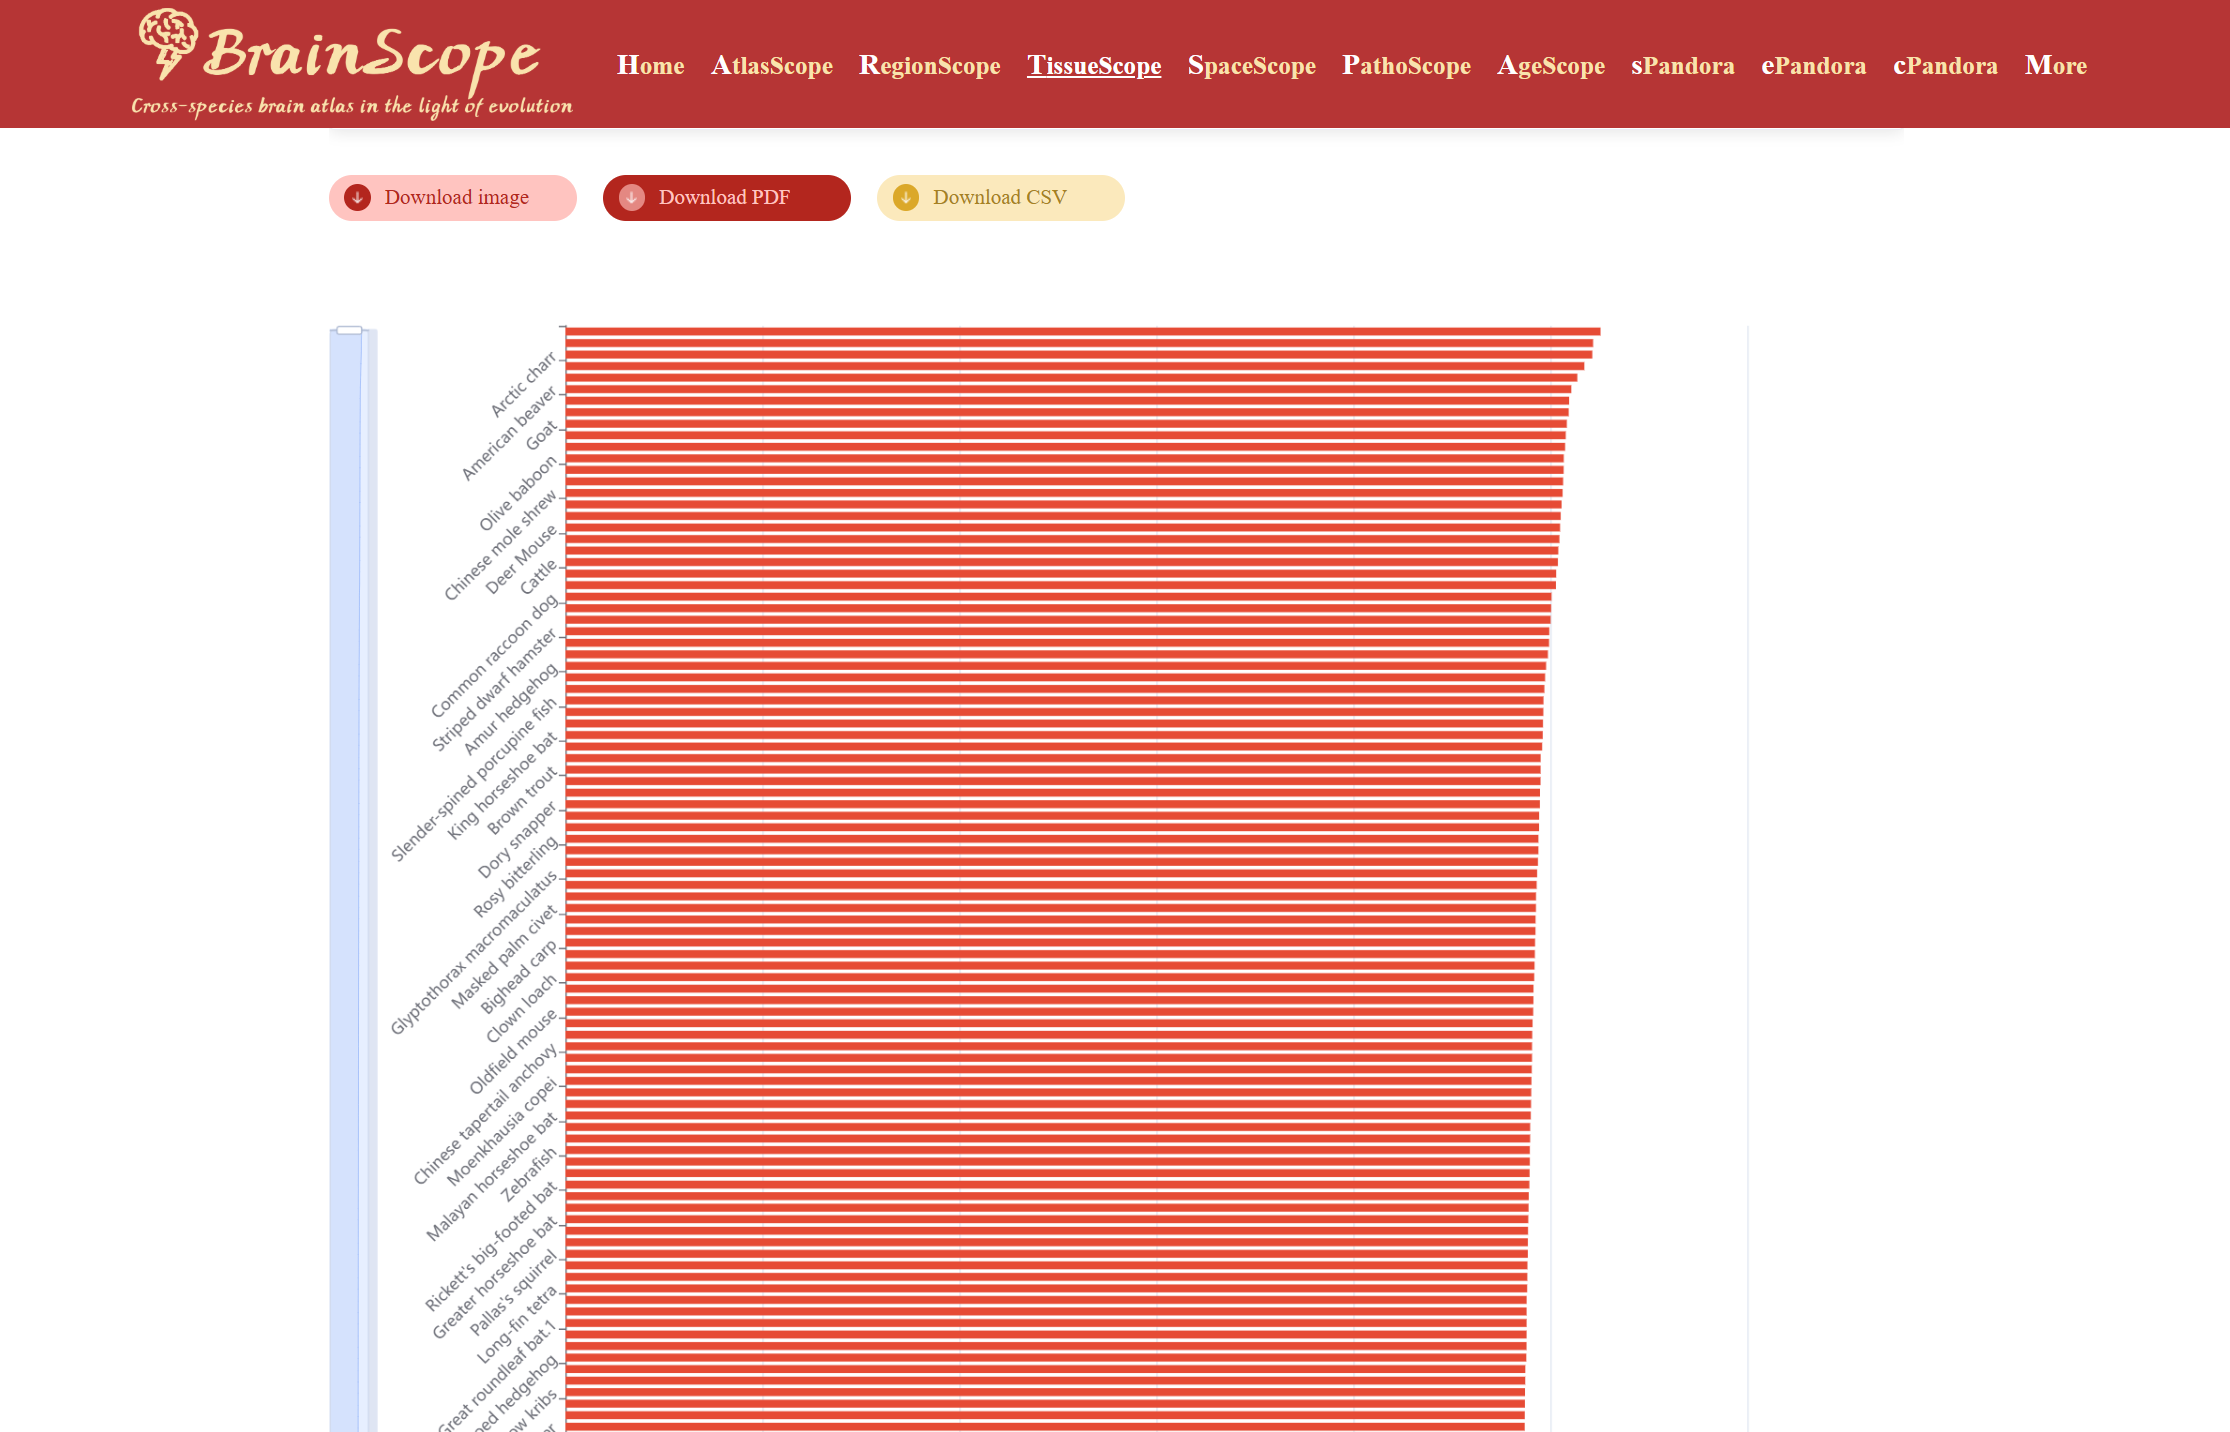
The sPandora module allows users to explore the expression of a single gene across species in bulk RNA-seq datasets.
Enter or select a gene of interest in the search box.
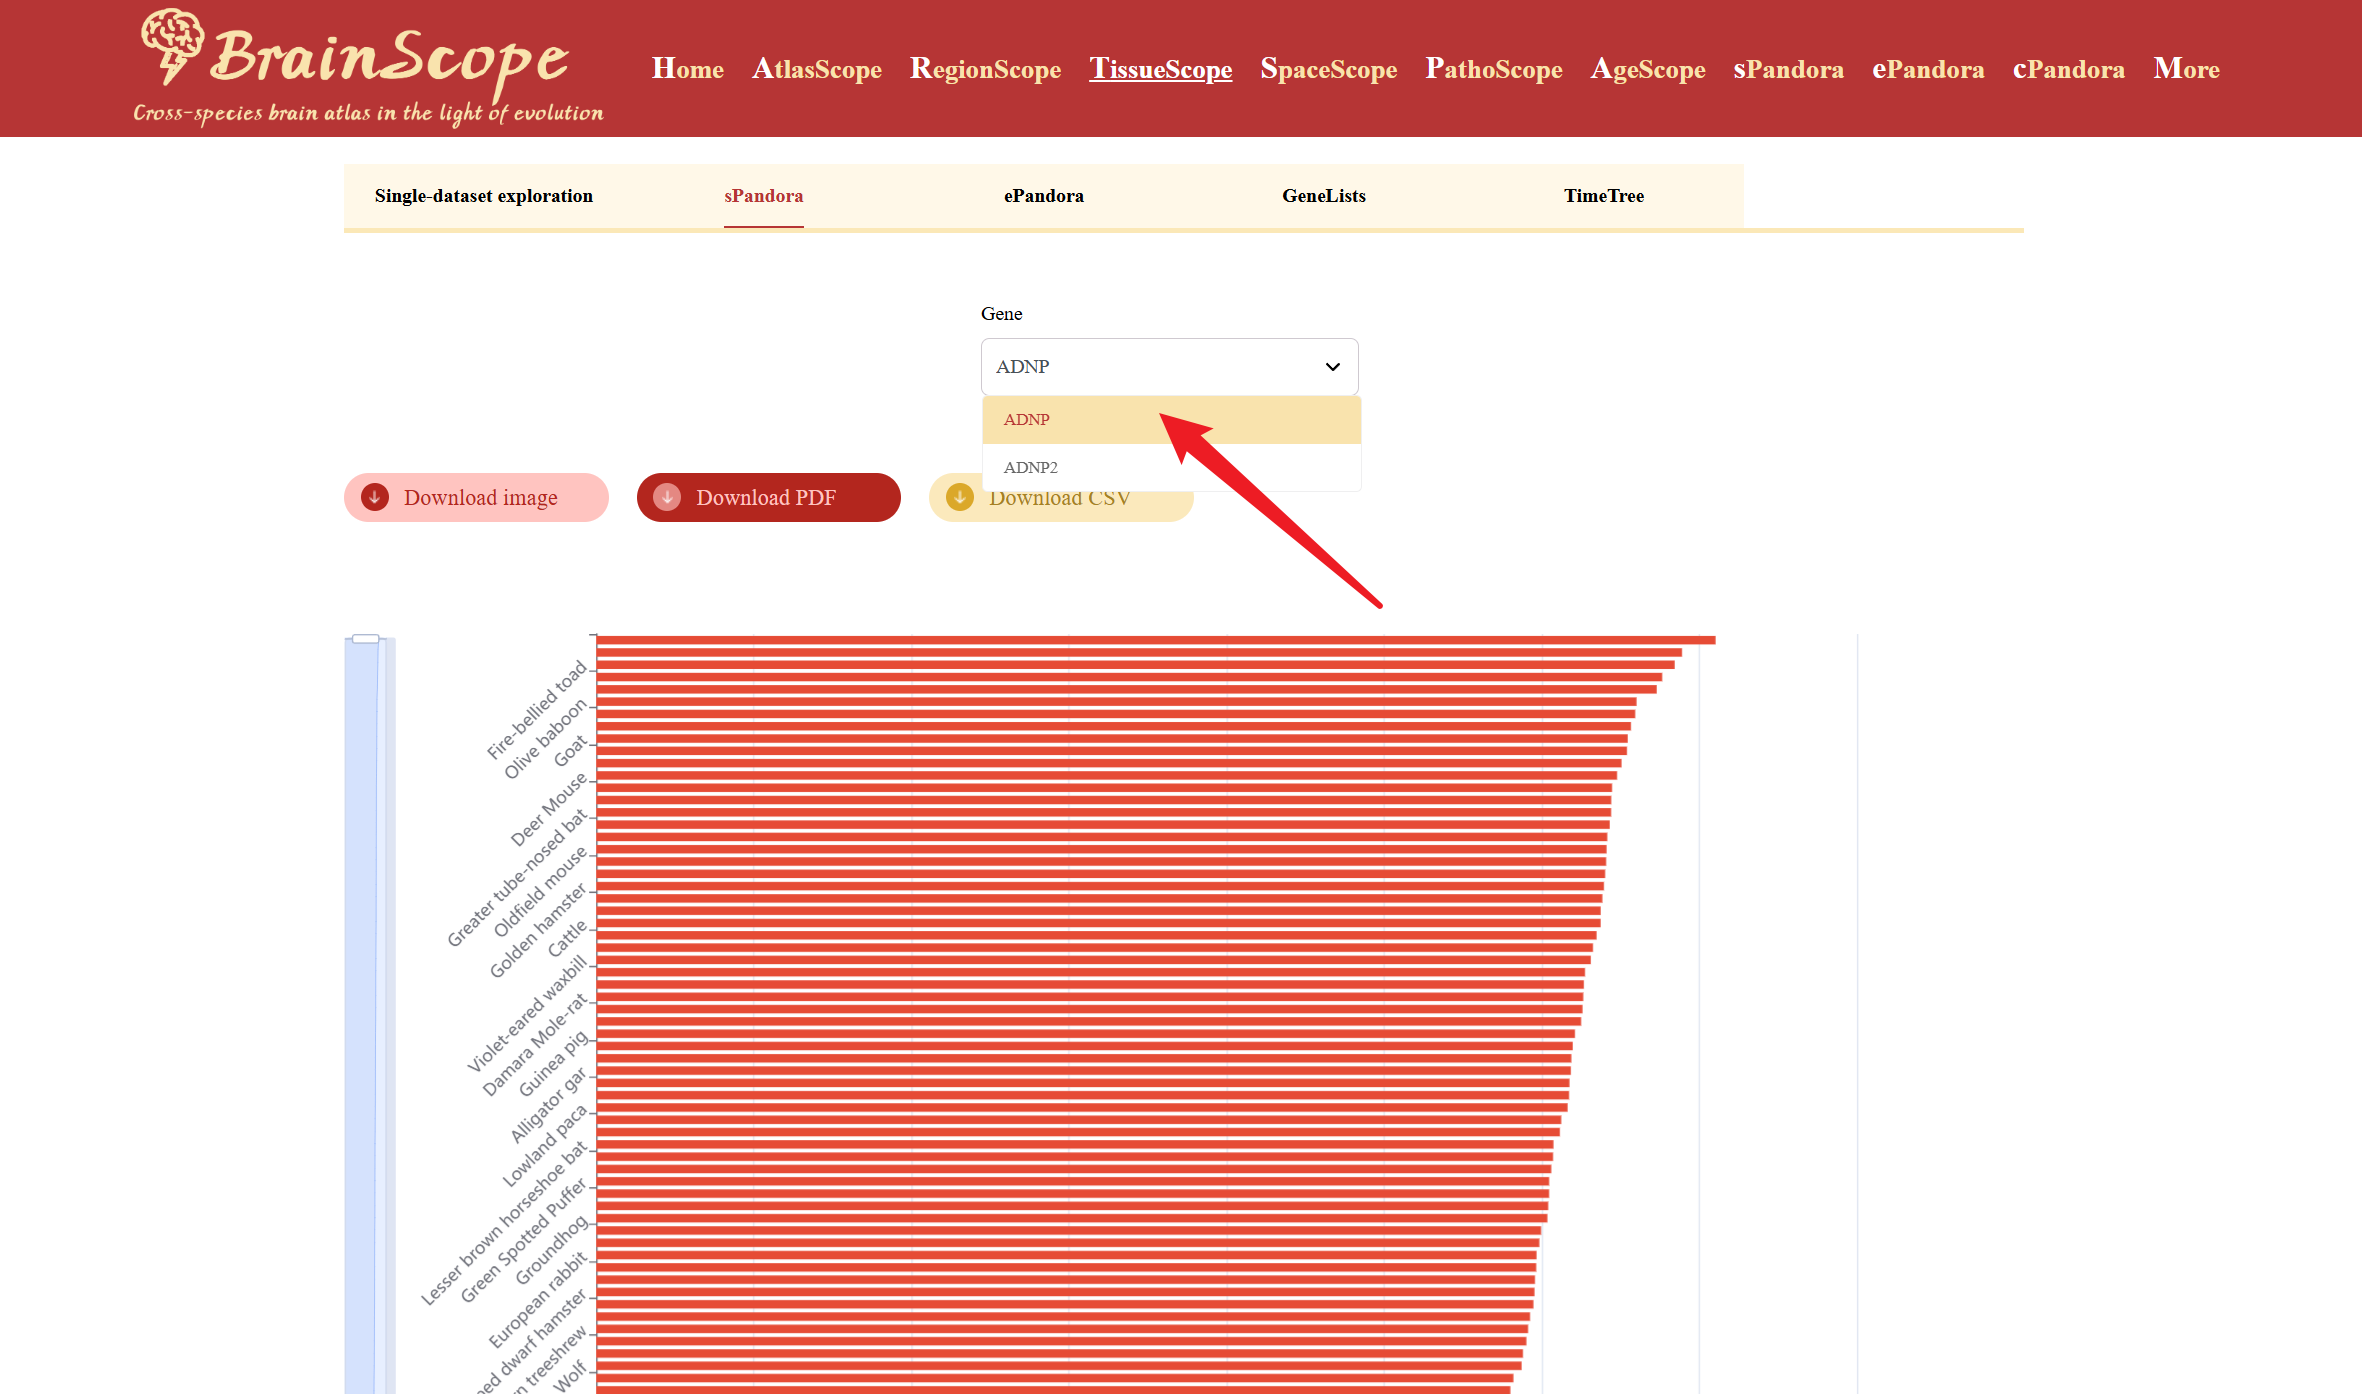
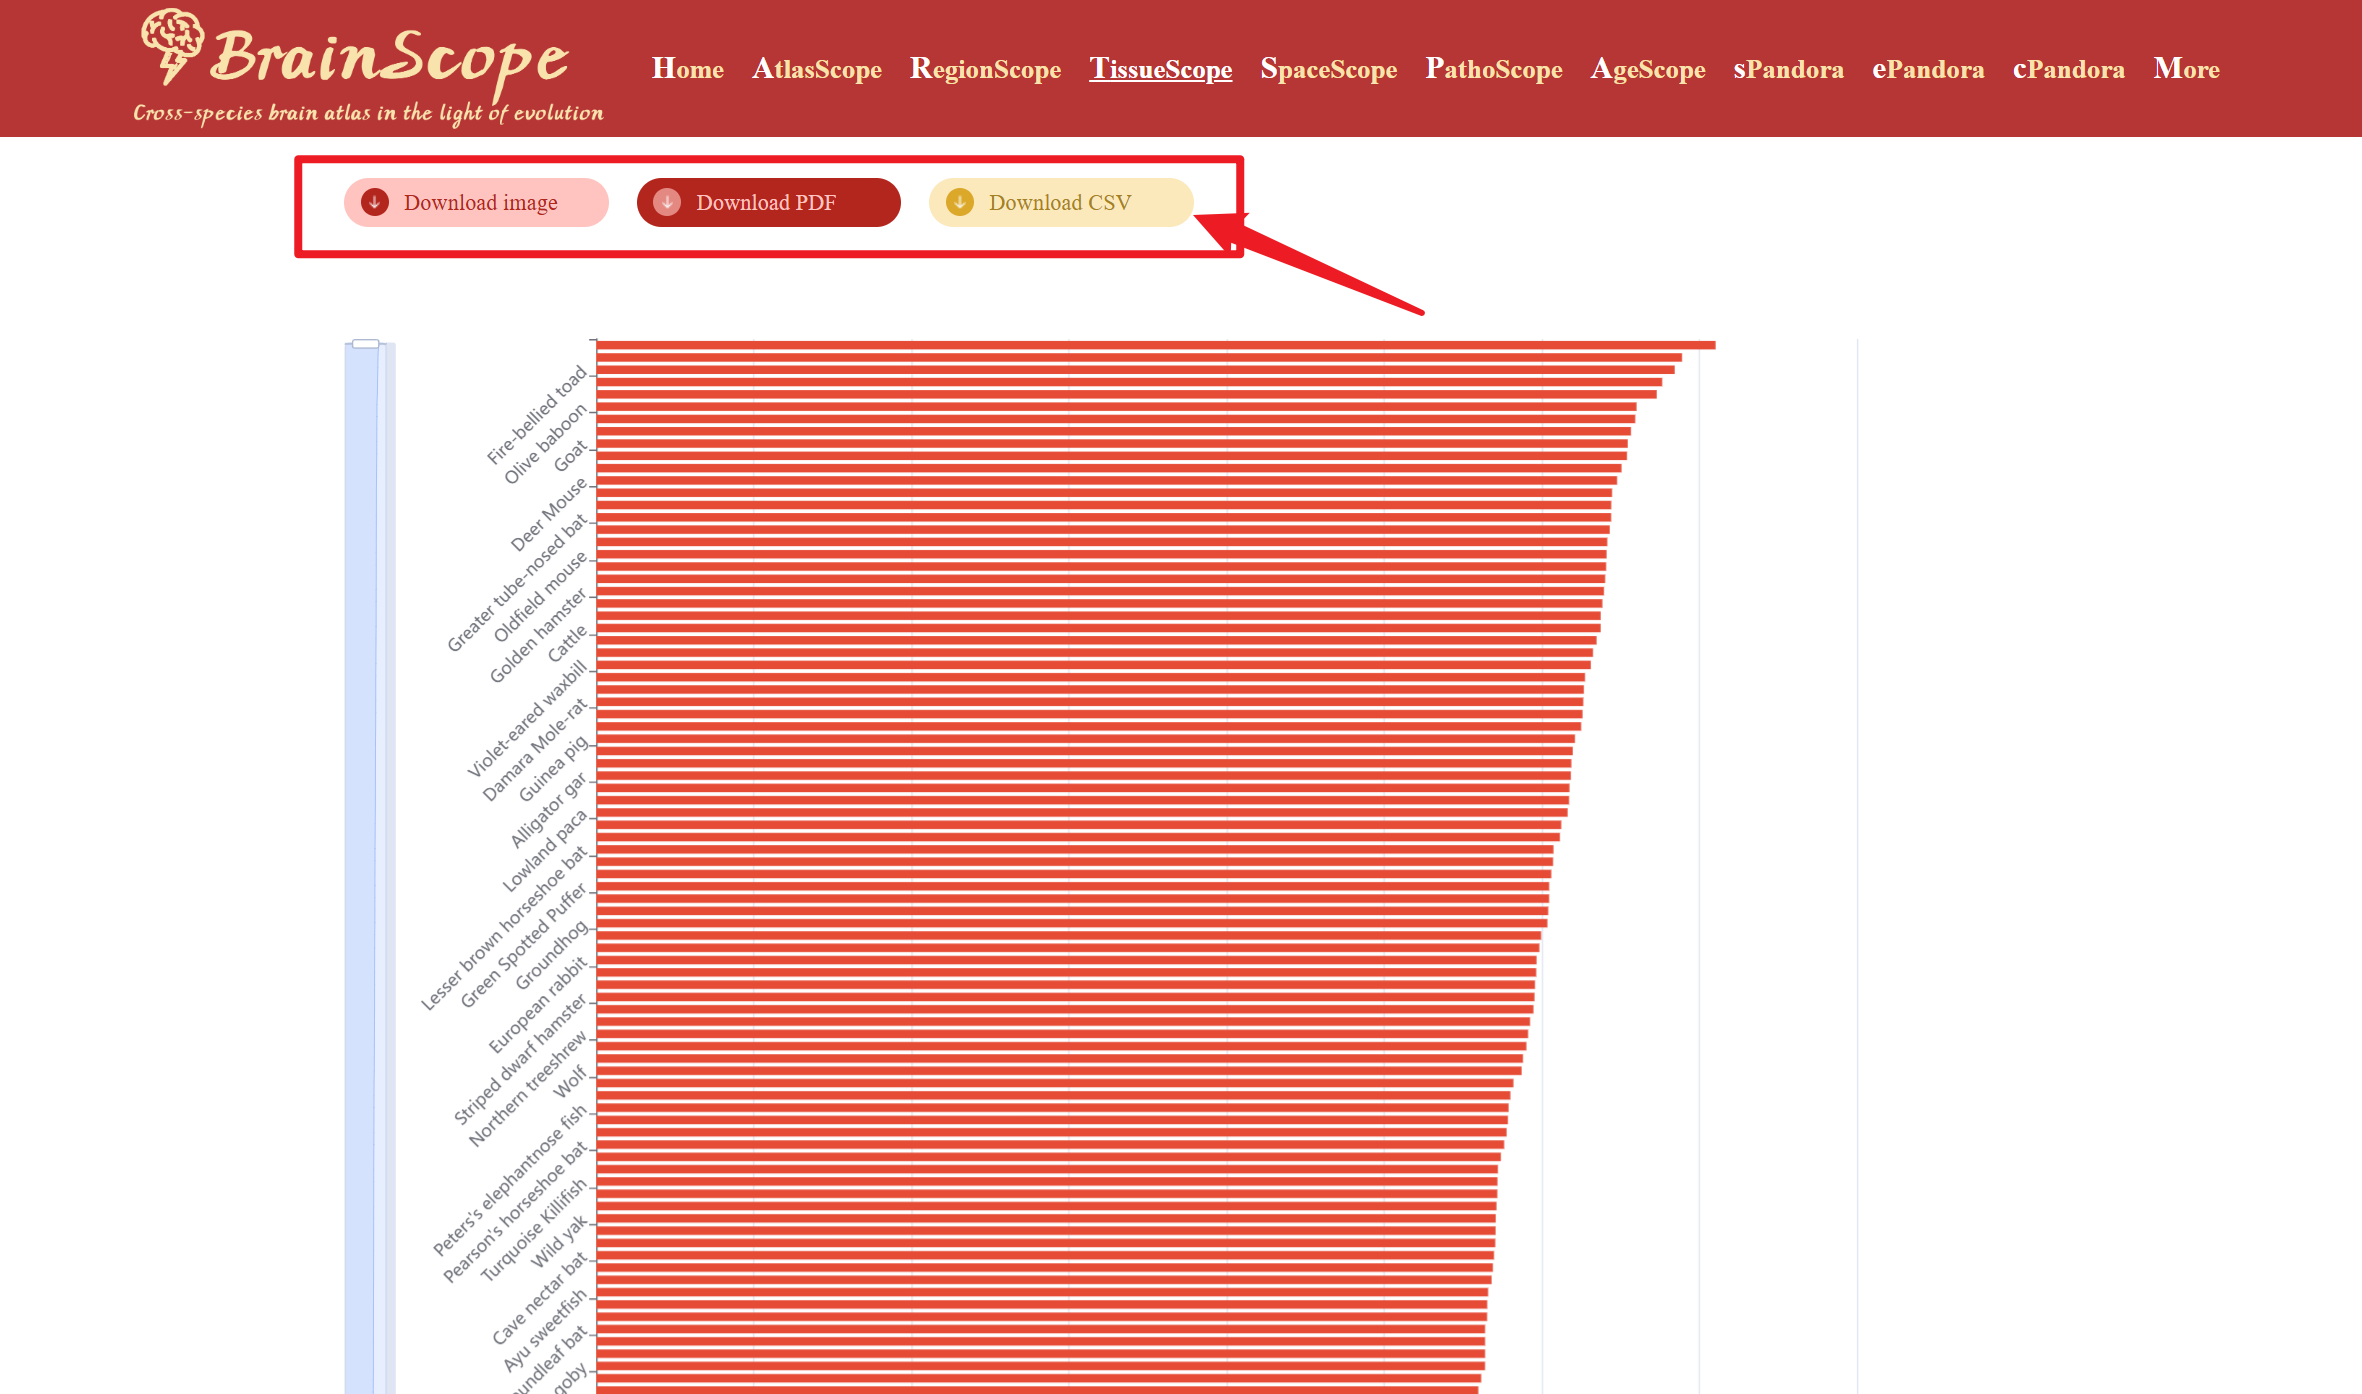
A heatmap will be generated below, showing the gene’s expression pattern in brain tissues across different species. Users can download the heatmap visualization in different formats by clicking buttons above the heatmap.
ePandora
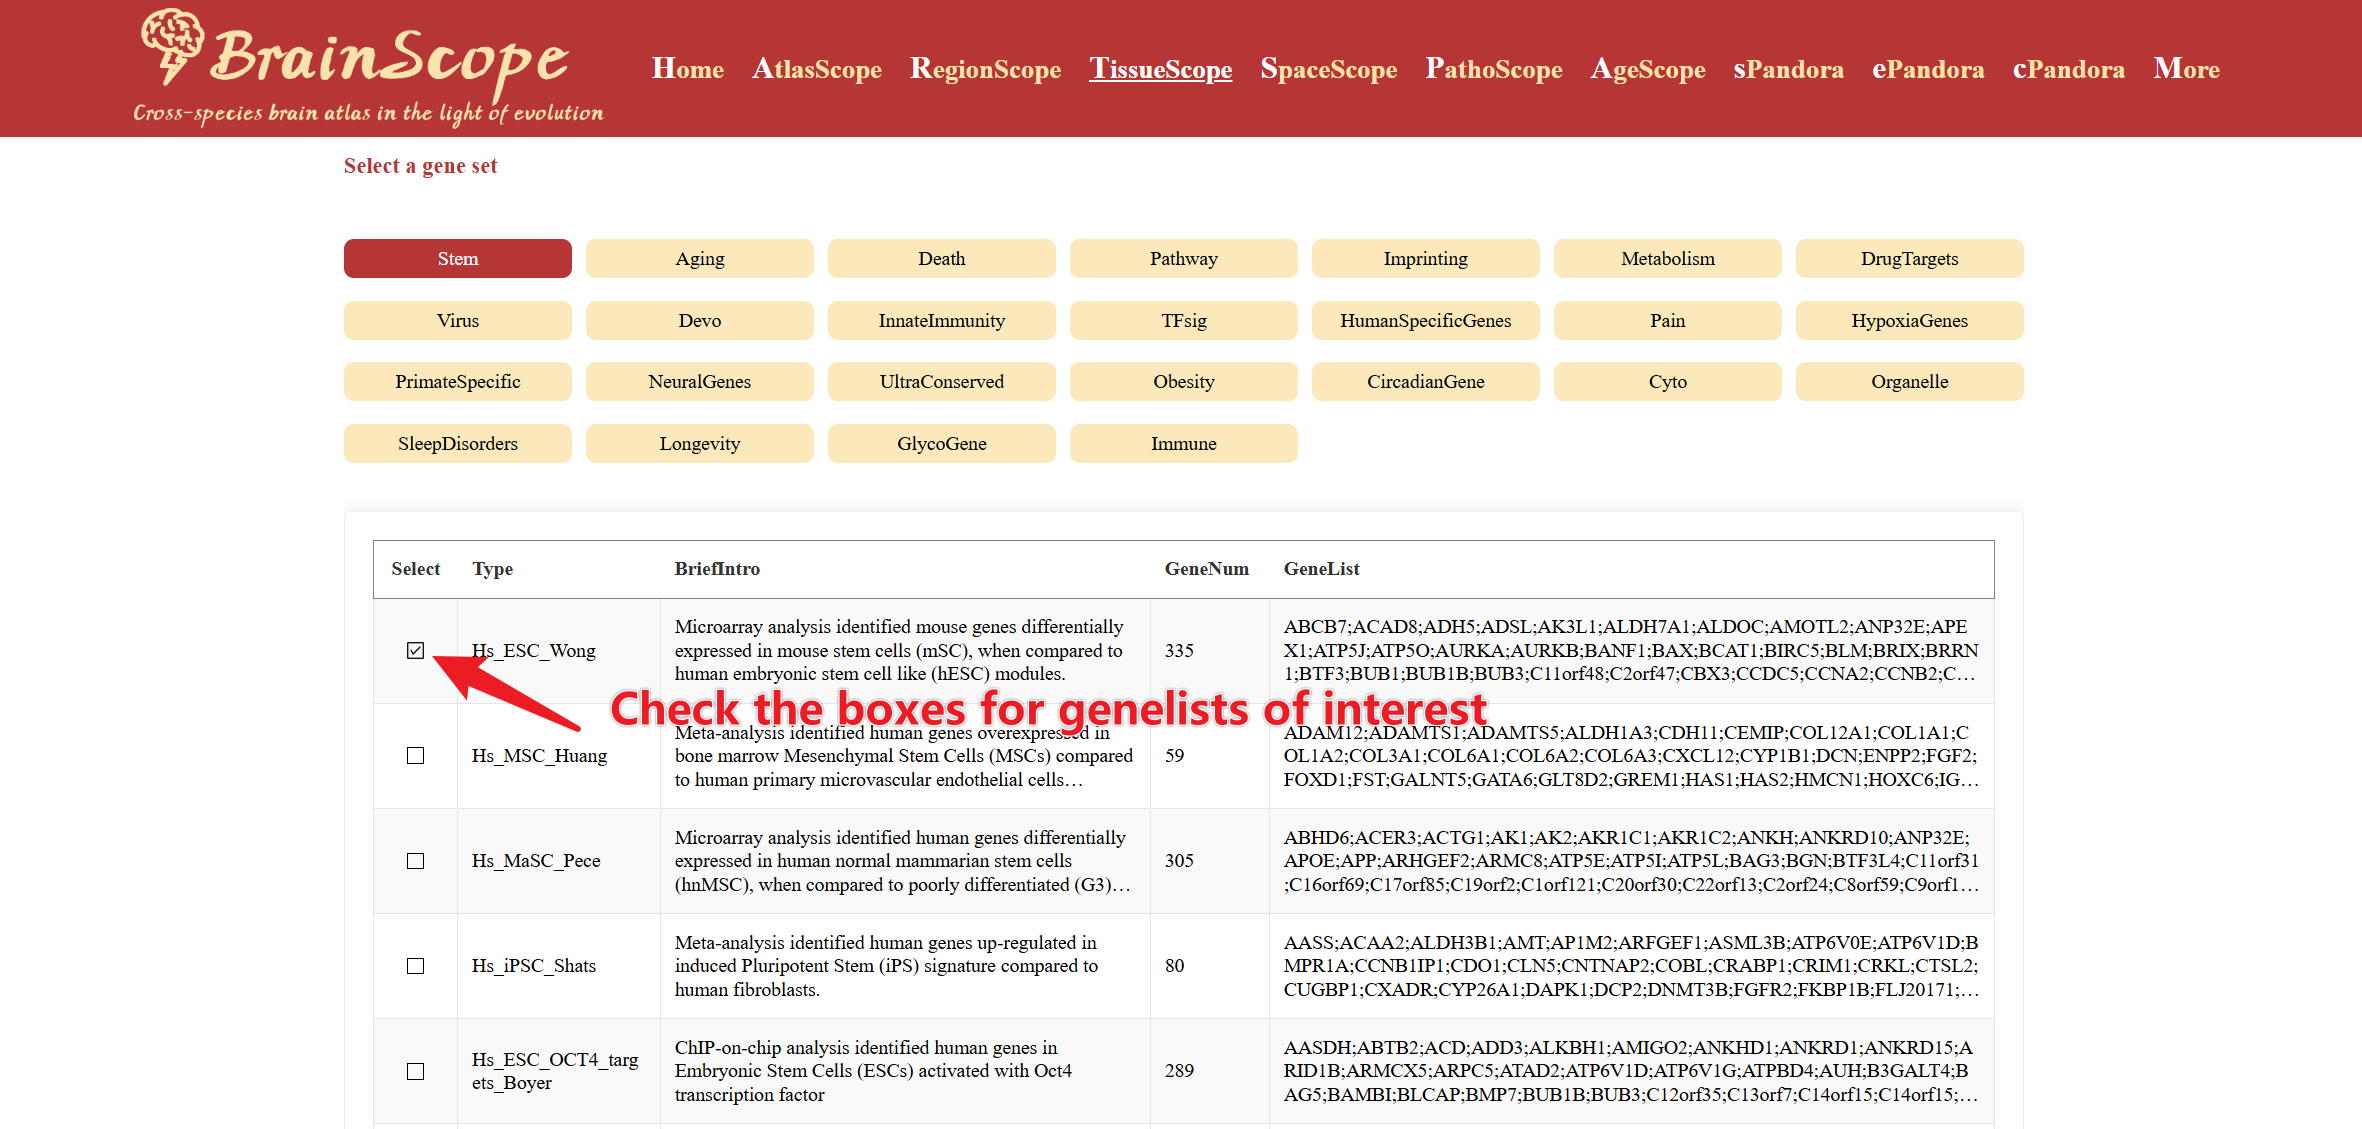
The ePandora module provides large-scale gene set expression comparisons, enabling users to explore the expression of functionally related genes across species.
Select a gene set category from 28 predefined gene set groups.
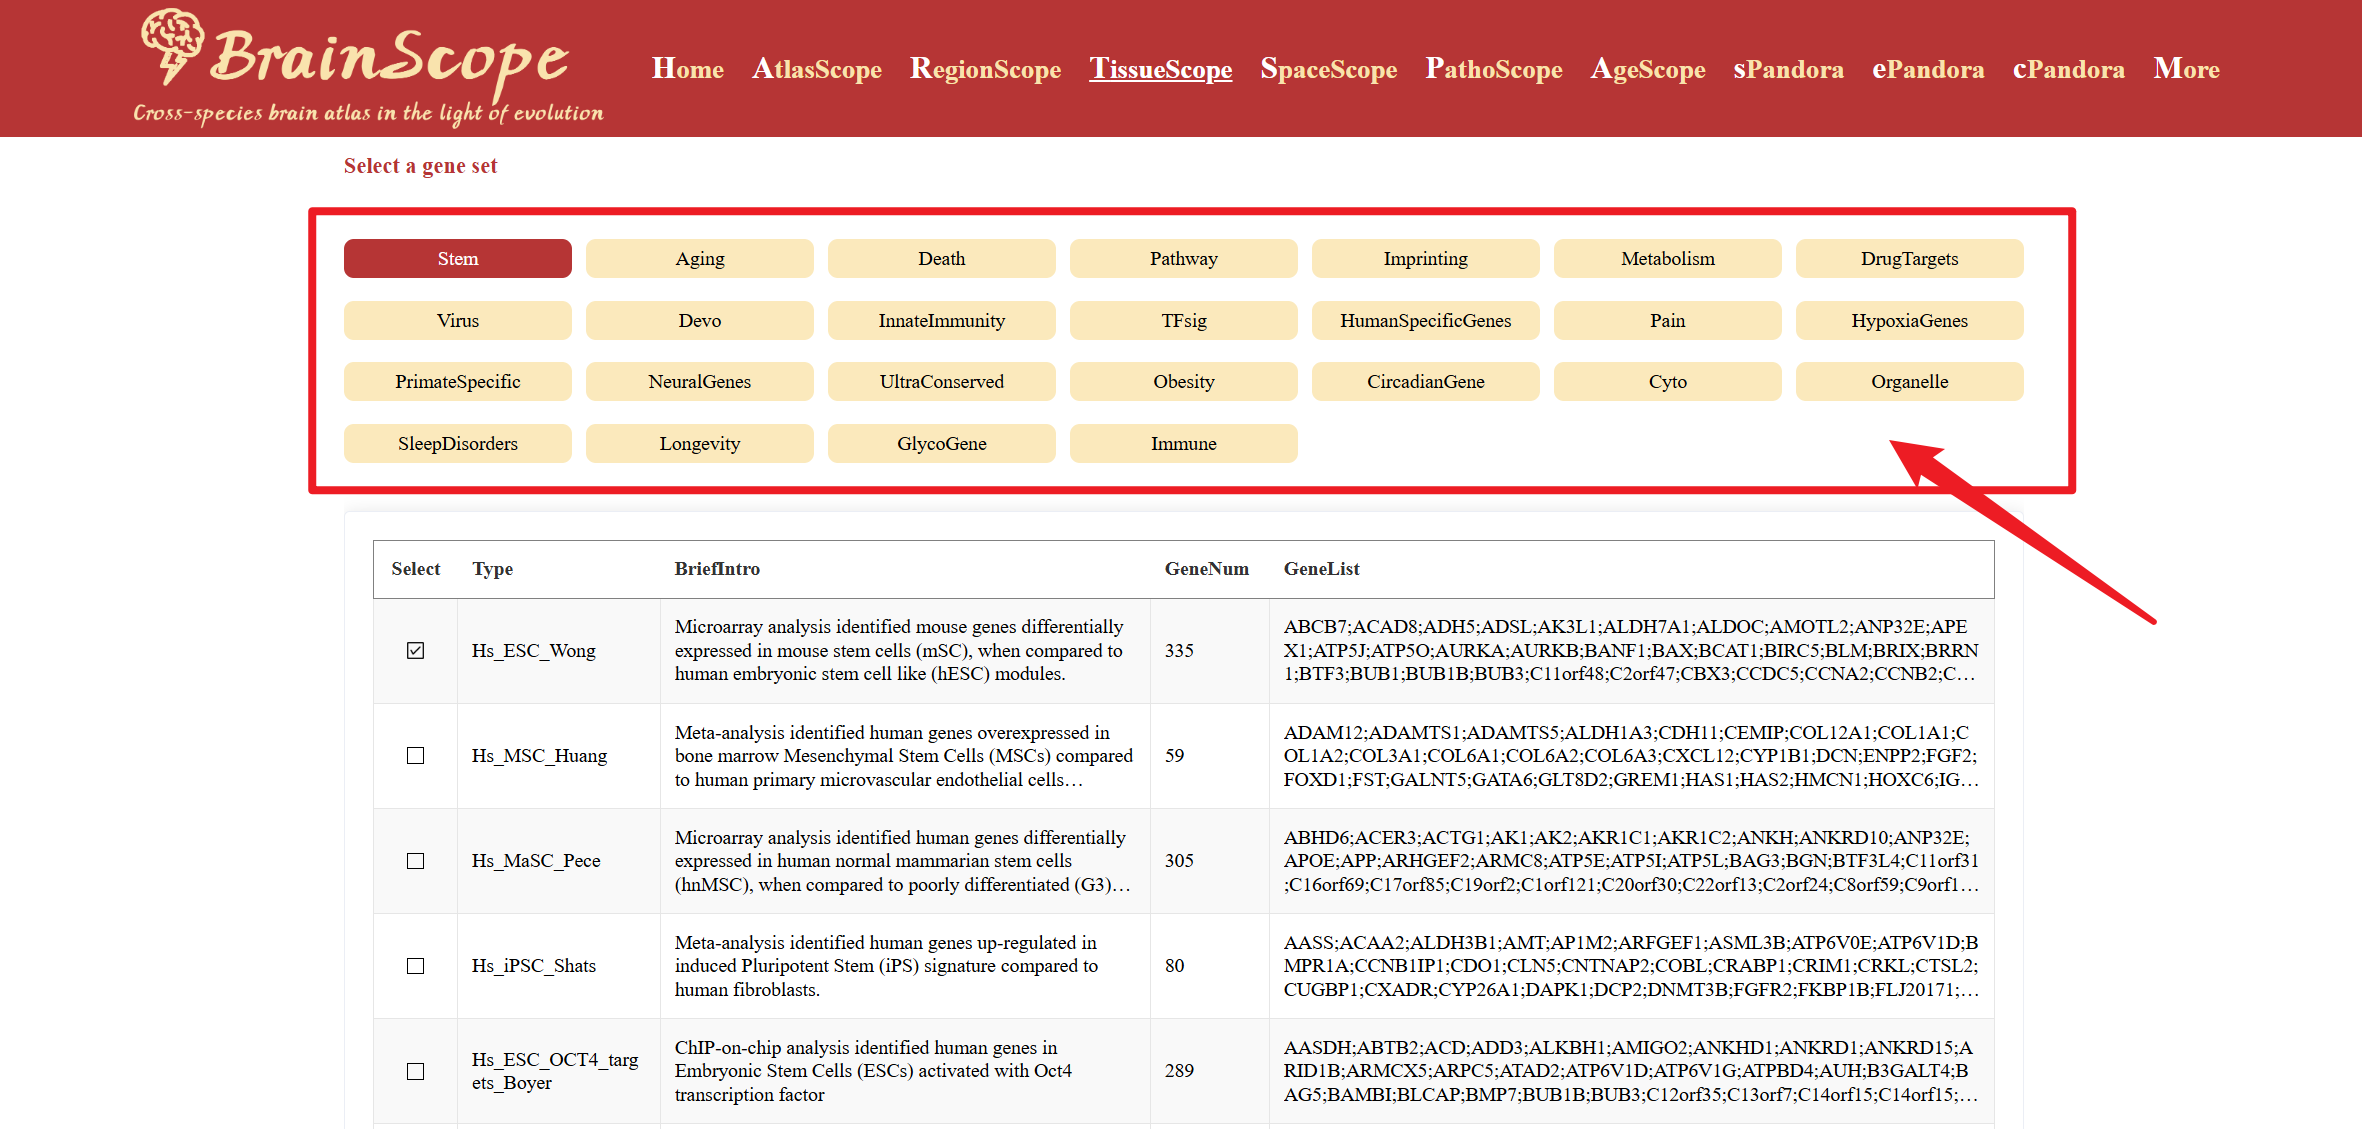
After you select a category, a table will appear, listing multiple gene lists related to the selected category. Check the boxes for gene lists of interest to explore their expression patterns.
A heatmap will be generated, showing the expression levels of the selected gene lists across species. Users can download the heatmap visualization in different formats above the heatmap by clicking the download buttons.
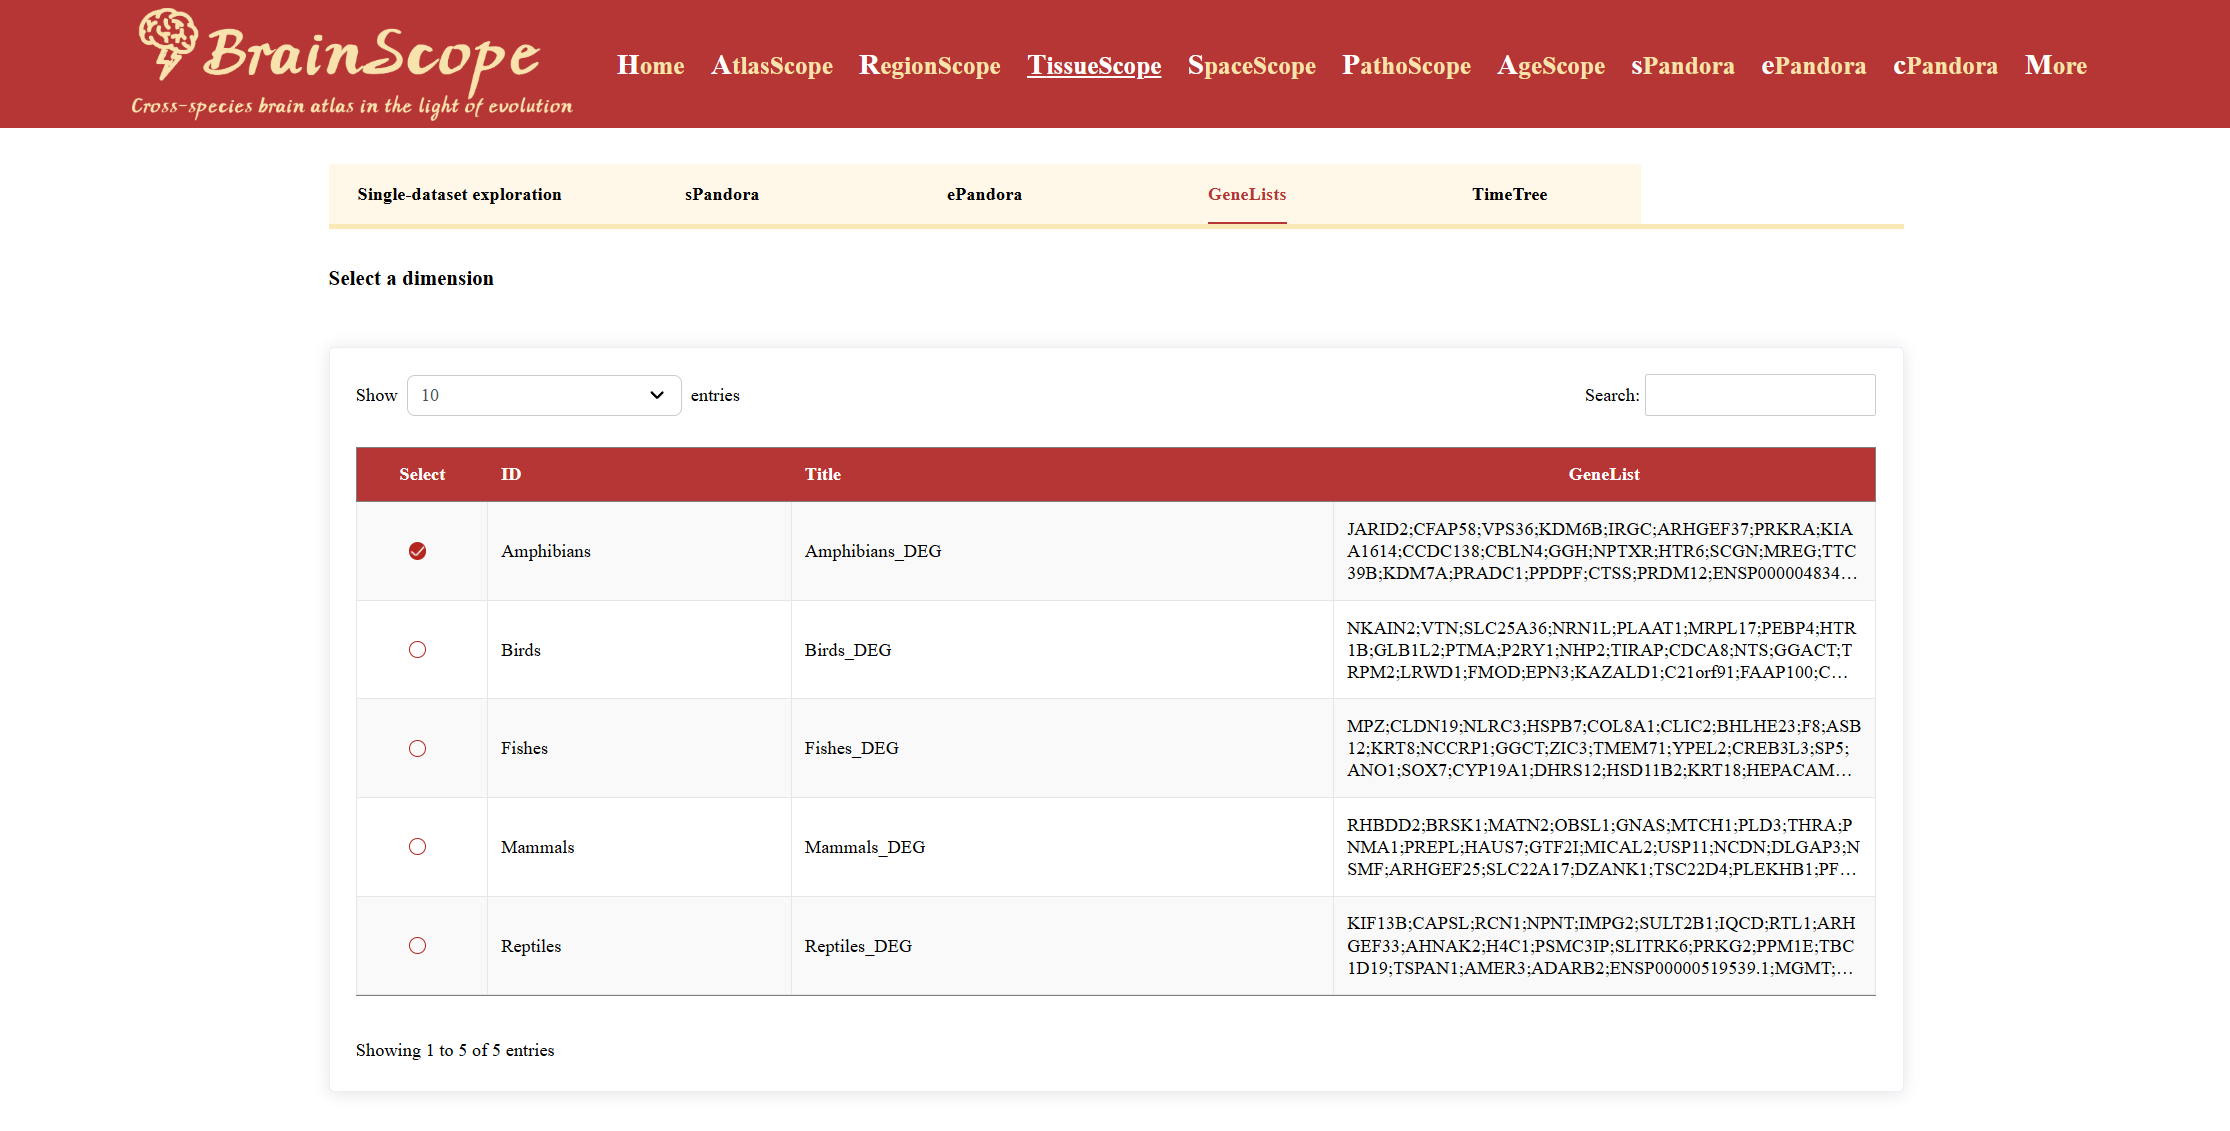
GeneLists
The GeneLists module provides a structured way to explore differentially expressed genes (DEGs) across five major vertebrates.
Check the box next to the animal group of interest to explore its DEGs.
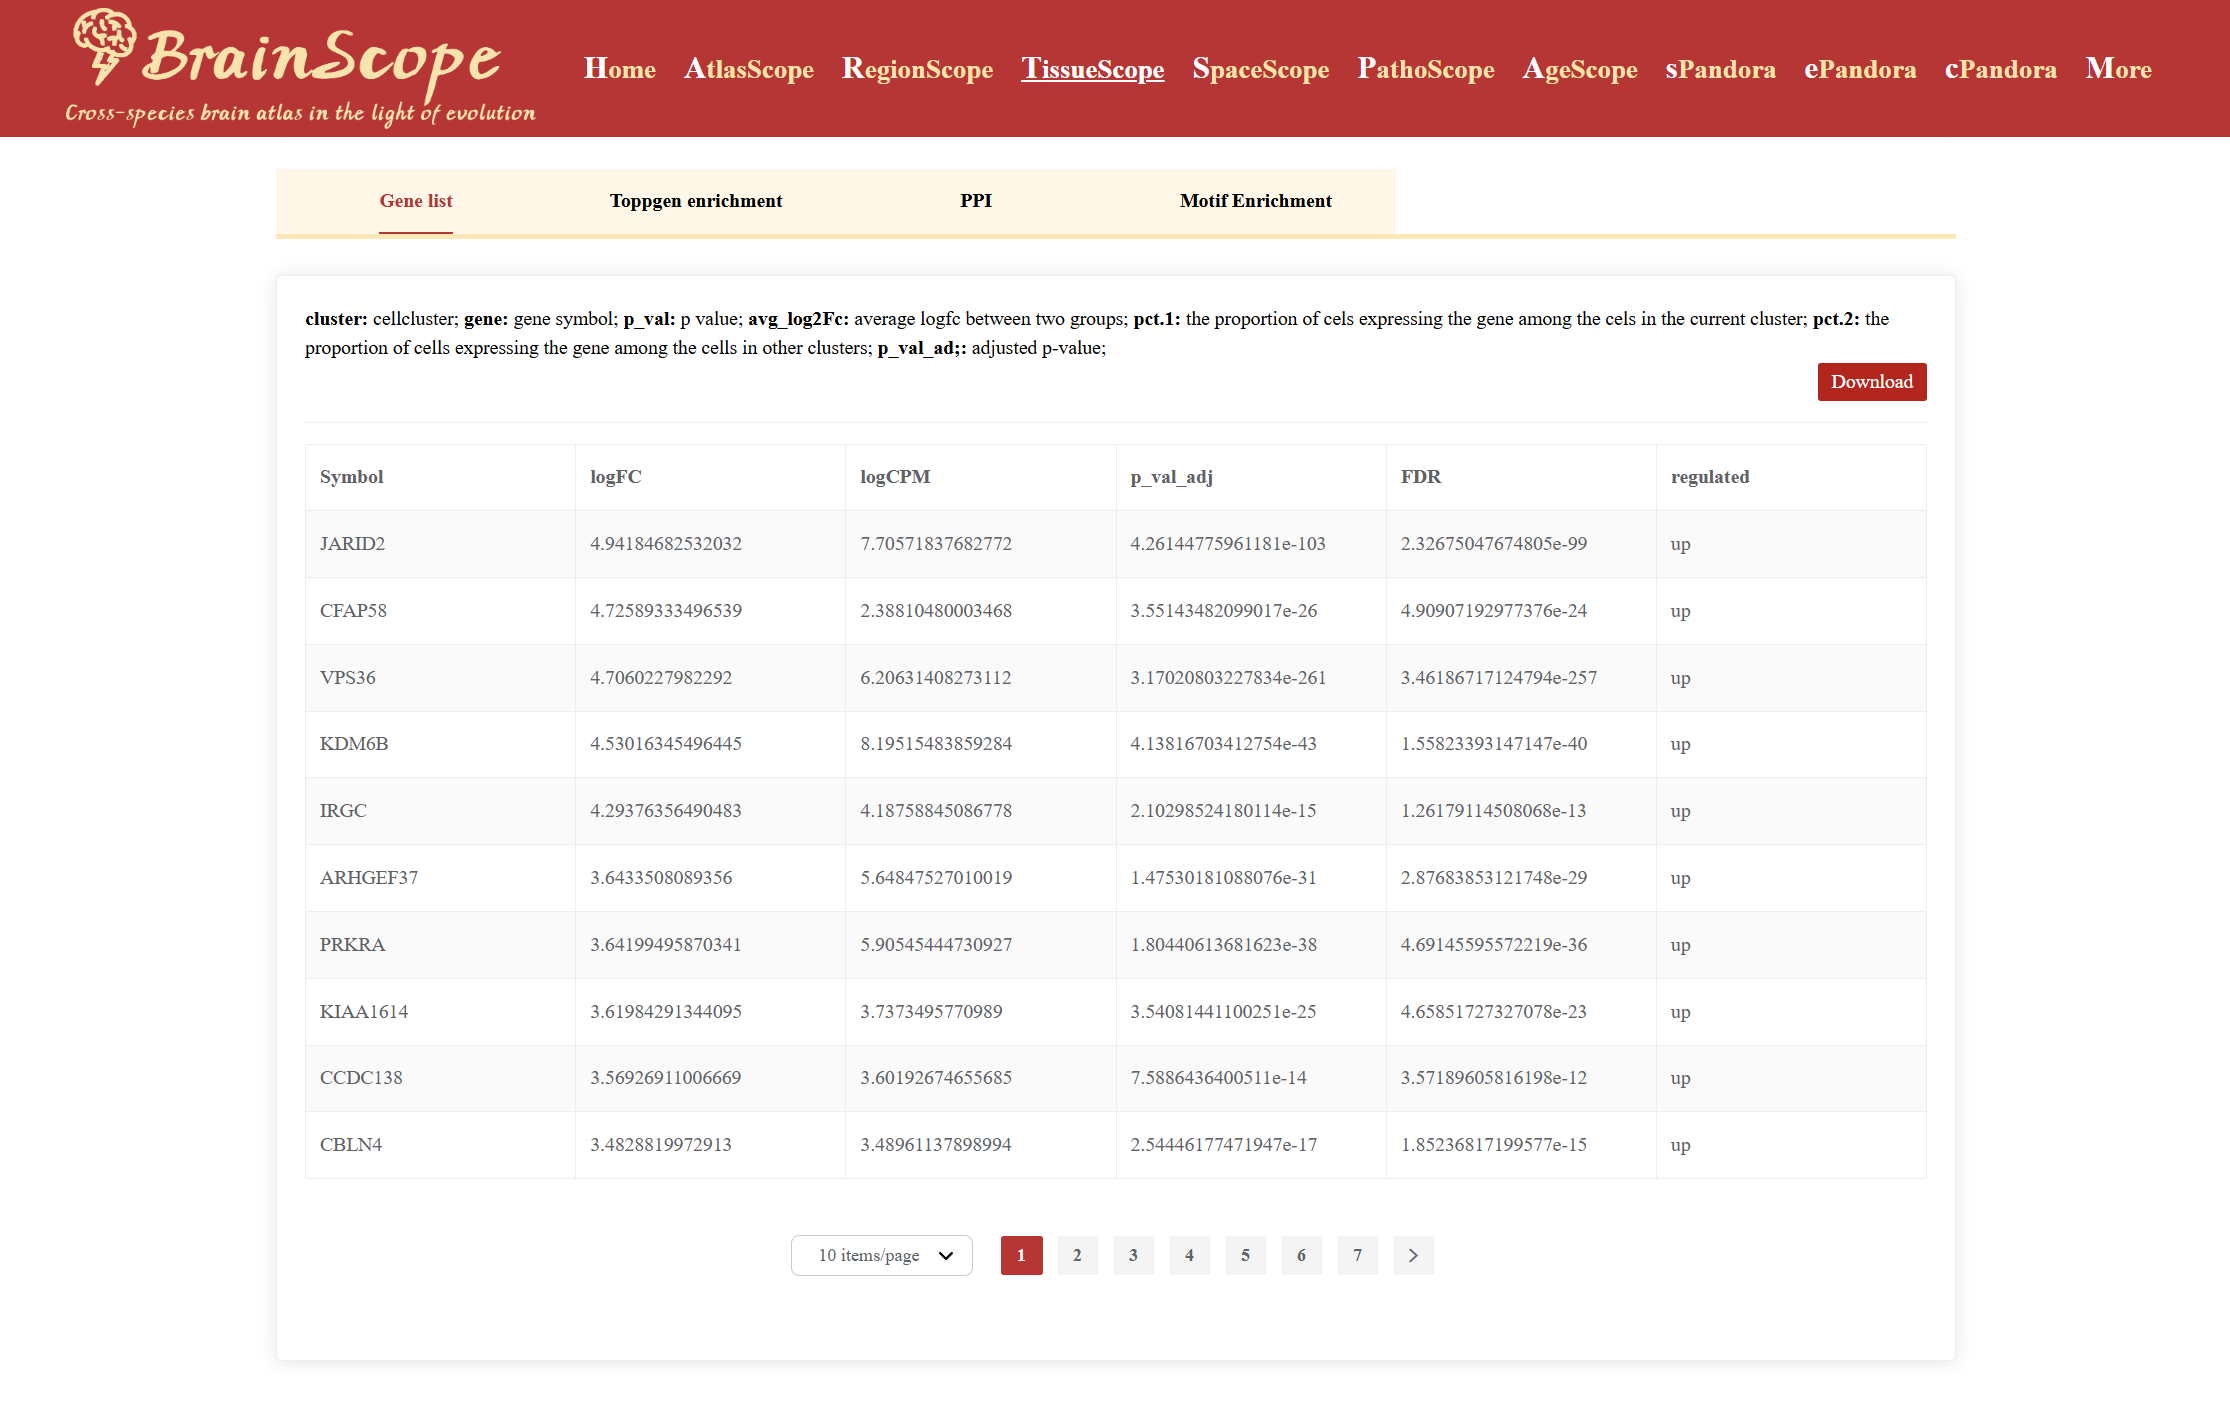
A table will appear, displaying detailed information on differentially expressed genes, including Gene name, Log fold-change (logFC), Log count per million (logCPM), Adjusted p-value, False Discovery Rate (FDR), Upregulated or downregulated status.
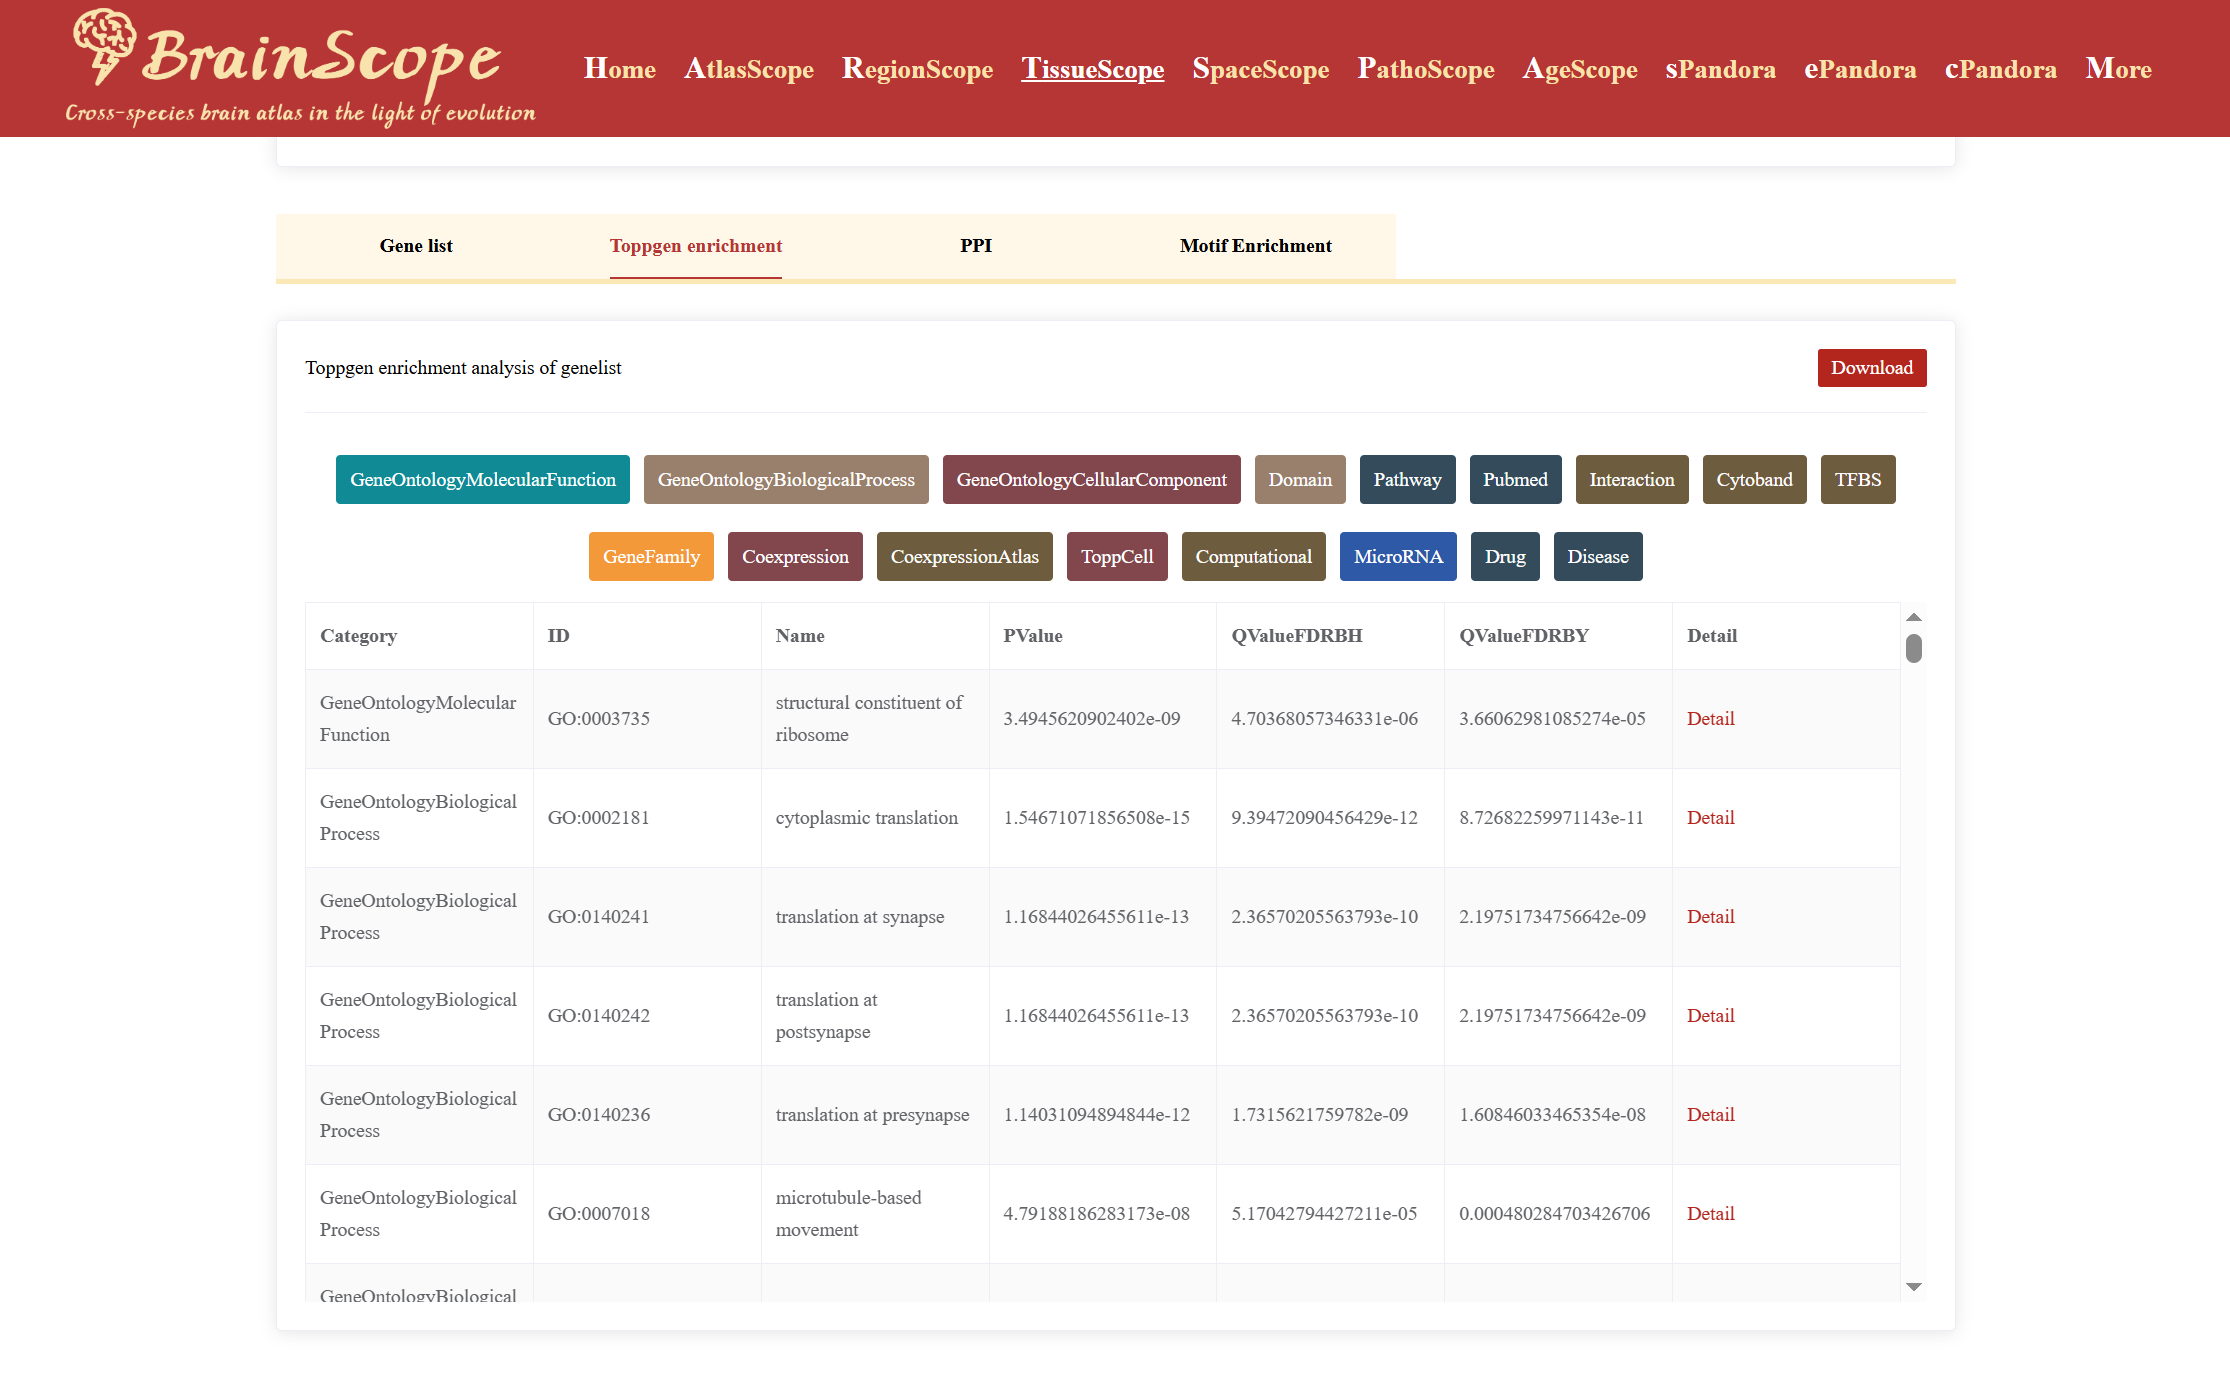
Beyond DEG identification, the module offers functional enrichment analyses, including: ToppGene Enrichment Analysis, PPI (Protein-Protein Interaction) Analysis.
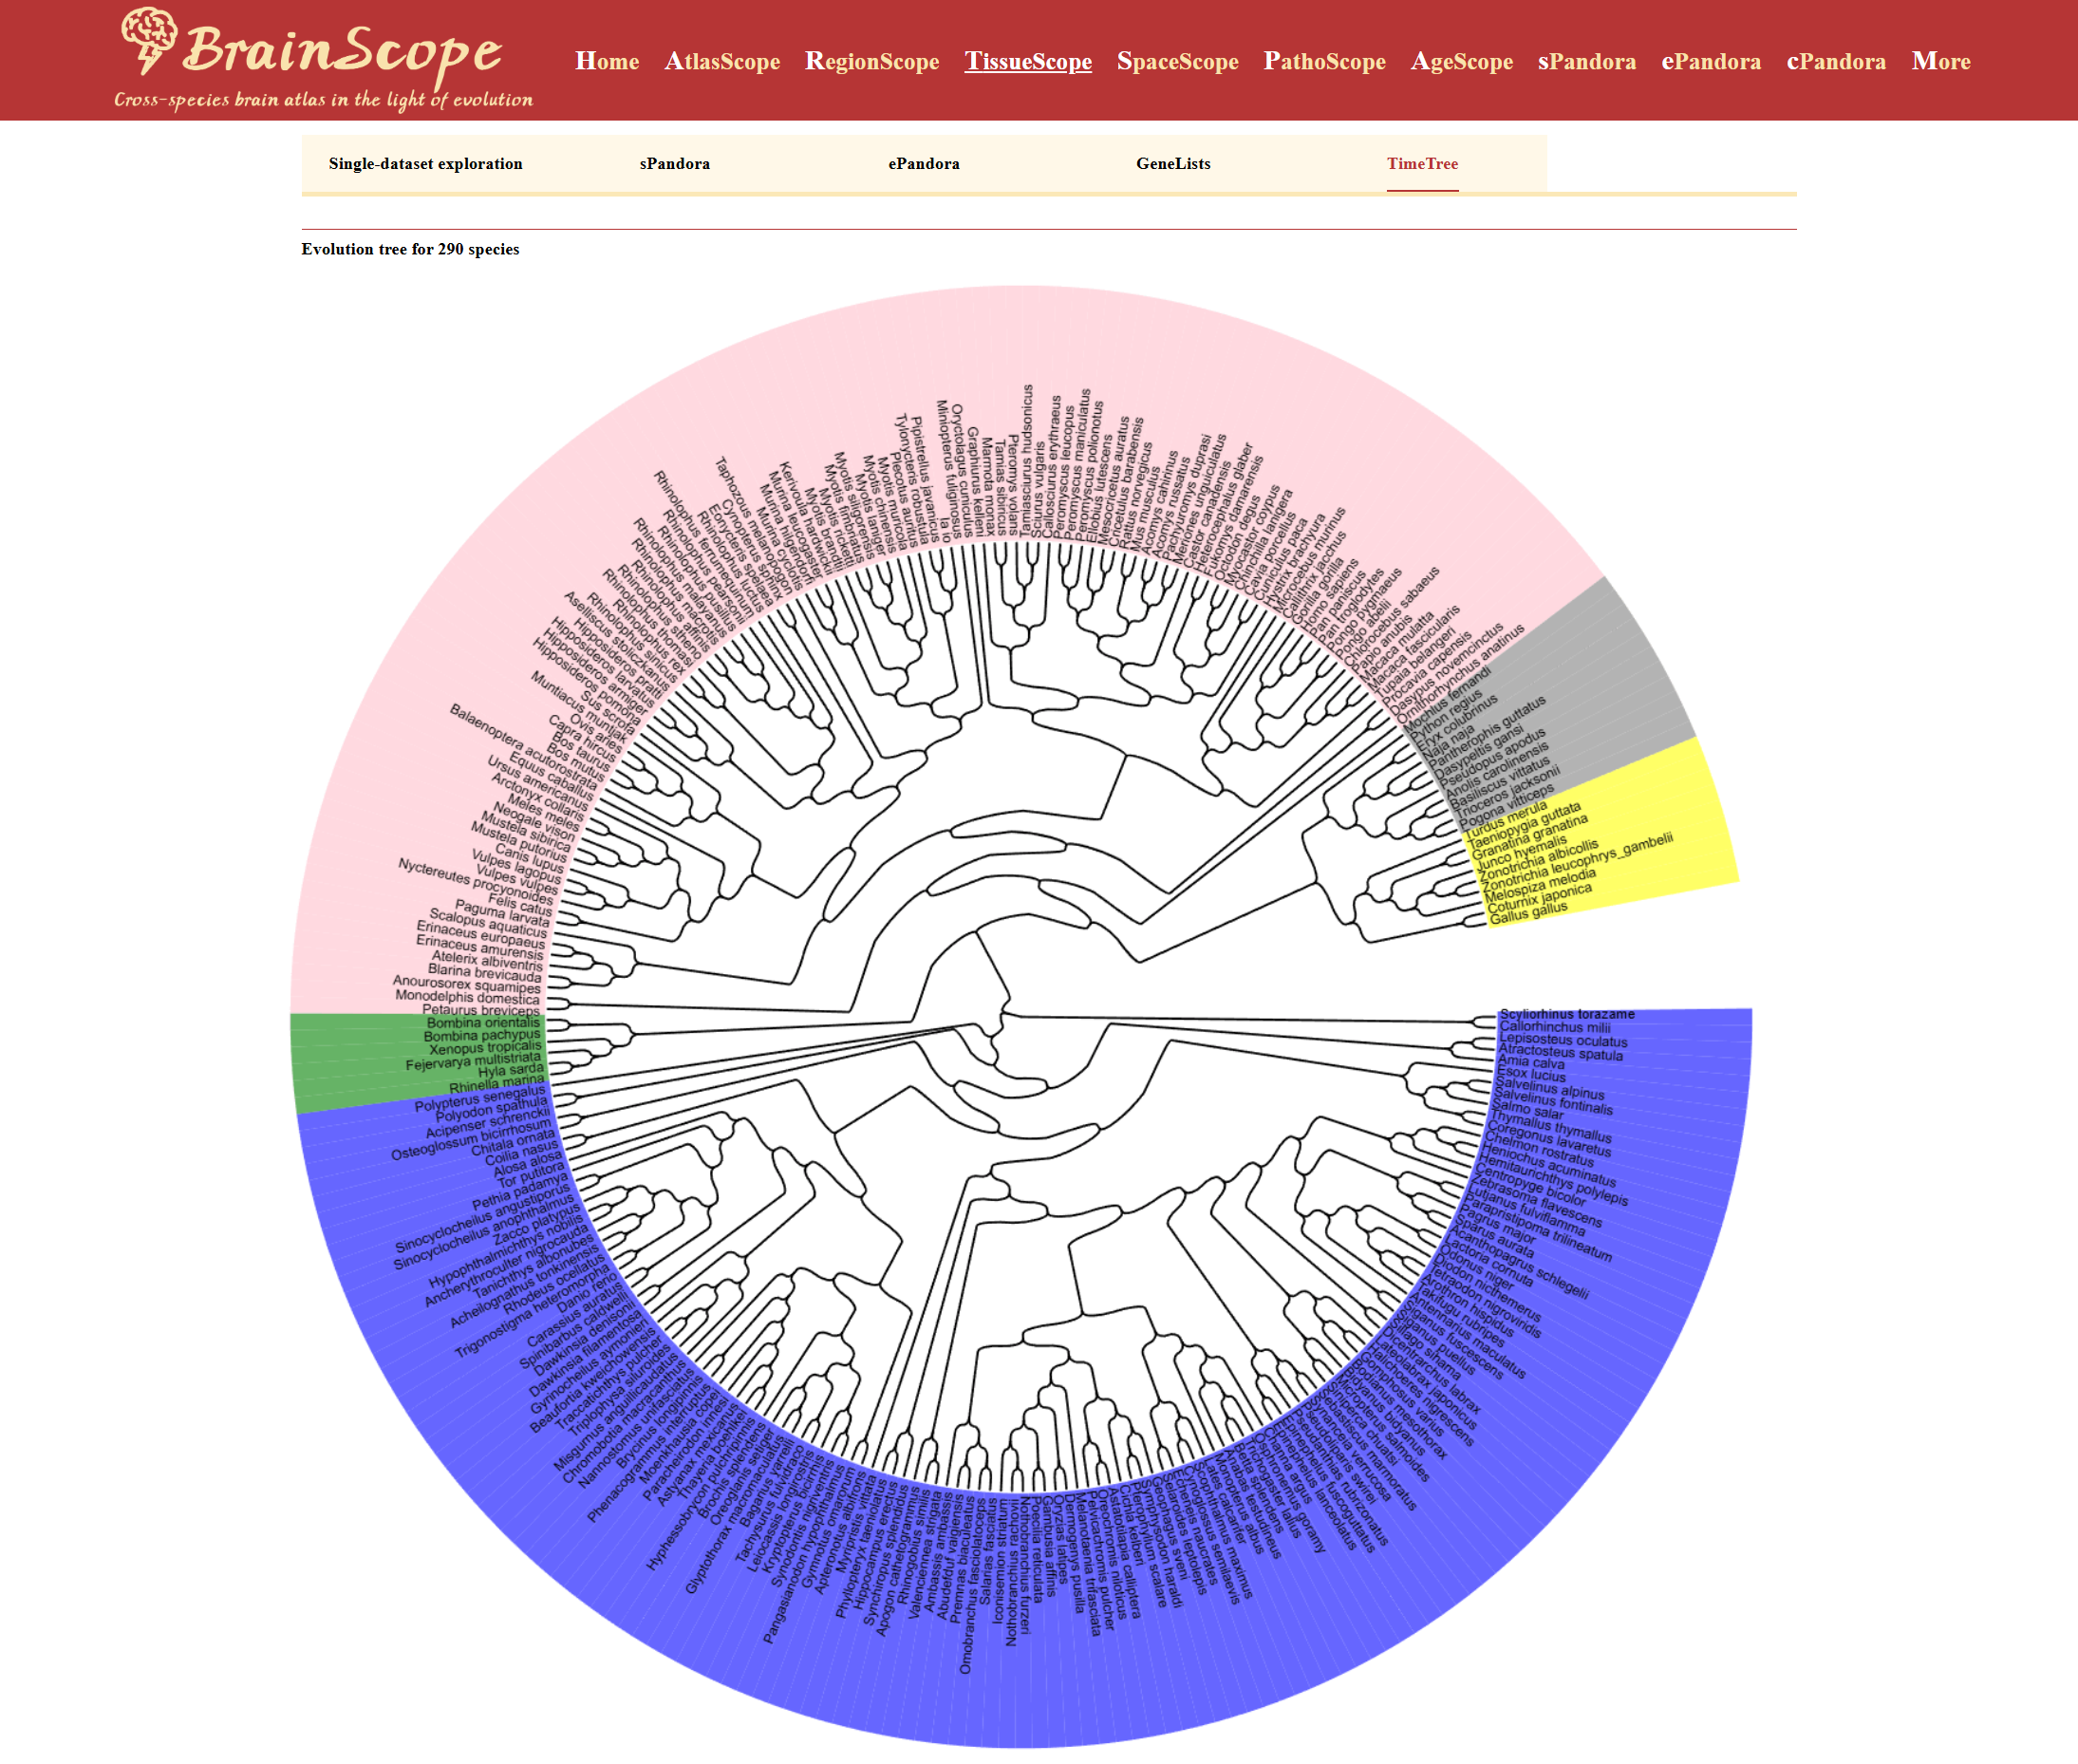
TimeTree
TimeTree provides users with an evolutionary perspective by displaying the phylogenetic relationships among species included in the BrainScope database. This visualization helps researchers understand the evolutionary distances and divergence times between species, facilitating comparative transcriptomic analyses.