AtlasScope is a cross-species single-cell brain atlas designed for comparative transcriptomic analysis across diverse species. It provides insights into the variation of gene expression, gene sets, and cell-type distributions across evolutionary lineages. The dataset includes 118.7 million cells spanning 42 mammals, 10 birds, 7 reptiles, 4 amphibians, 46 fishes and 26 invertebrates, offering a comprehensive resource for studying brain evolution at the molecular and cellular levels.
AtlasScope offers four functional modules: sPandora (PAN DimensiOnal Rapid Analyzer for a single gene) allows users to explore the expression of individual genes across species; ePandora (PAN DimensiOnal Rapid Analyzer for an entire gene list) enables the investigation of curated gene sets from 28 different categories across various species; cPandora (PAN DimensiOnal Rapid Analyzer for a cell type) facilitates the comparison of cell-type proportions across species using stacked bar charts; and GeneLists provides differentially expressed gene lists for specific cell types, supporting enrichment analysis and functional exploration.
Single-Data Exploration
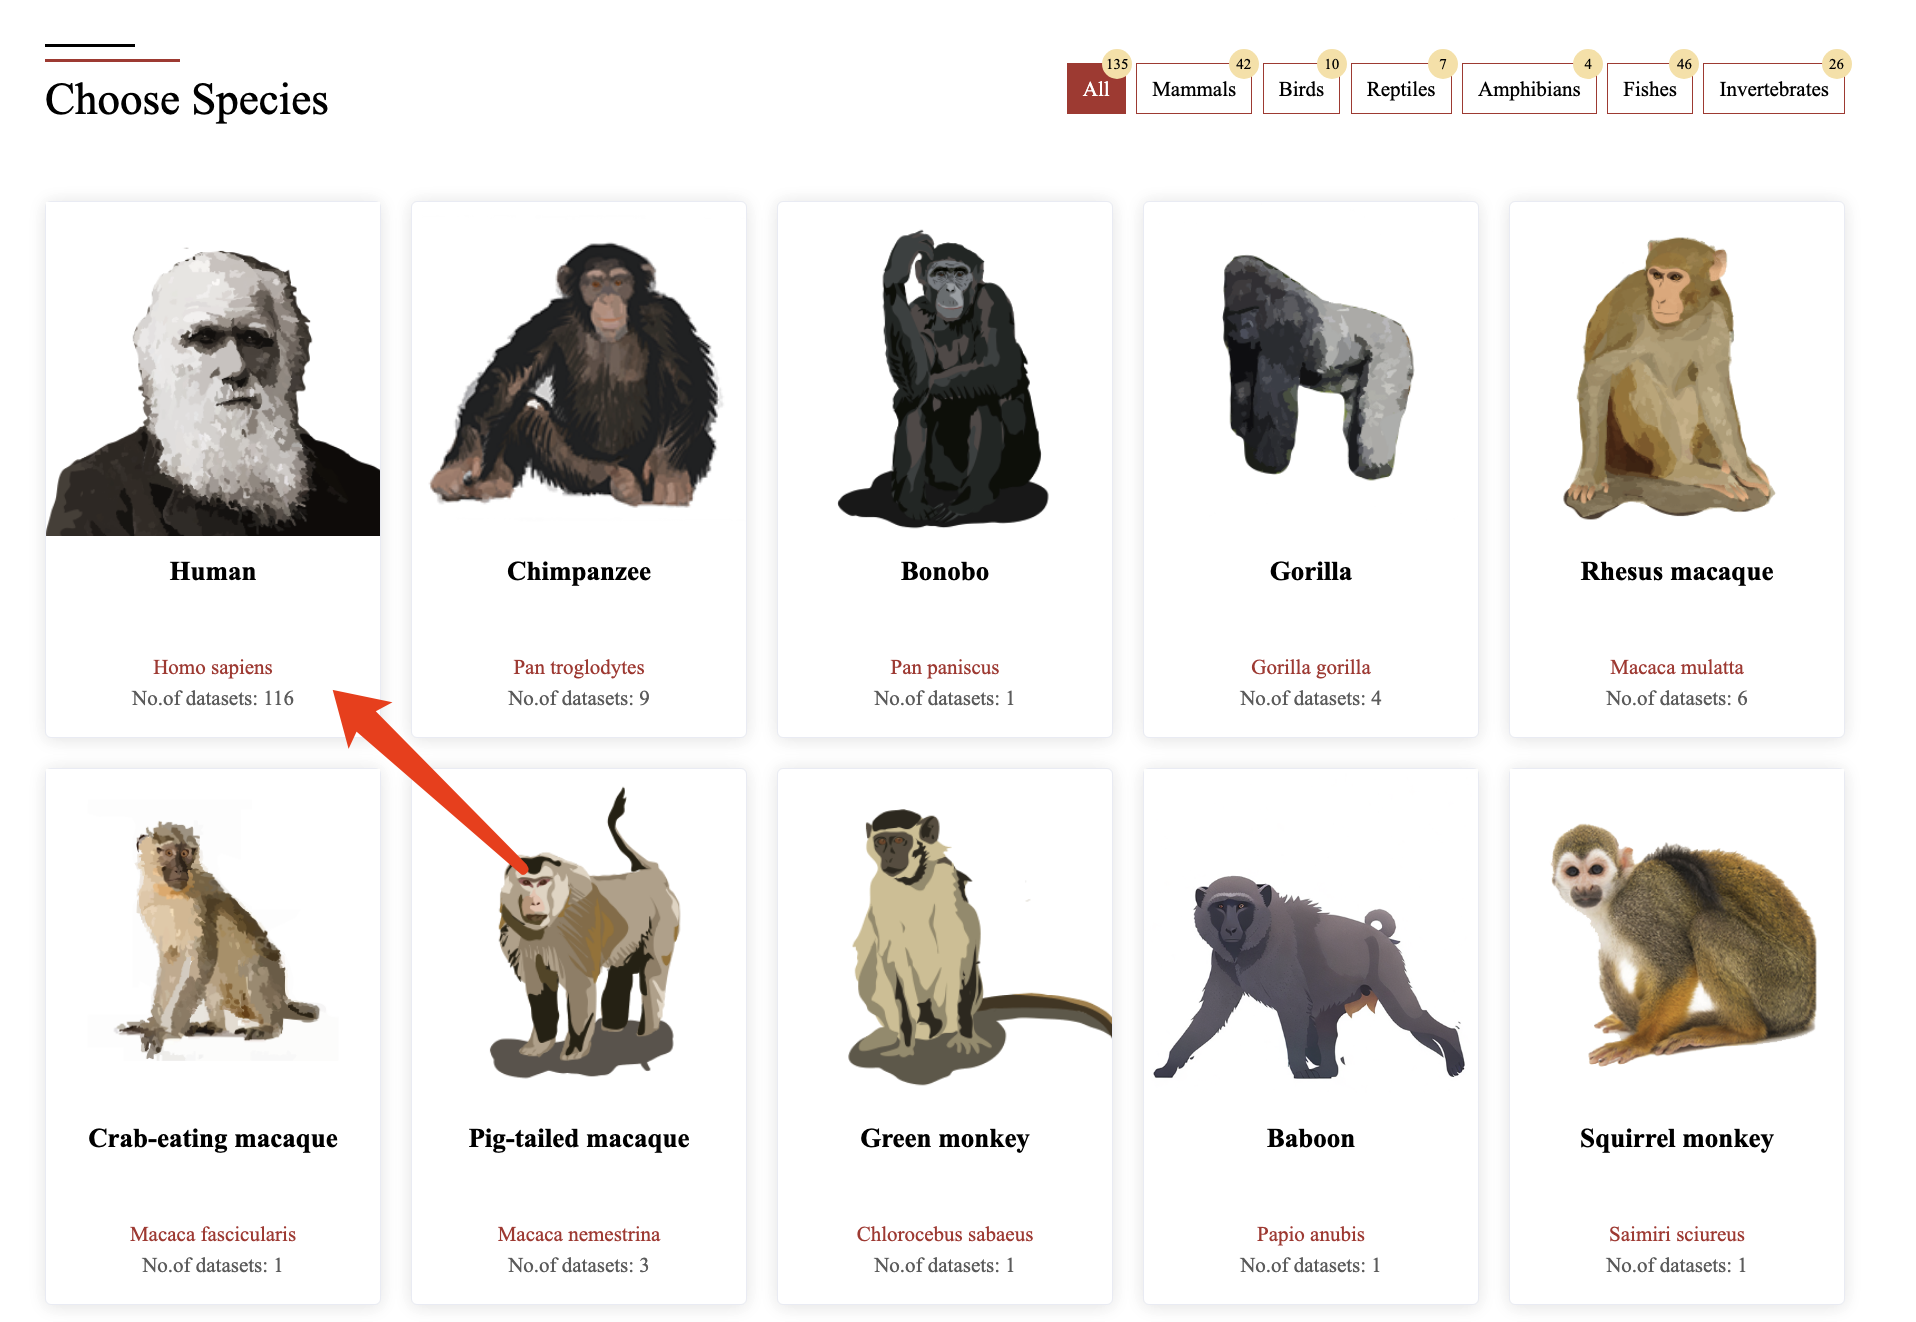
Users can explore brain single-cell sequencing data for species of interest at Single-dataset exploration.
Users can explore the data of species of interest in two ways:
1. Filter Selection – Use the filter panel to select specific species.

2. Clicking Species Images – Click on an image of the species of interest to access its brain single-cell datasets.
Once users have selected their dataset of interest, the results will be displayed in a table format, providing essential dataset information including:
BSID: The unique identifier of the dataset within our database.
CommonName: The common name of the species from which the data was derived.
Region: The specific brain region where the data was collected.
Timing: The developmental stage at the time of data collection.
Diseases: The health condition of the sample (e.g., normal or disease-specific).
Tech: The sequencing technology used for data generation.
Journal: The source journal in which the dataset was published.
PMID: The PubMed ID corresponding to the publication associated with the dataset.
Year: The publication year of the dataset’s reference article.
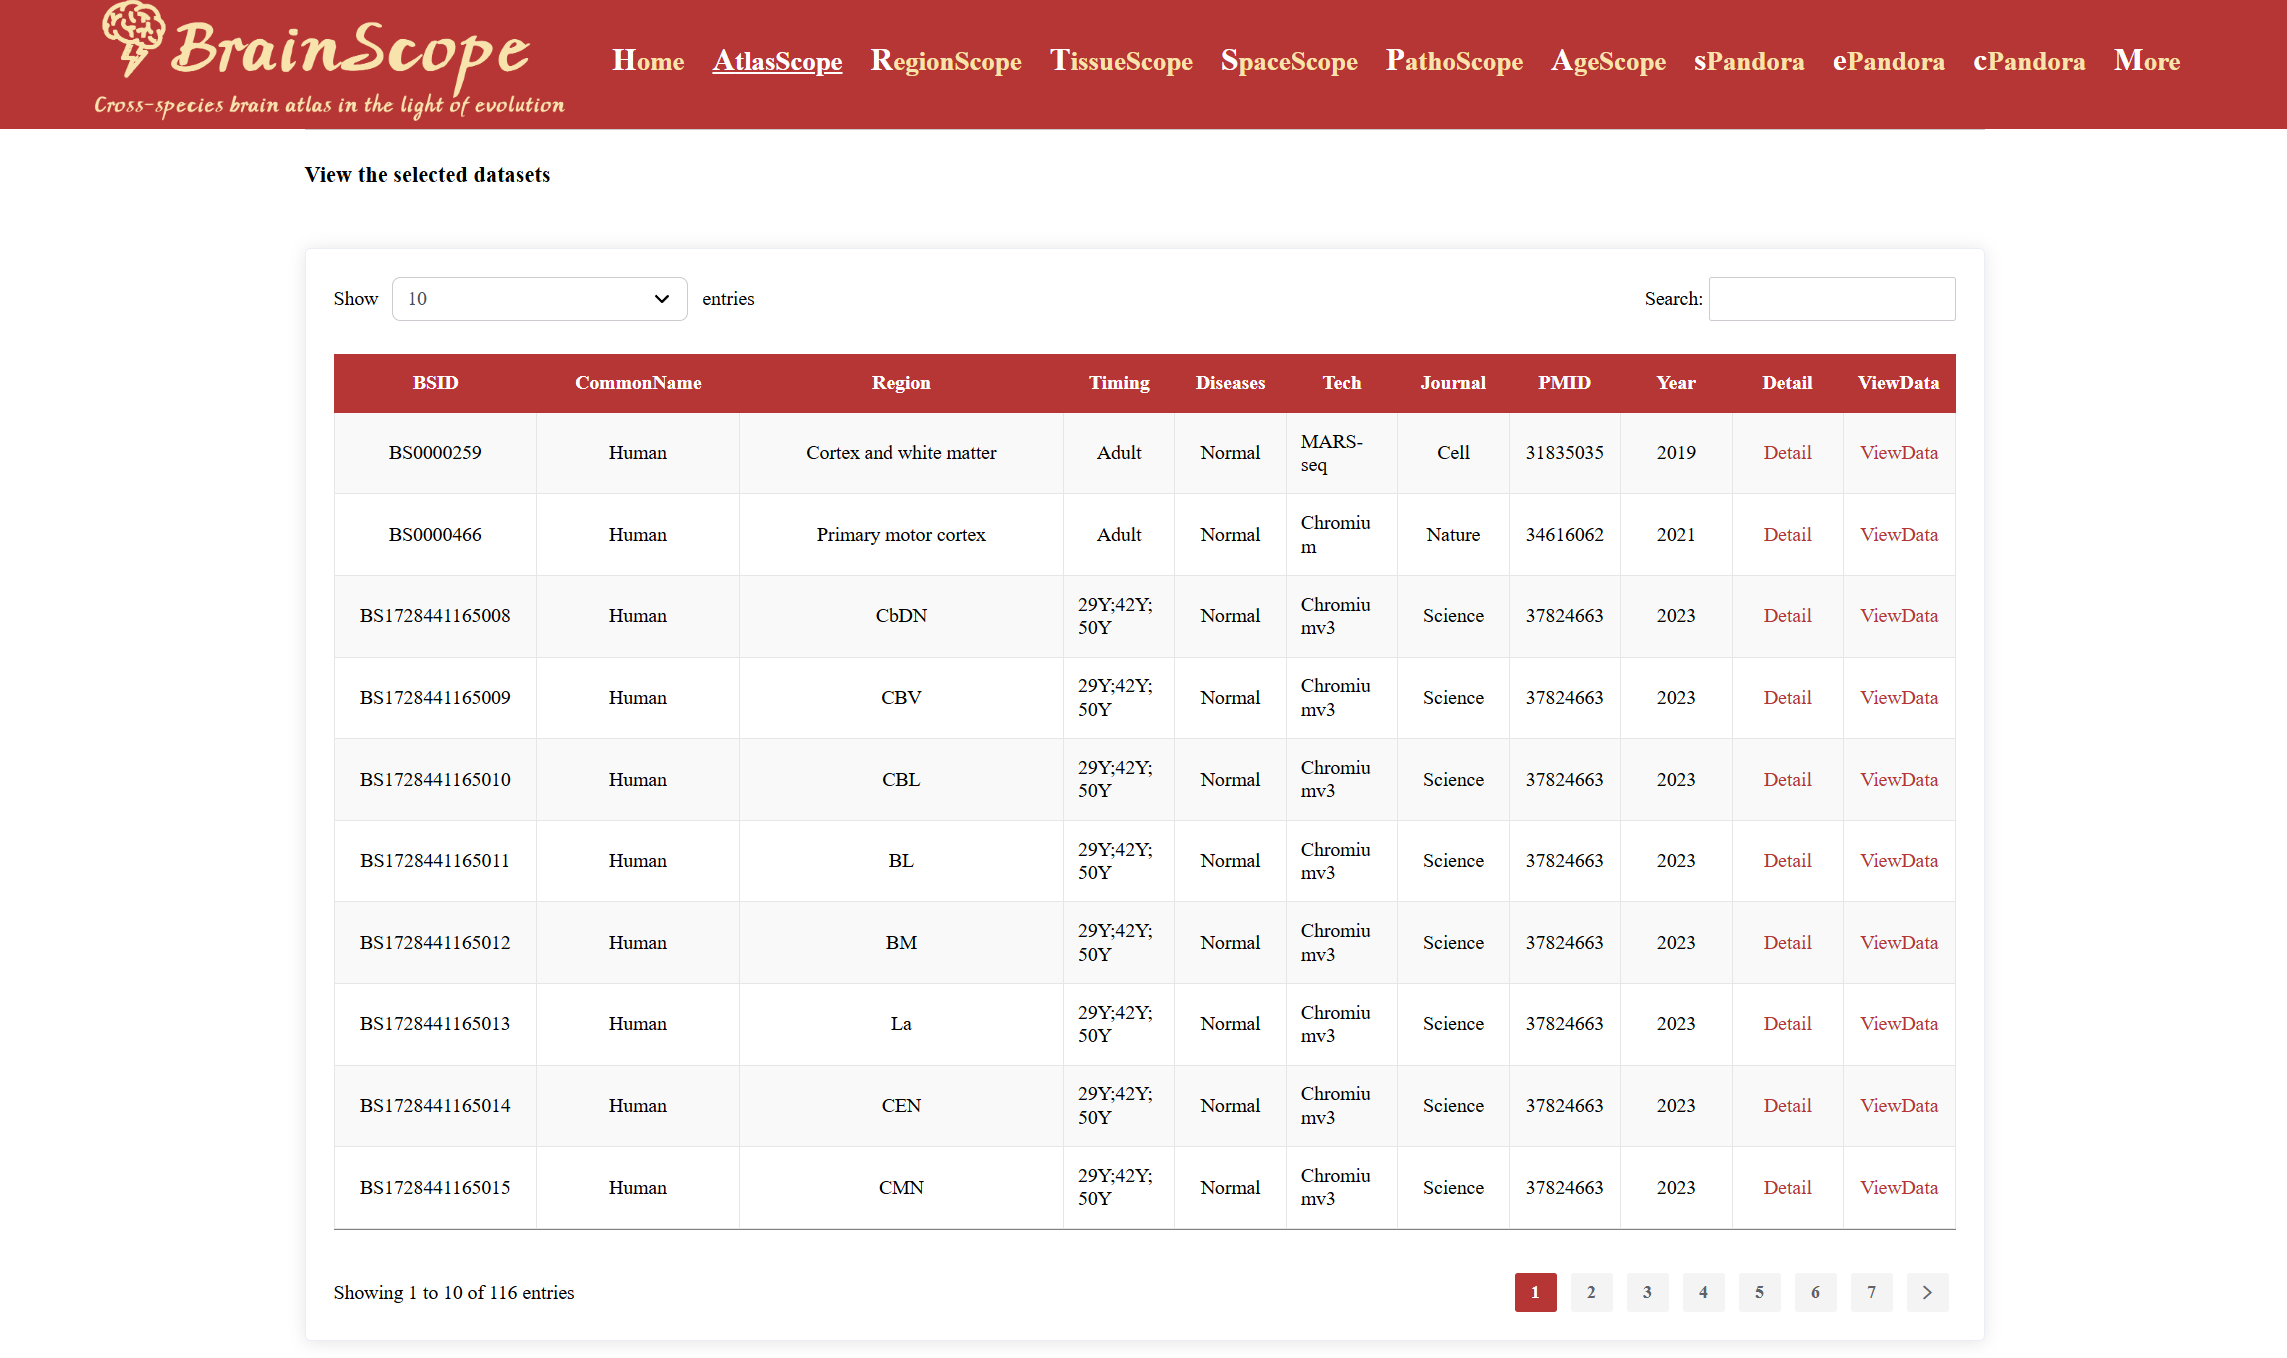
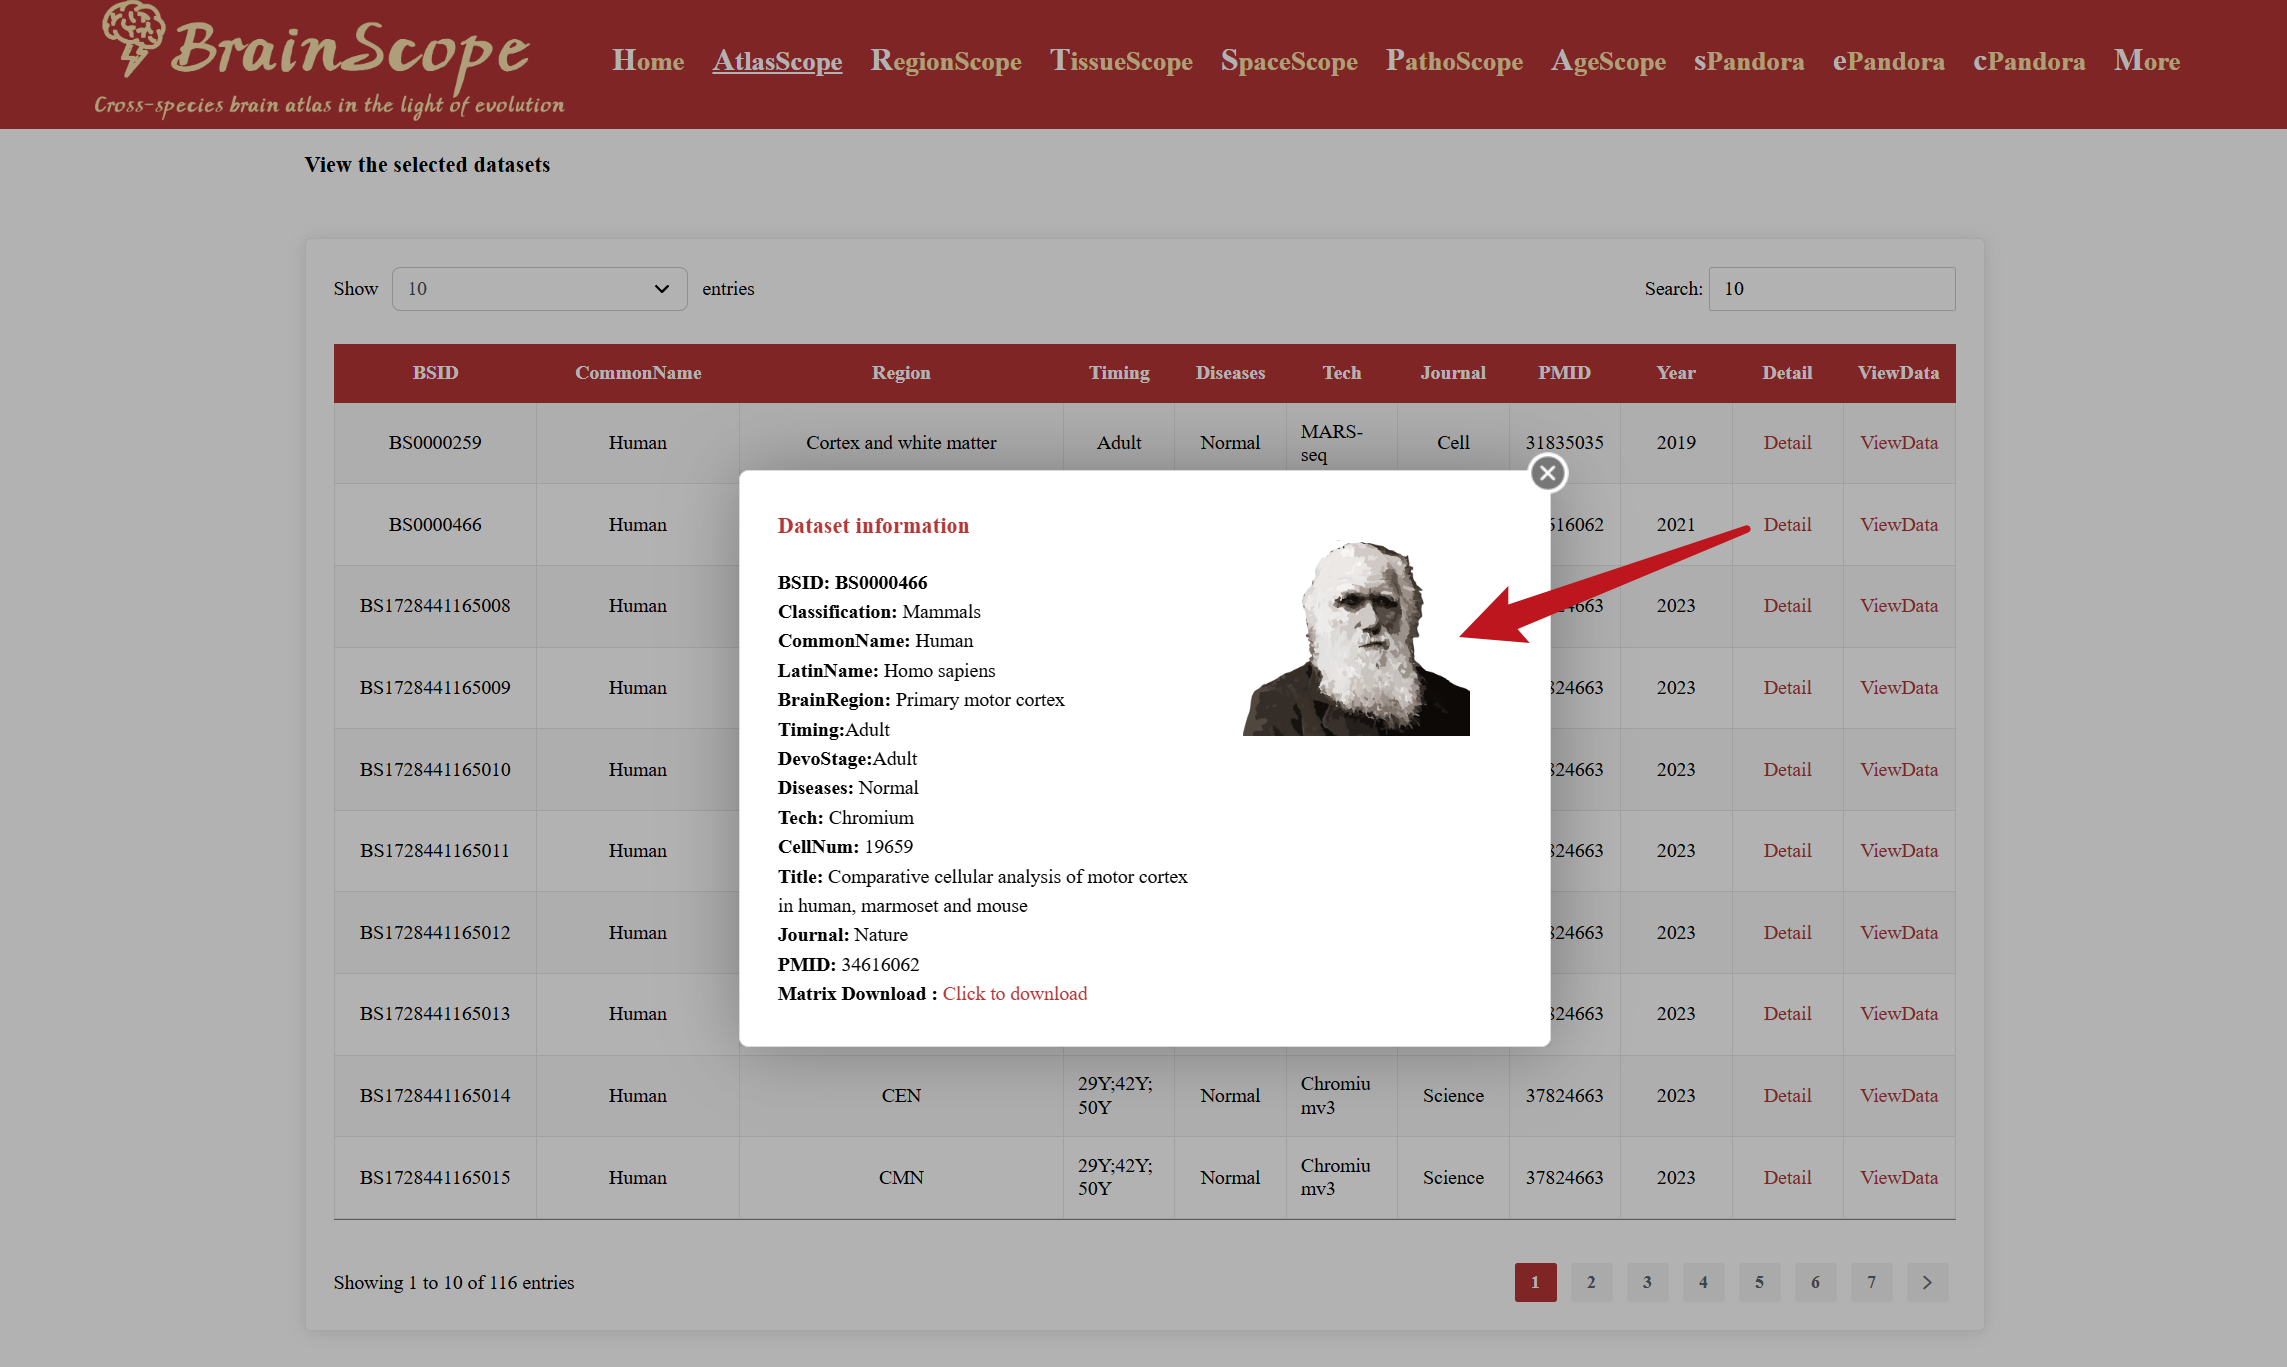
Click “Detail” – View basic dataset information and download the single-cell expression matrix.
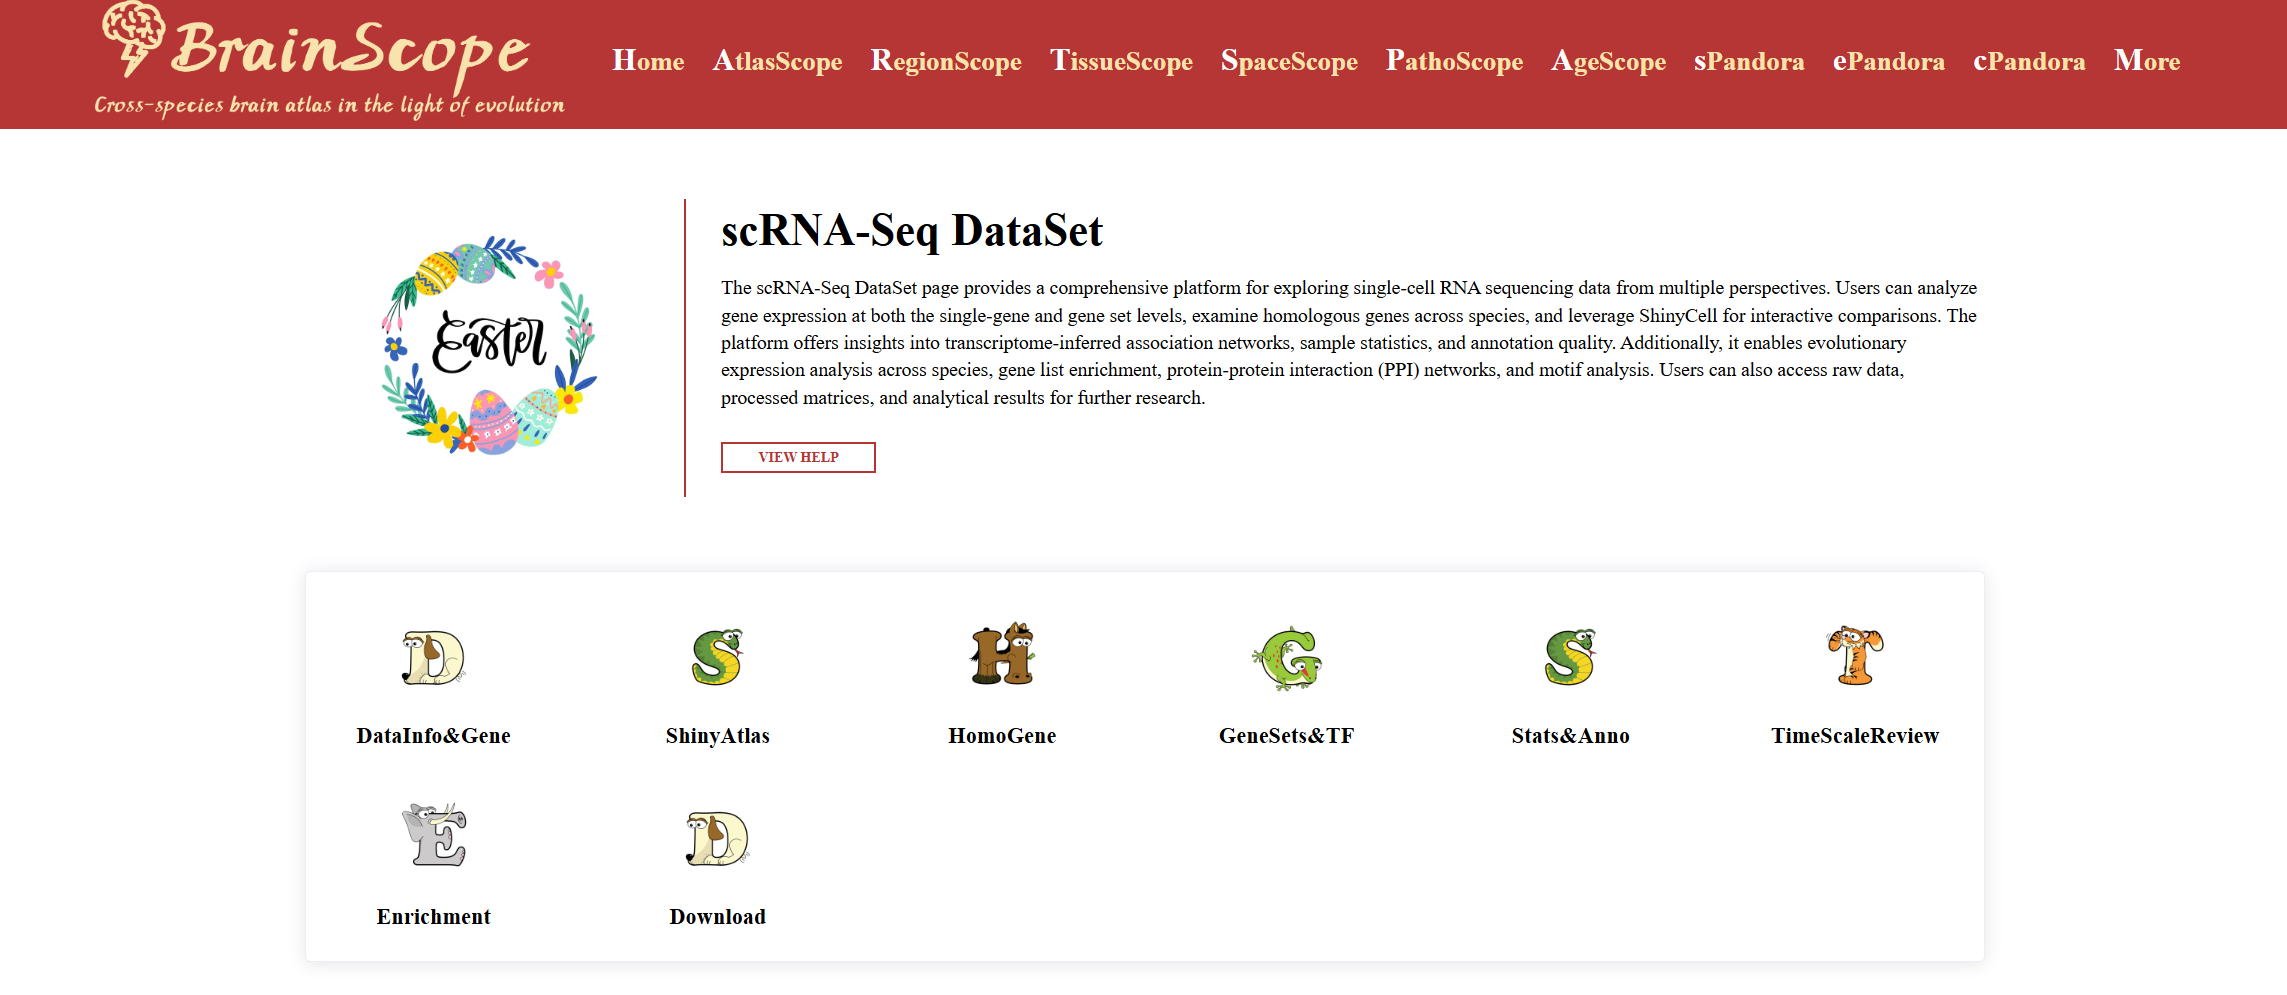
Click “ViewData” – Access the scRNA-Seq DataSet page for deeper exploration of the selected dataset.
sPandora
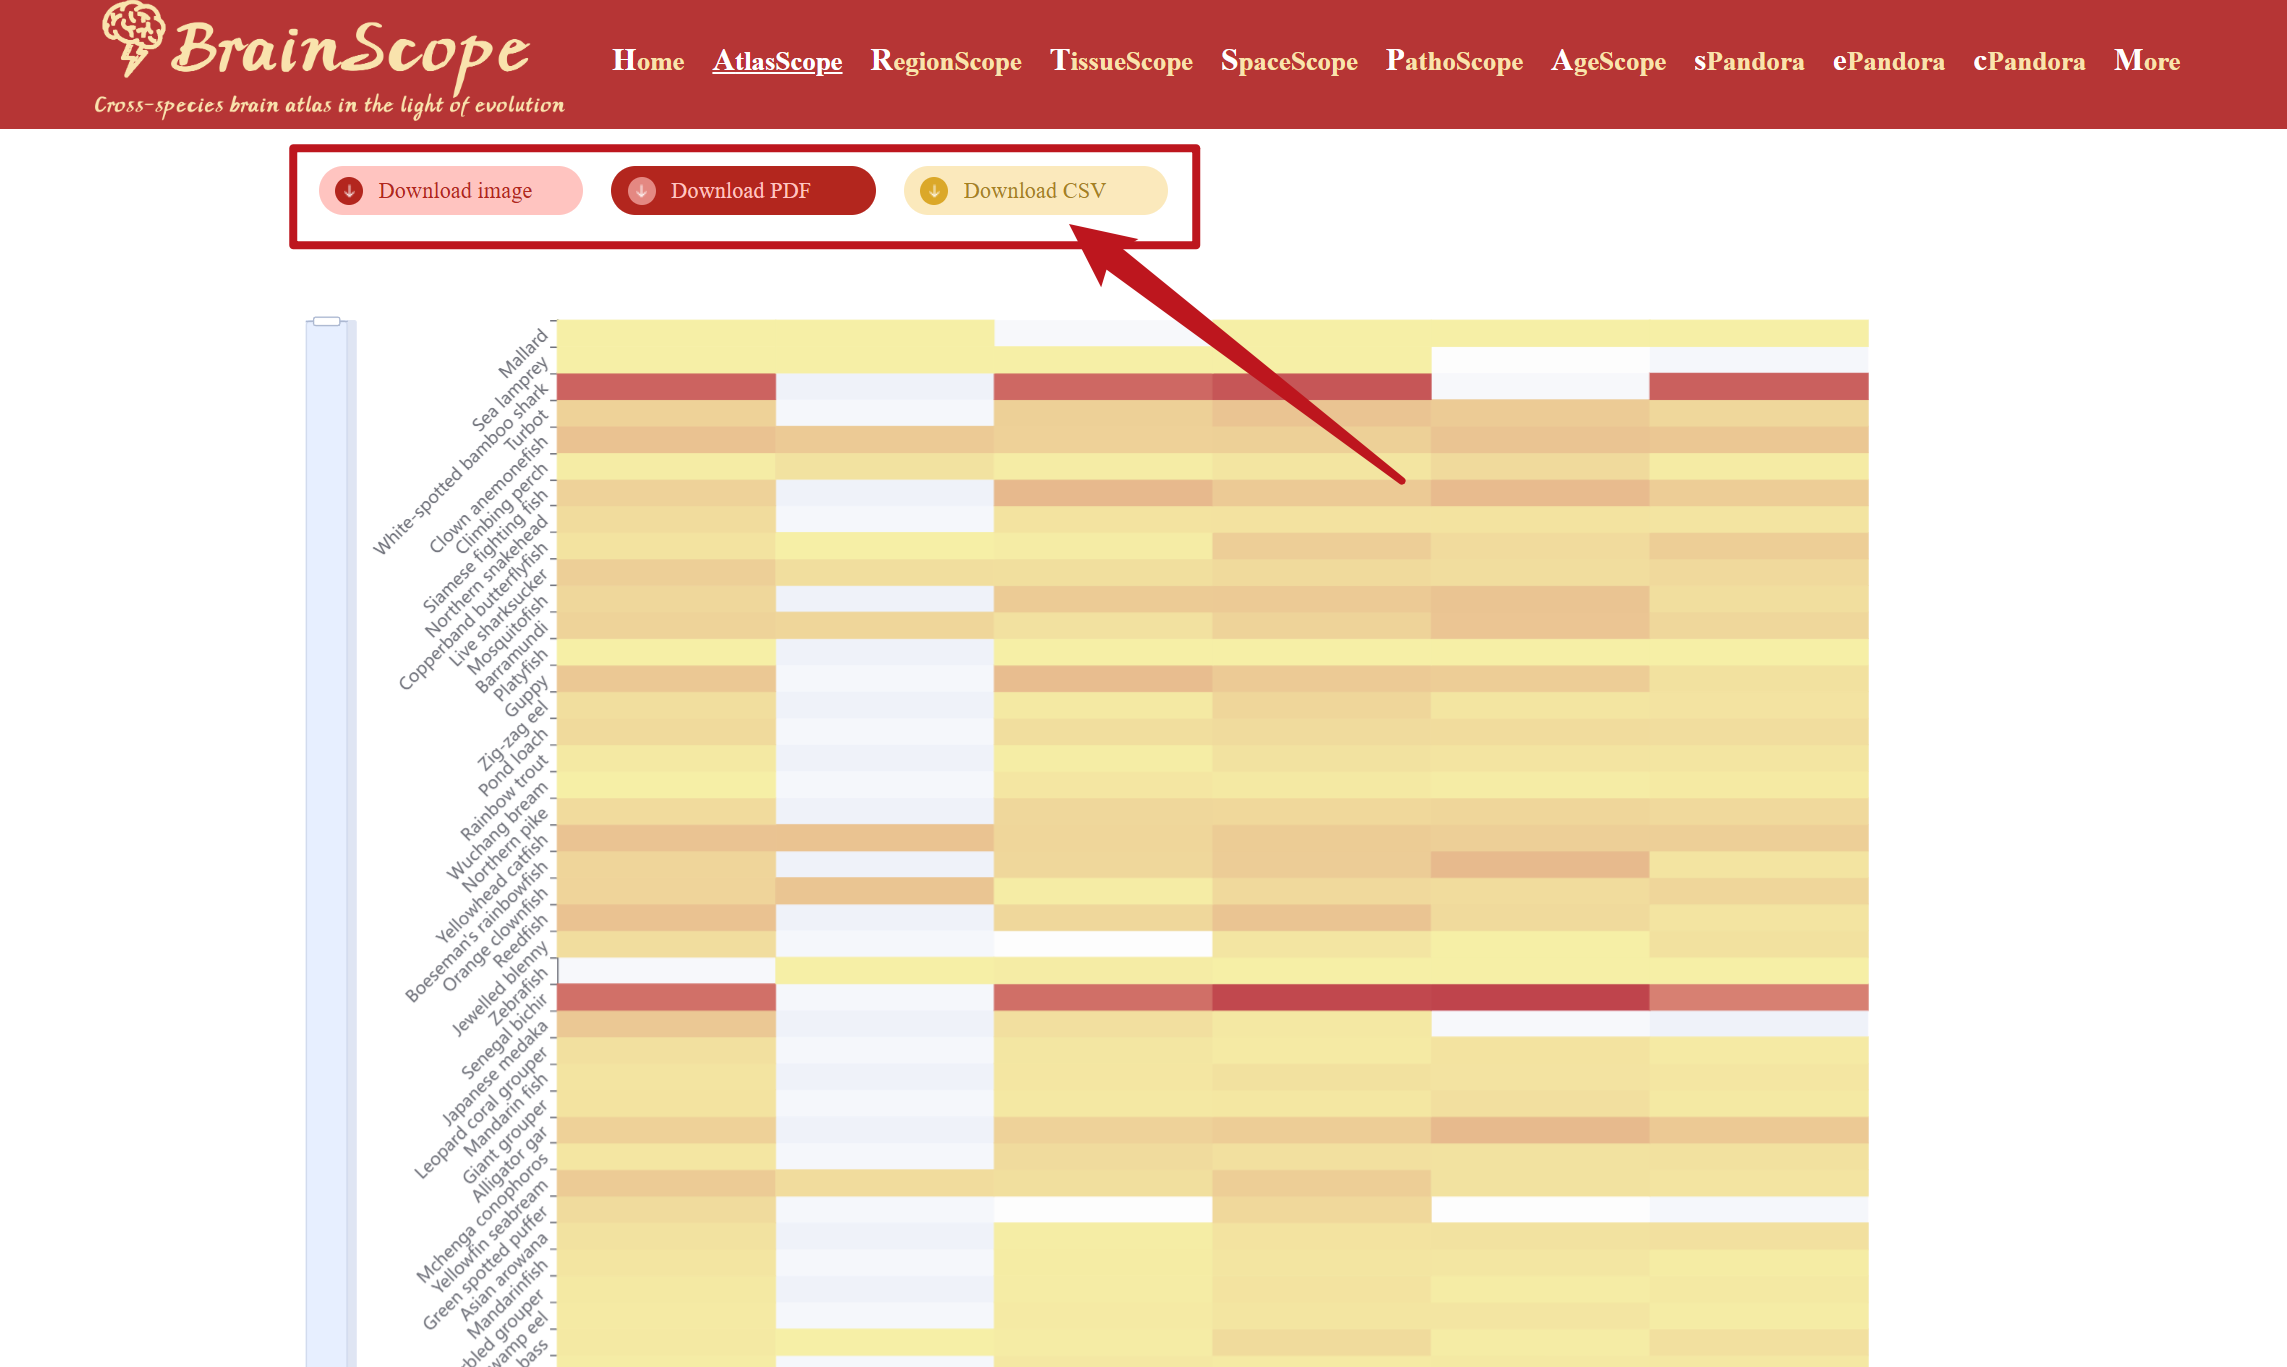
sPandora in AtlasScope allows users to explore the expression of a single gene across multiple species and brain cell types. This tool helps researchers explore distribution across various species' brain samples in a heatmap visualization format. Click on the drop-down menu under the SGPDA to type or scroll to find the gene of interest. Click the gene to generate the heatmap.
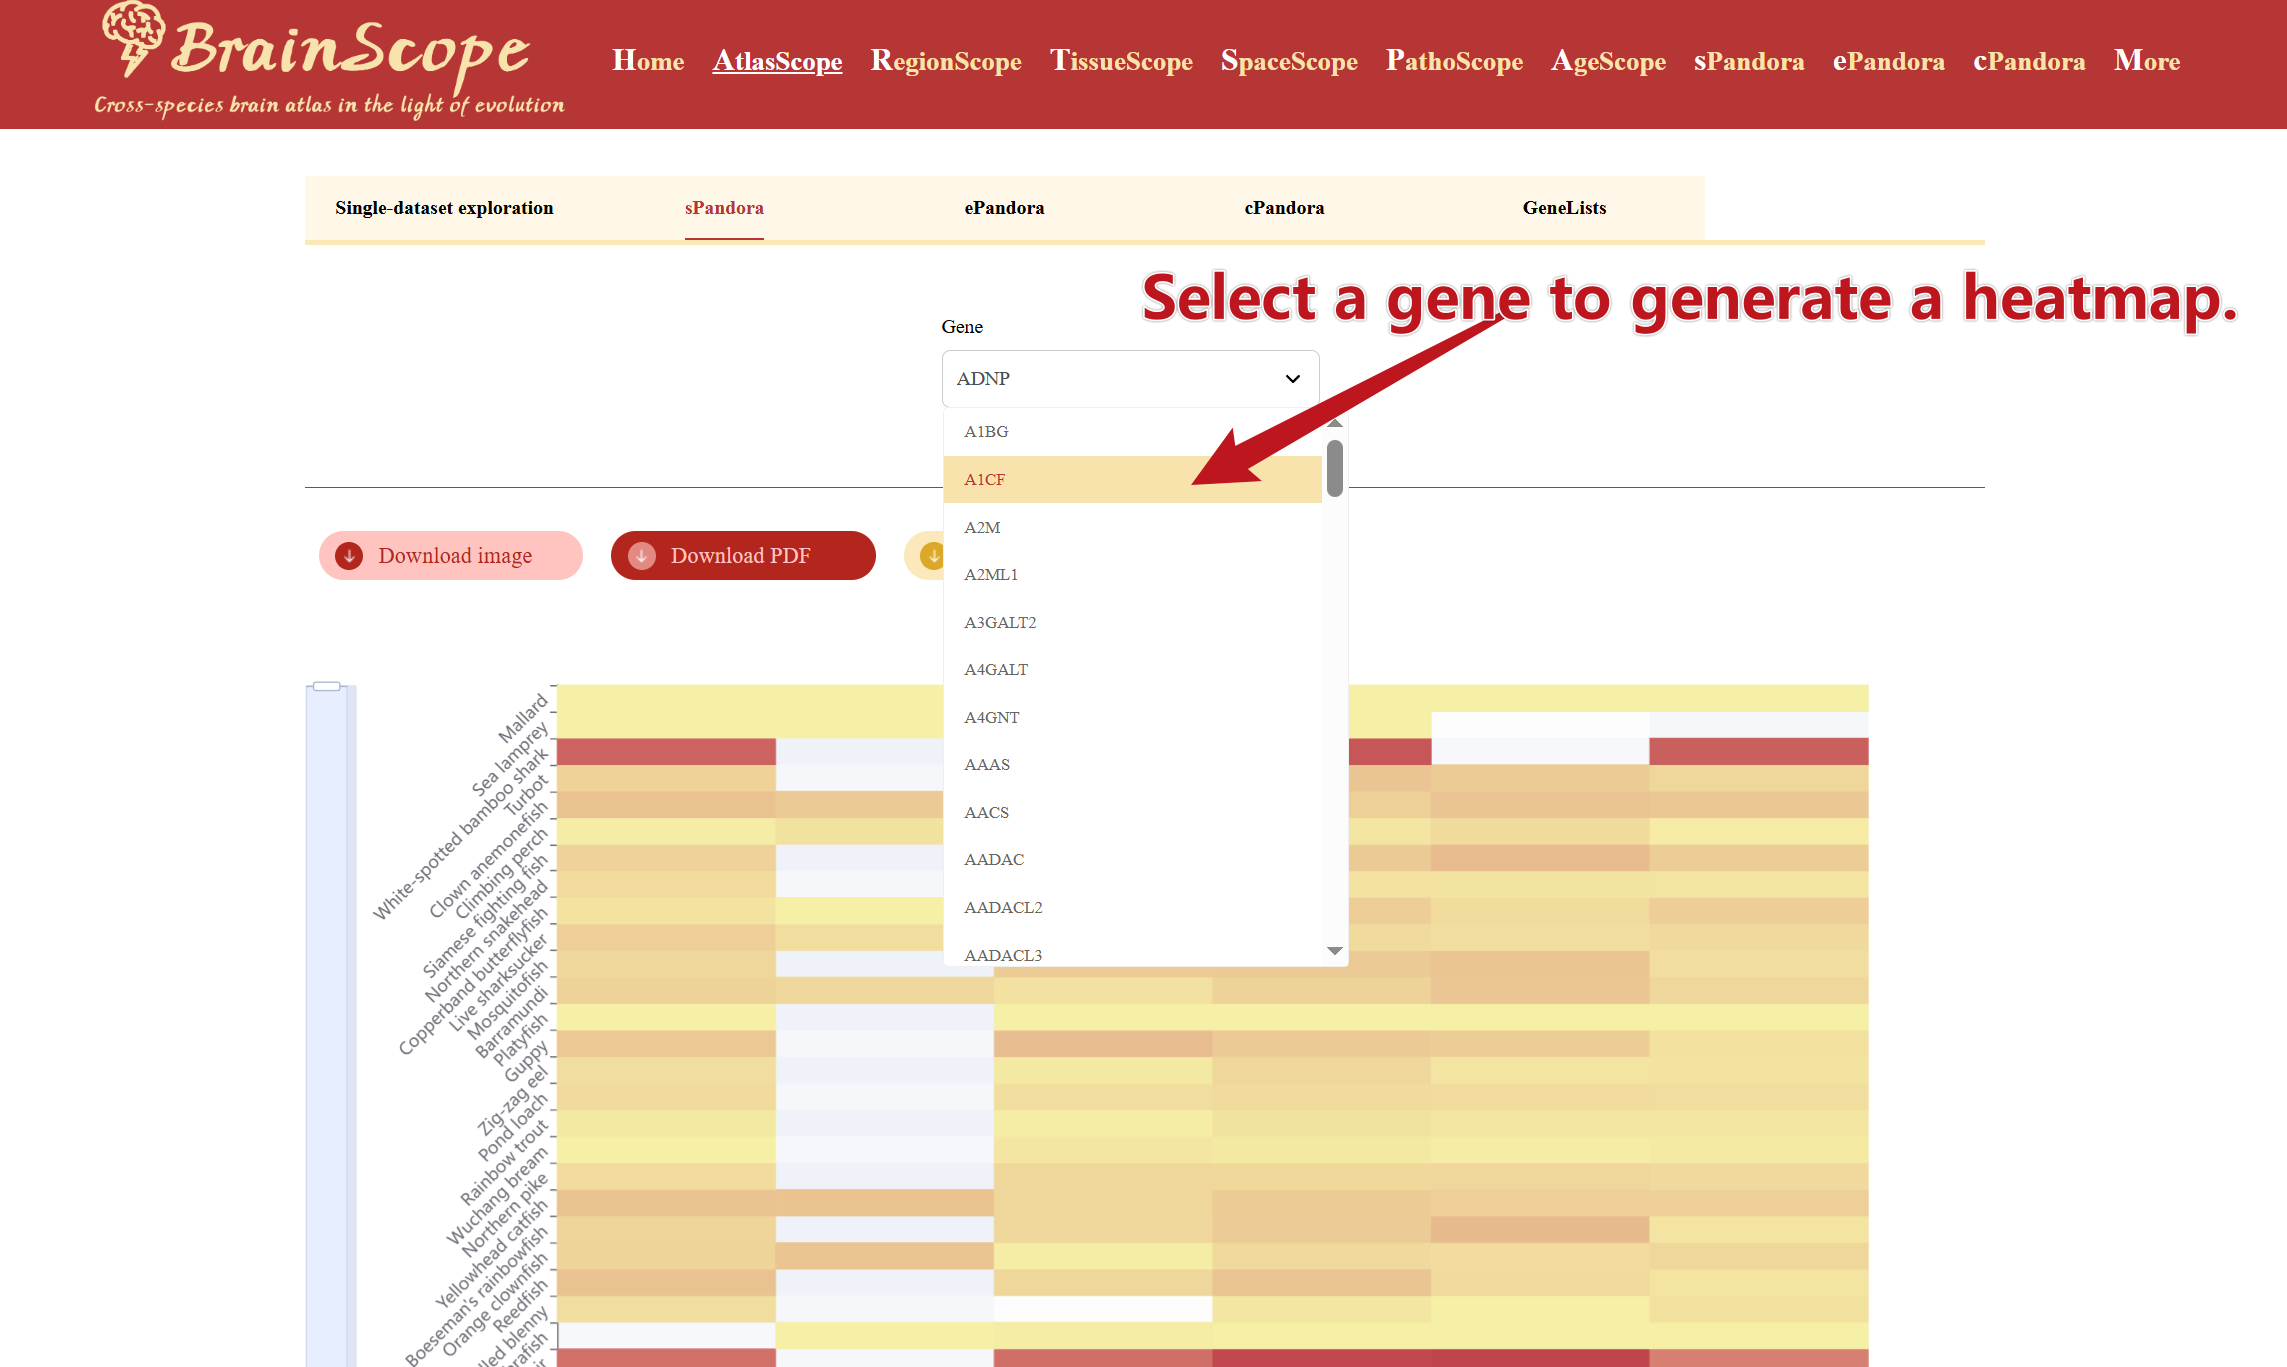
Users can download the heatmap visualization in different formats by clicking buttons above the heatmap.
ePandora
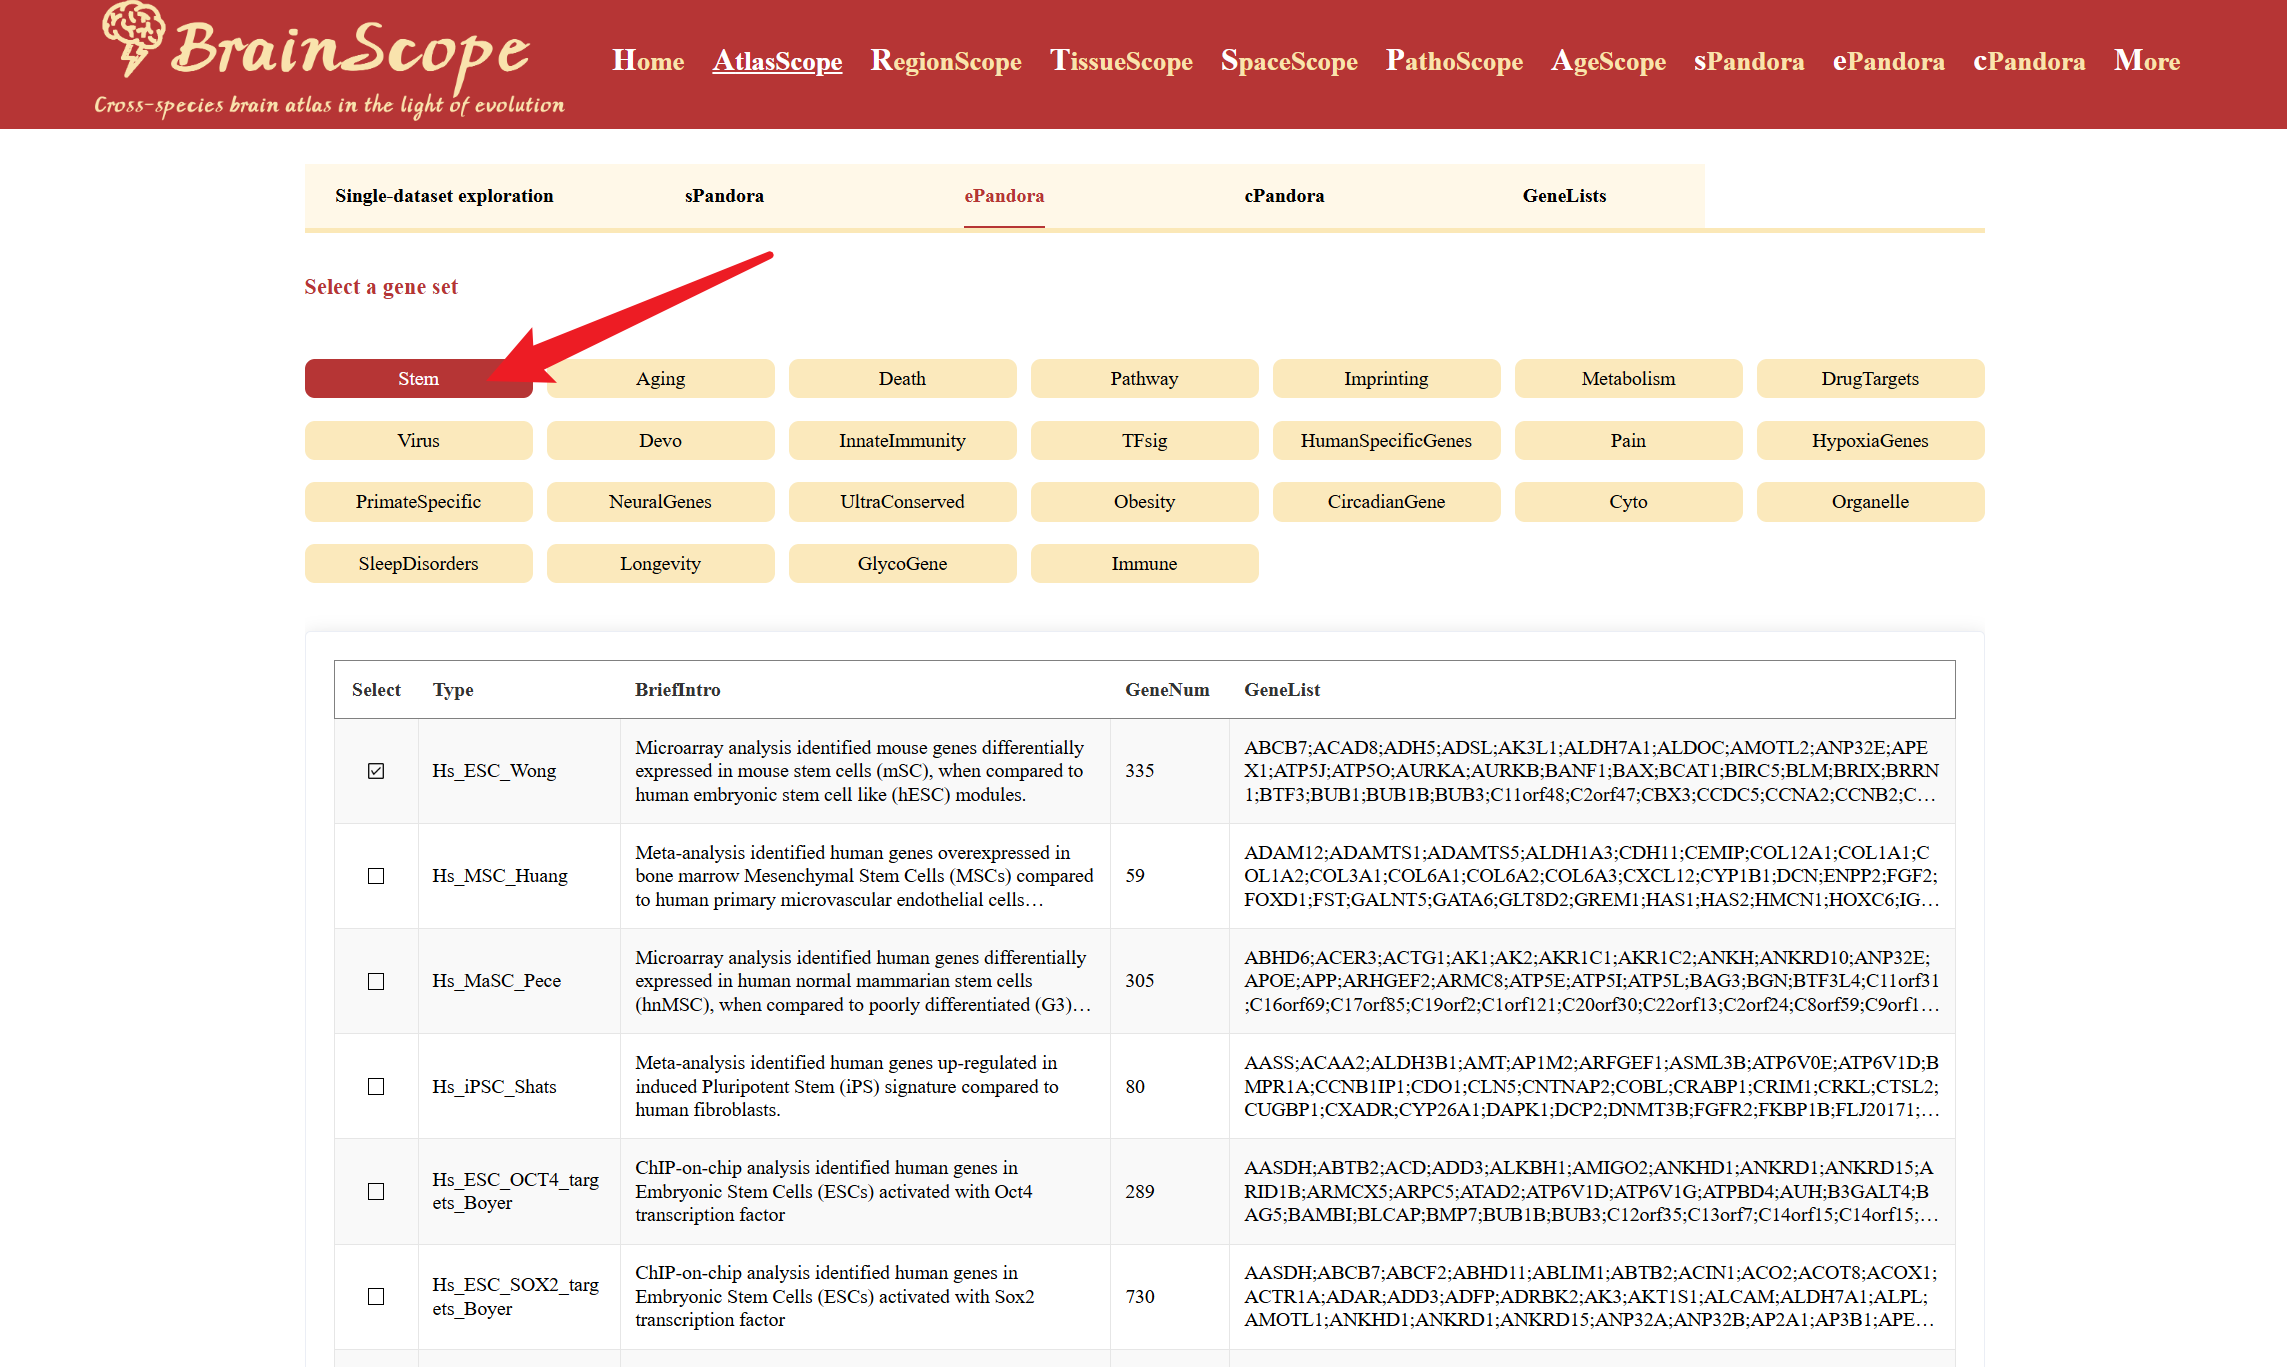
ePandora in AtlasScope enables users to explore the expression pattern of gene sets across multiple species and brain cell types. This tool provides insights into coordinated gene expression with predefined gene sets, facilitating comparisons across different species through heatmap visualiztion.Choose from 28 available gene set categories, such as Stem, Aging, NeuralGenes, CellType, Disease, StressResponse, and more. Click on your category of interest to display the associated gene lists in a table below.
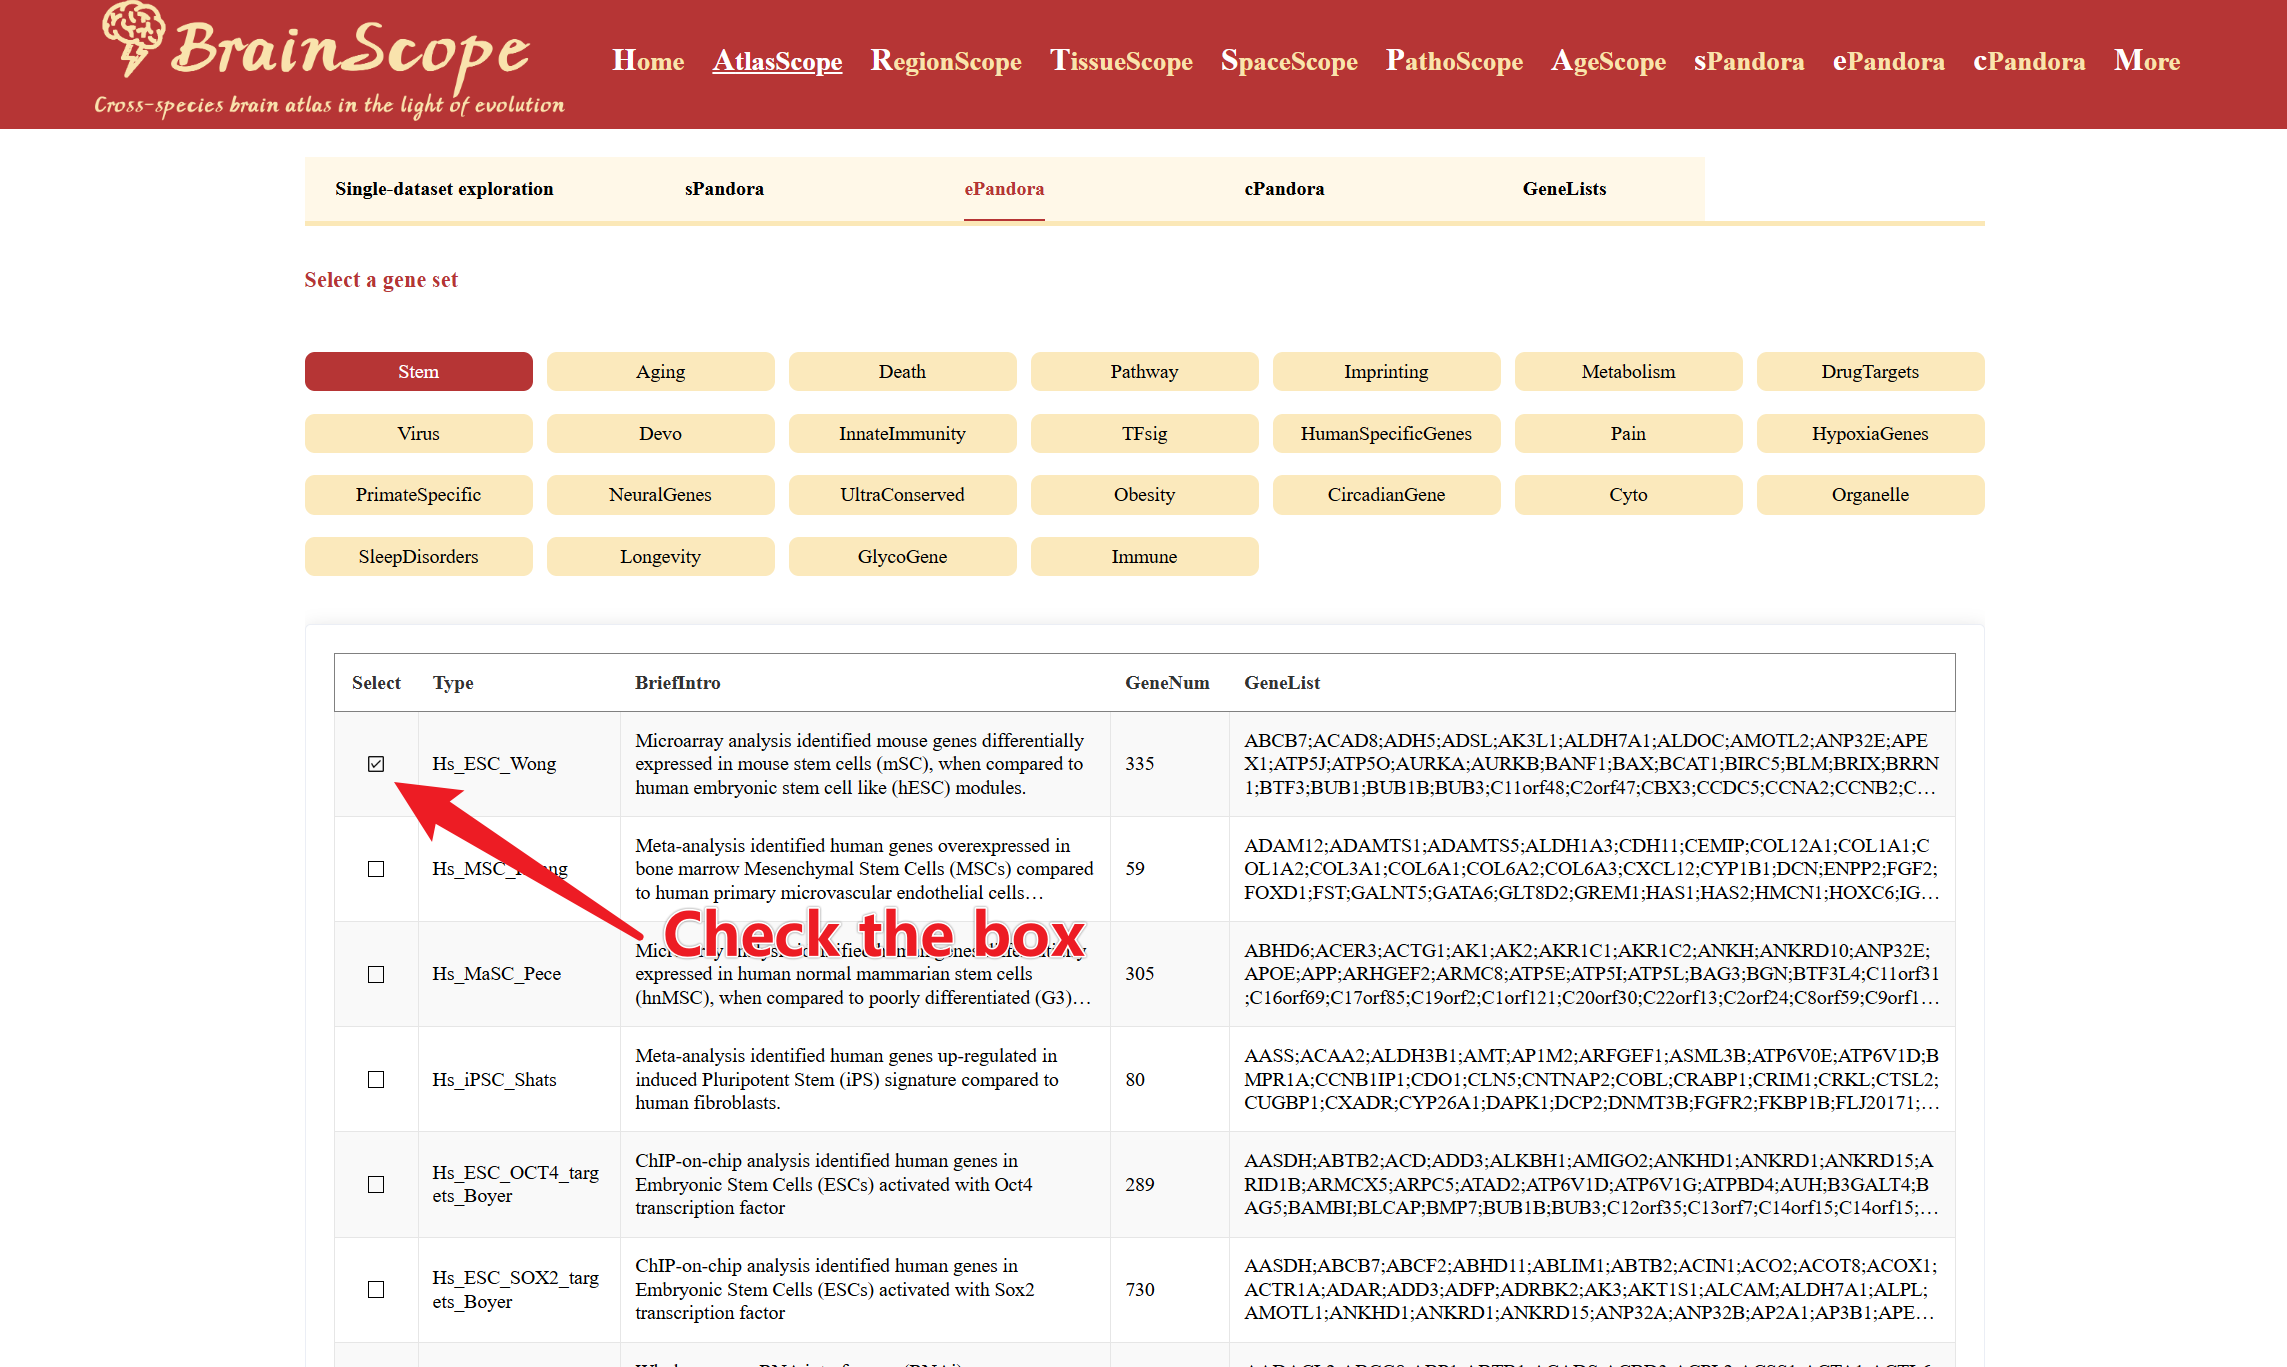
In the table, browse different predefined gene lists under the chosen category. Check the box next to the gene list(s) of interest to generate the heatmap visualization.
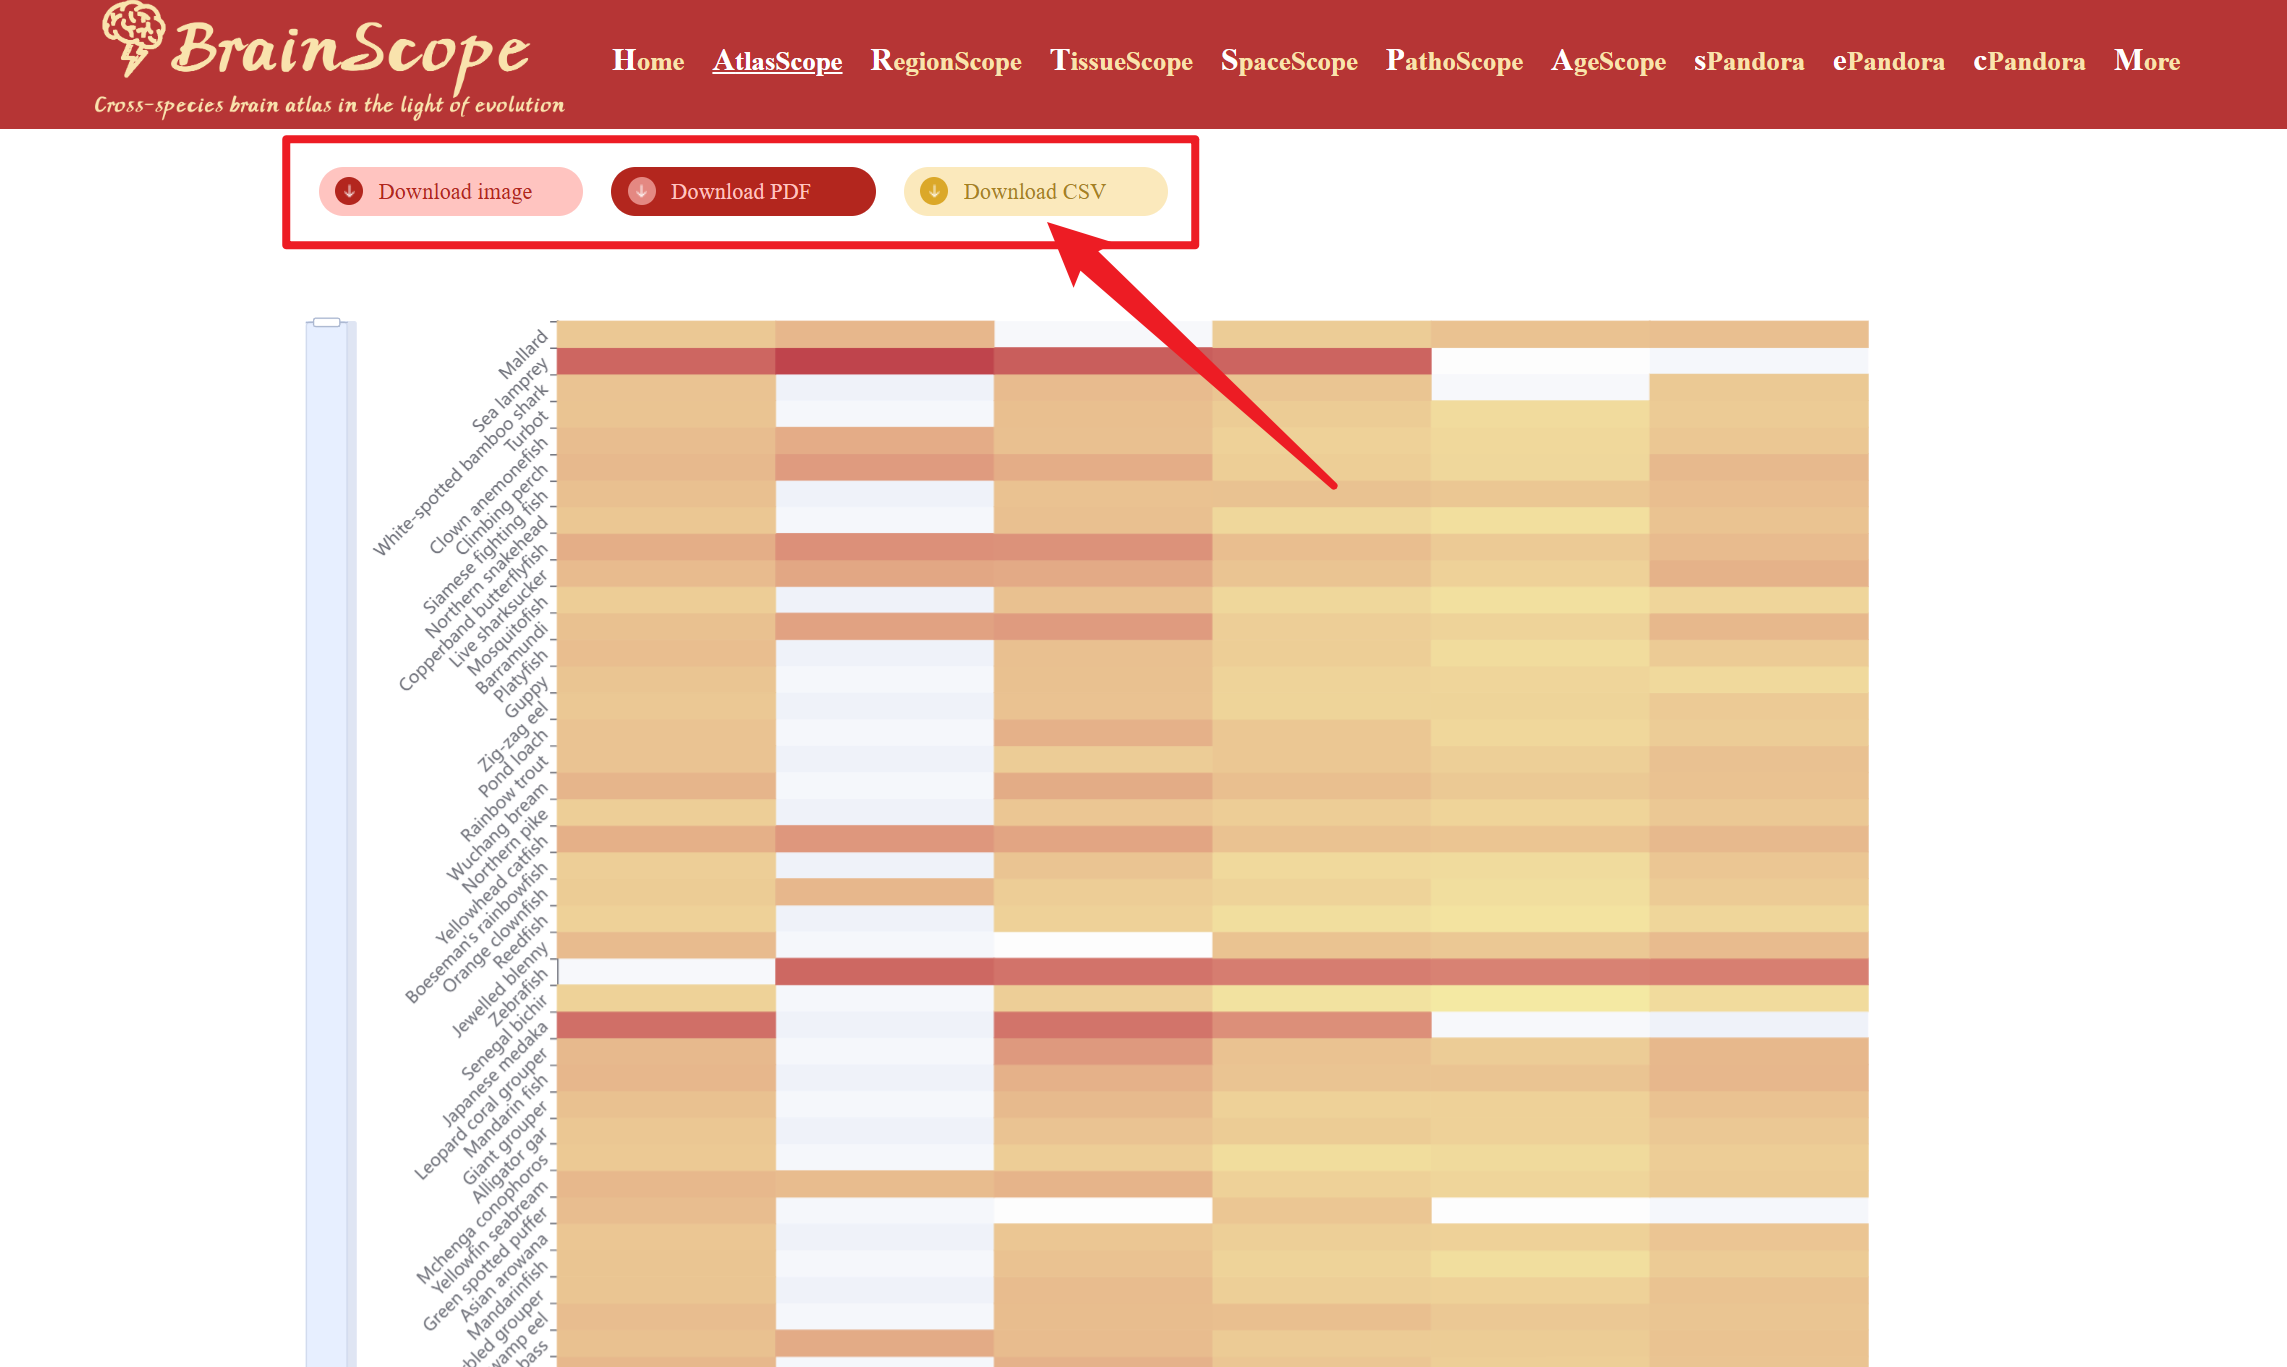
Users can download the heatmap visualization in different formats by clicking buttons below the heatmap.
cPandora
cPandora in AtlasScope provides a comprehensive visualization of the distribution of different brain cell types across various species. This tool enables users to analyze the proportion of major brain cell types in different datasets, offering insights into cellular composition variations across species.
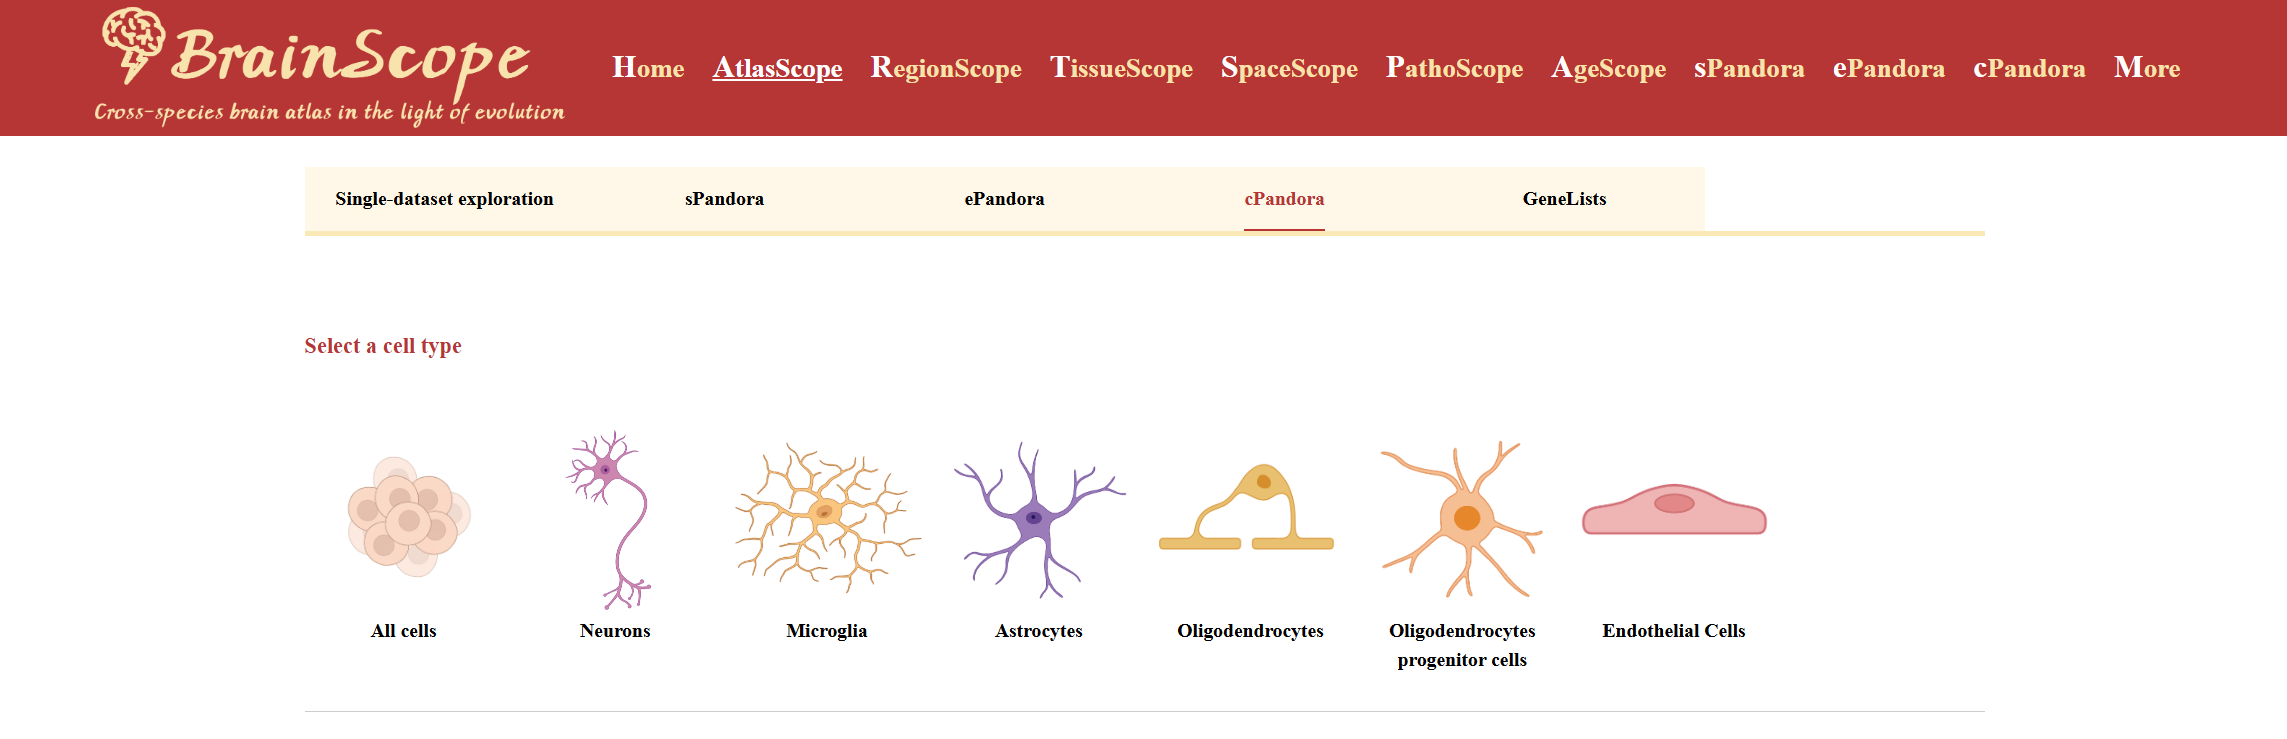
Choose a specific brain cell type (e.g., Neurons, Microglia, Astrocytes, Oligodendrocytes, OPCs, or Endothelial Cells). If users don't make any choices, it will present the relative proportions of all six major brain cell types across different species.
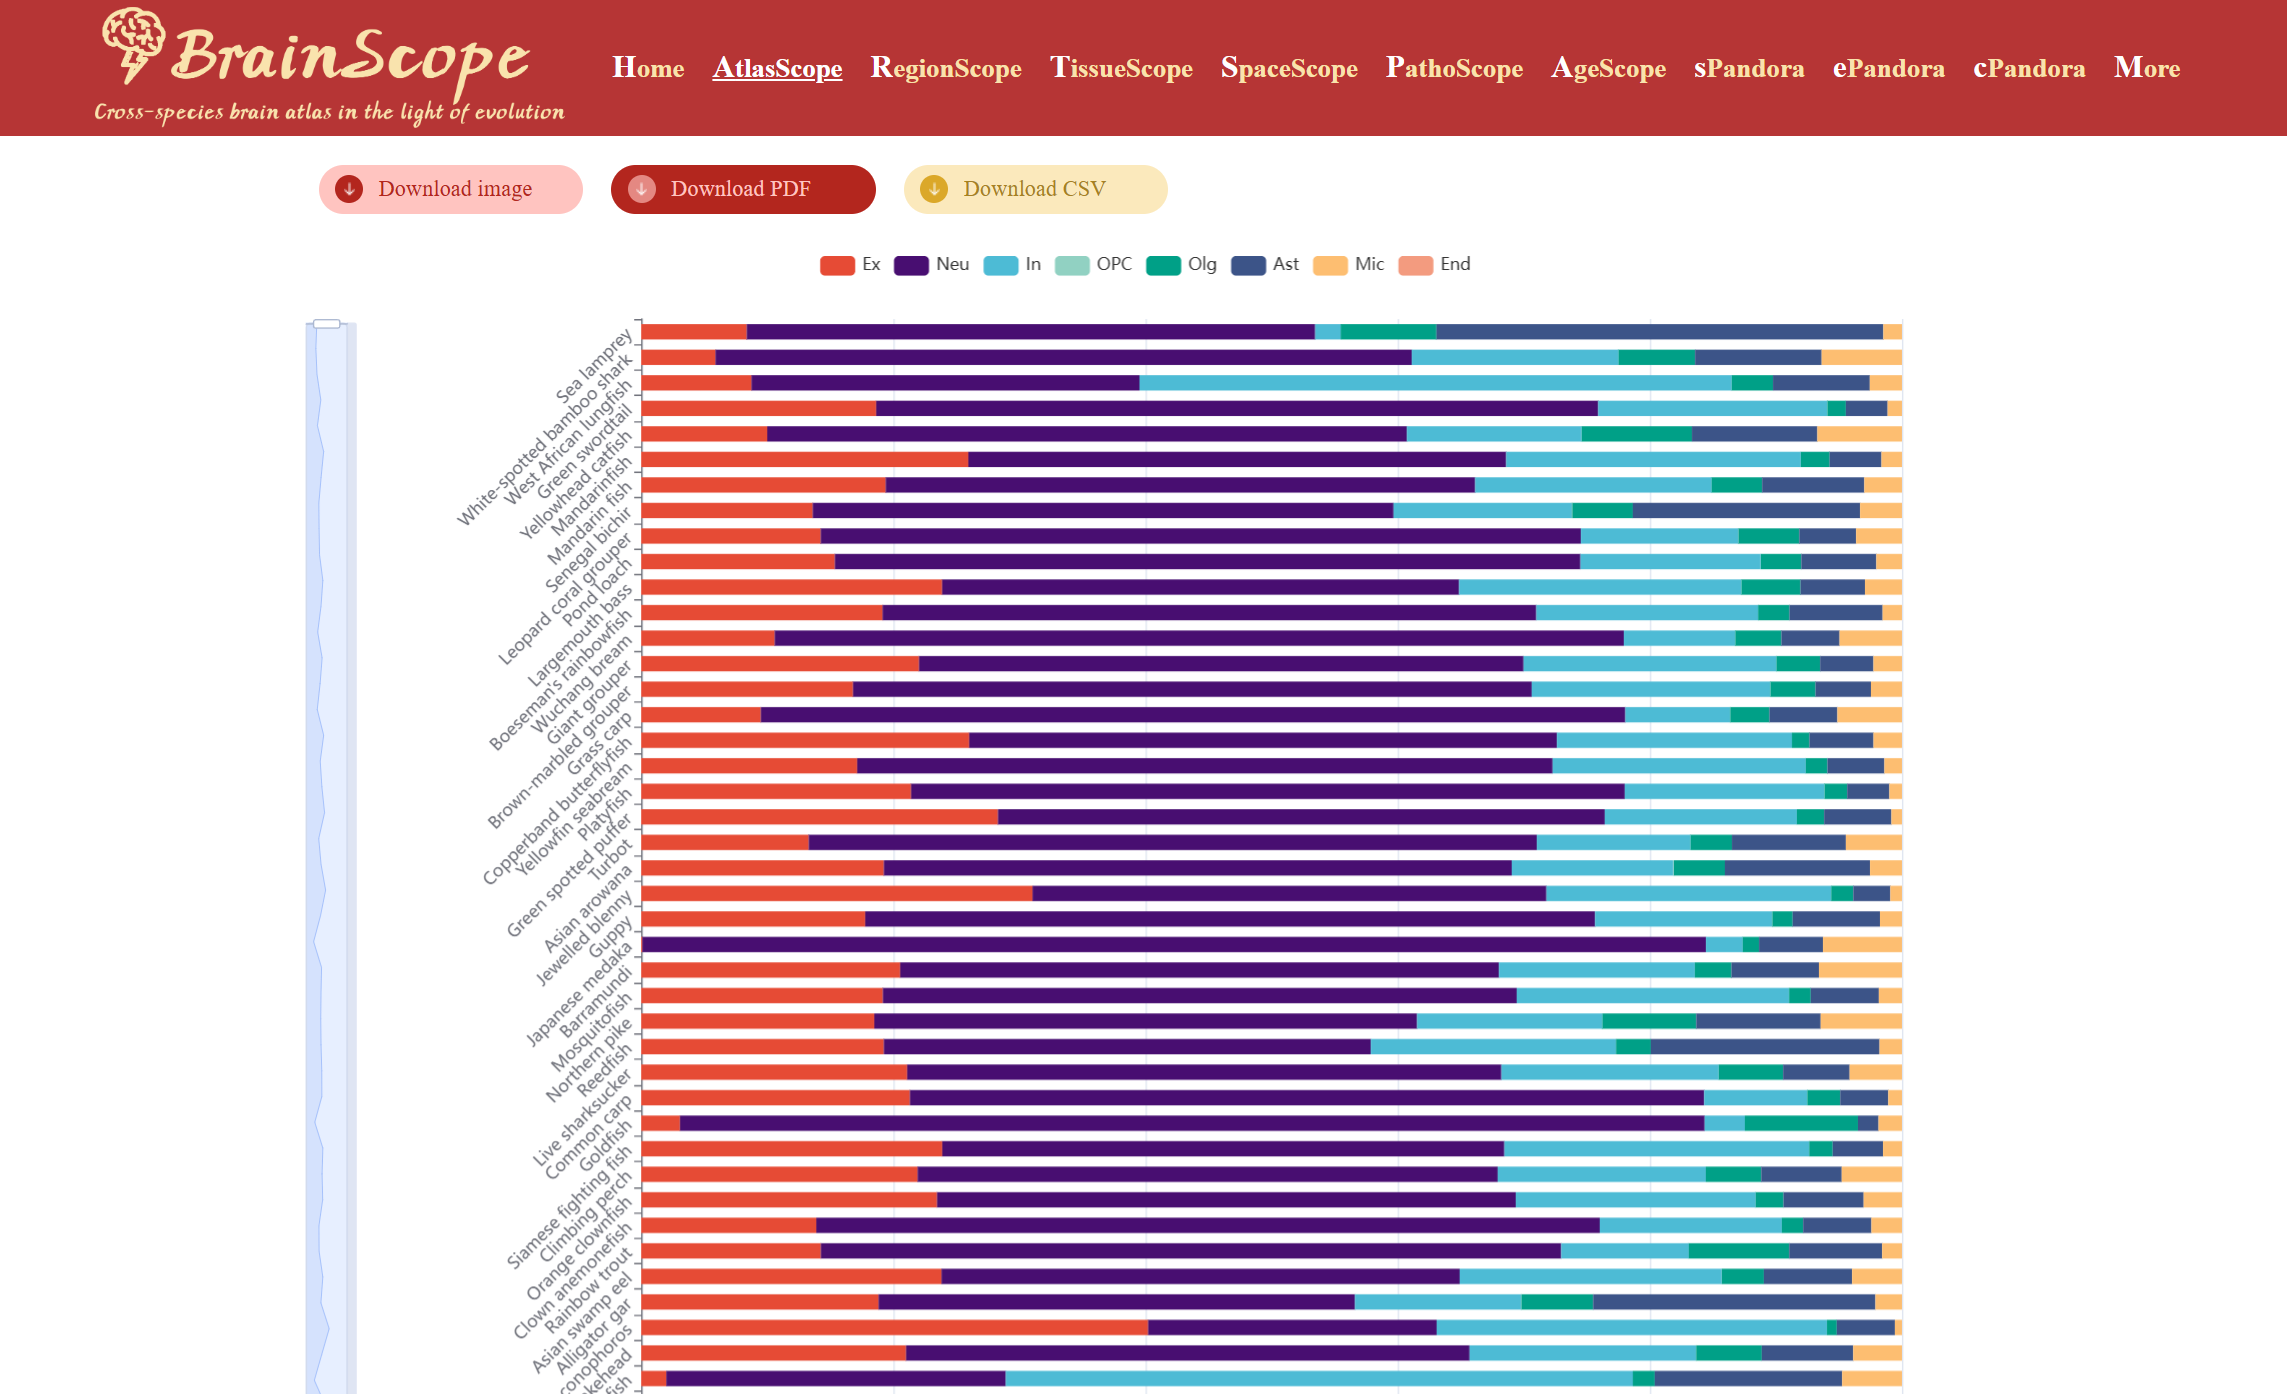
If choice made, the stacked bar chart displays the proportional distribution of the selected cell type across species. Users can download the heatmap visualization in different formats by clicking buttons below the heatmap.

GeneLists
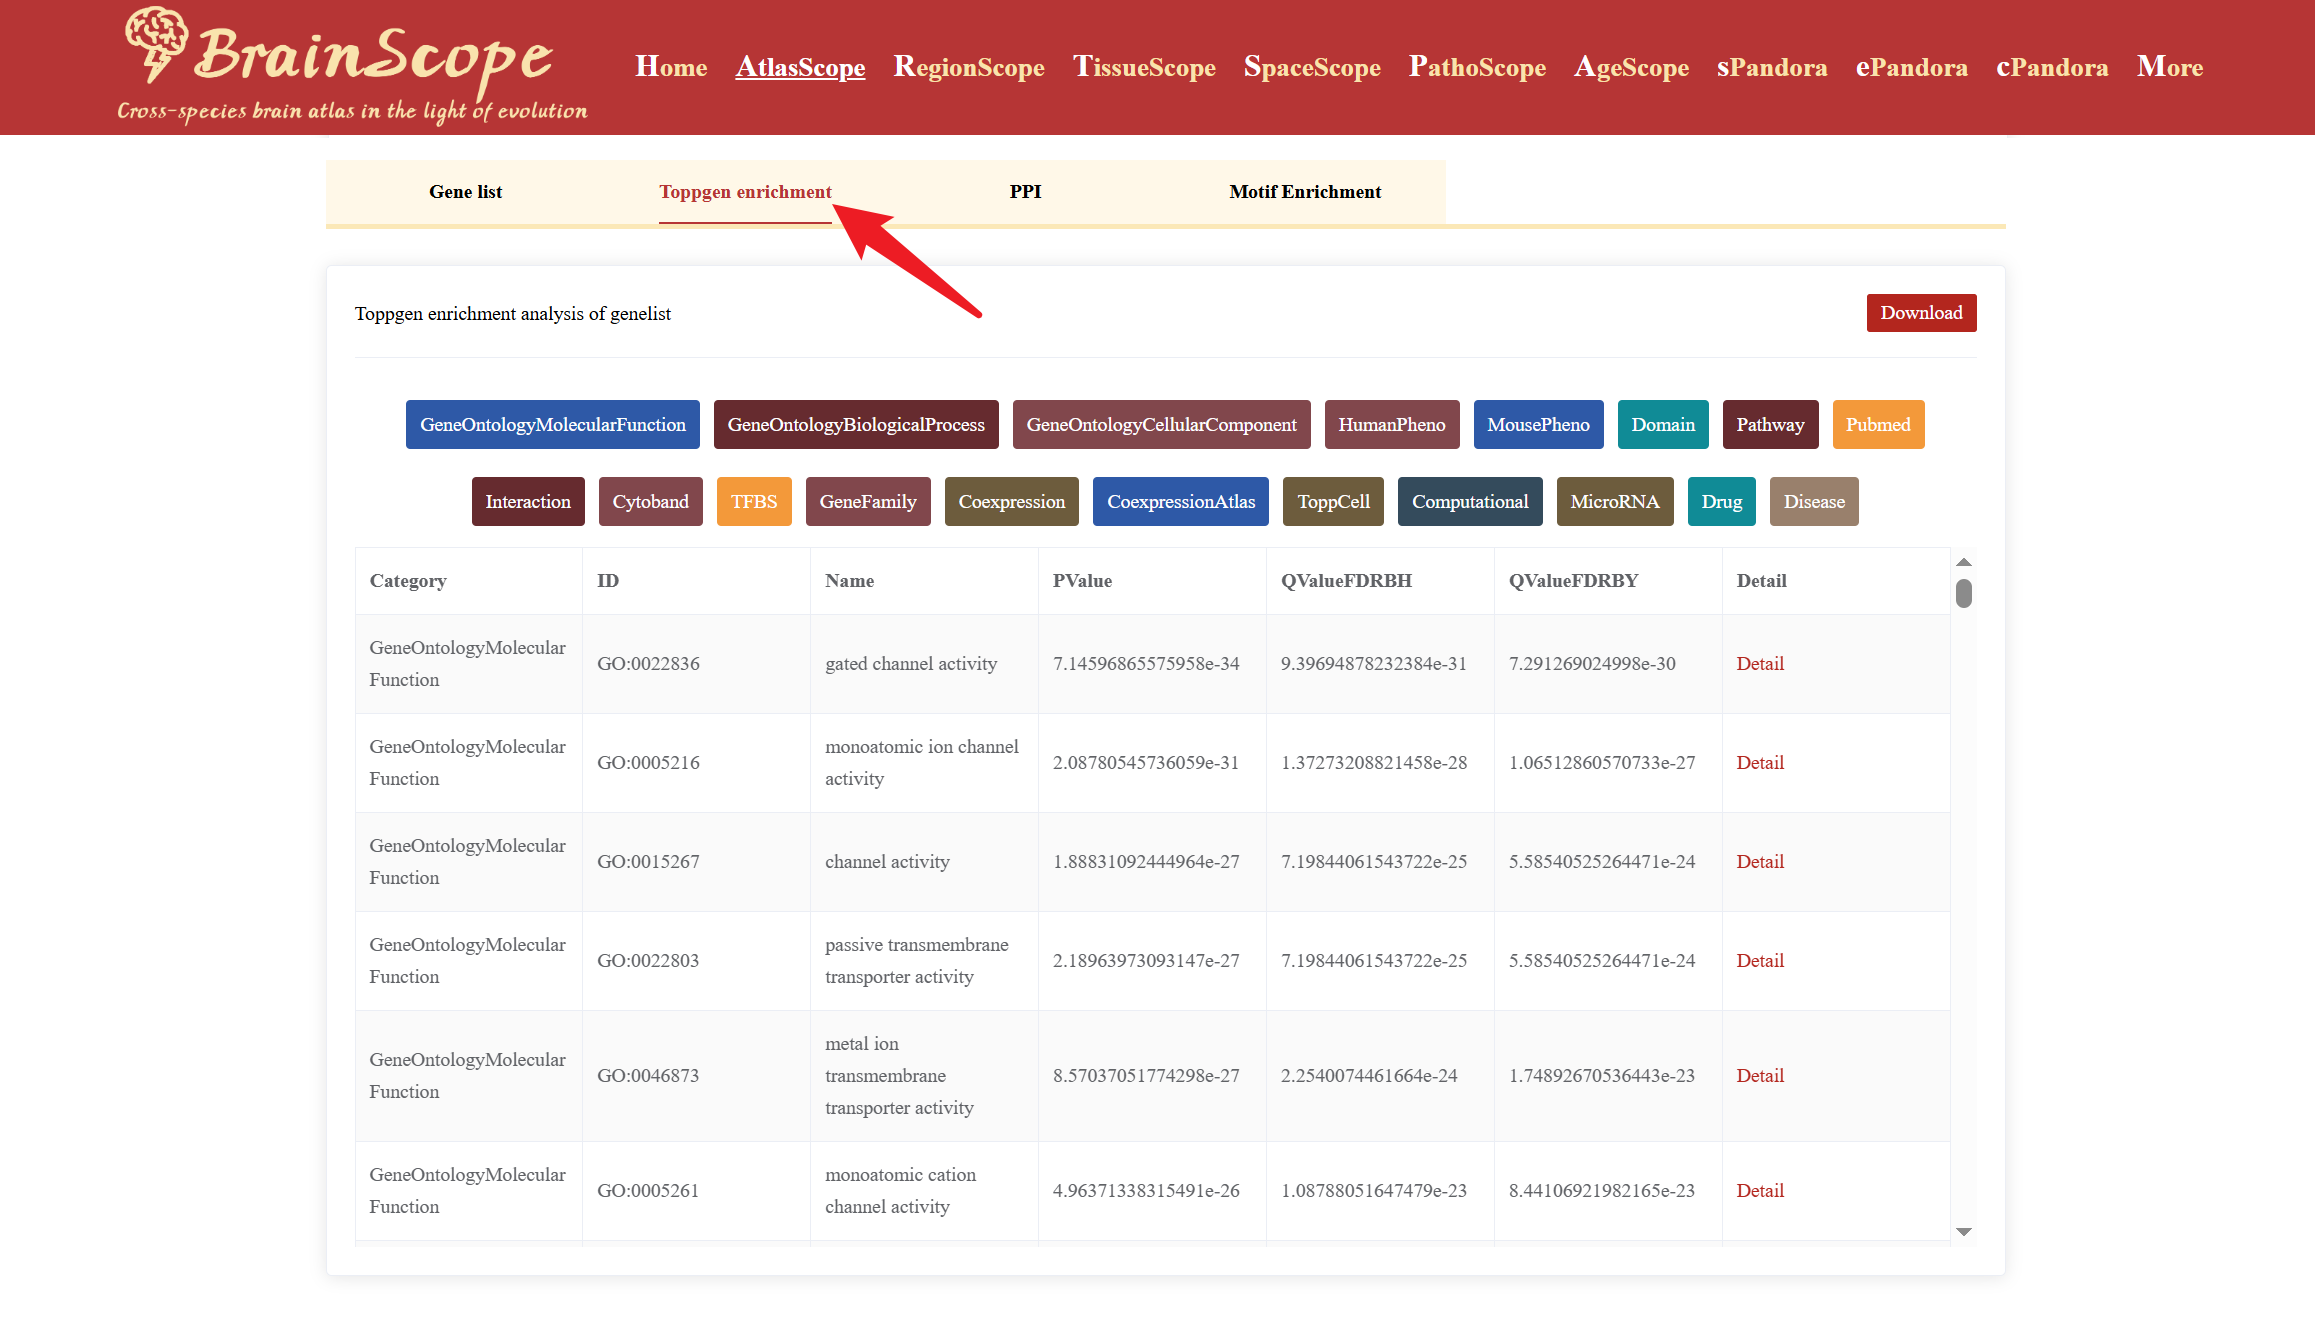
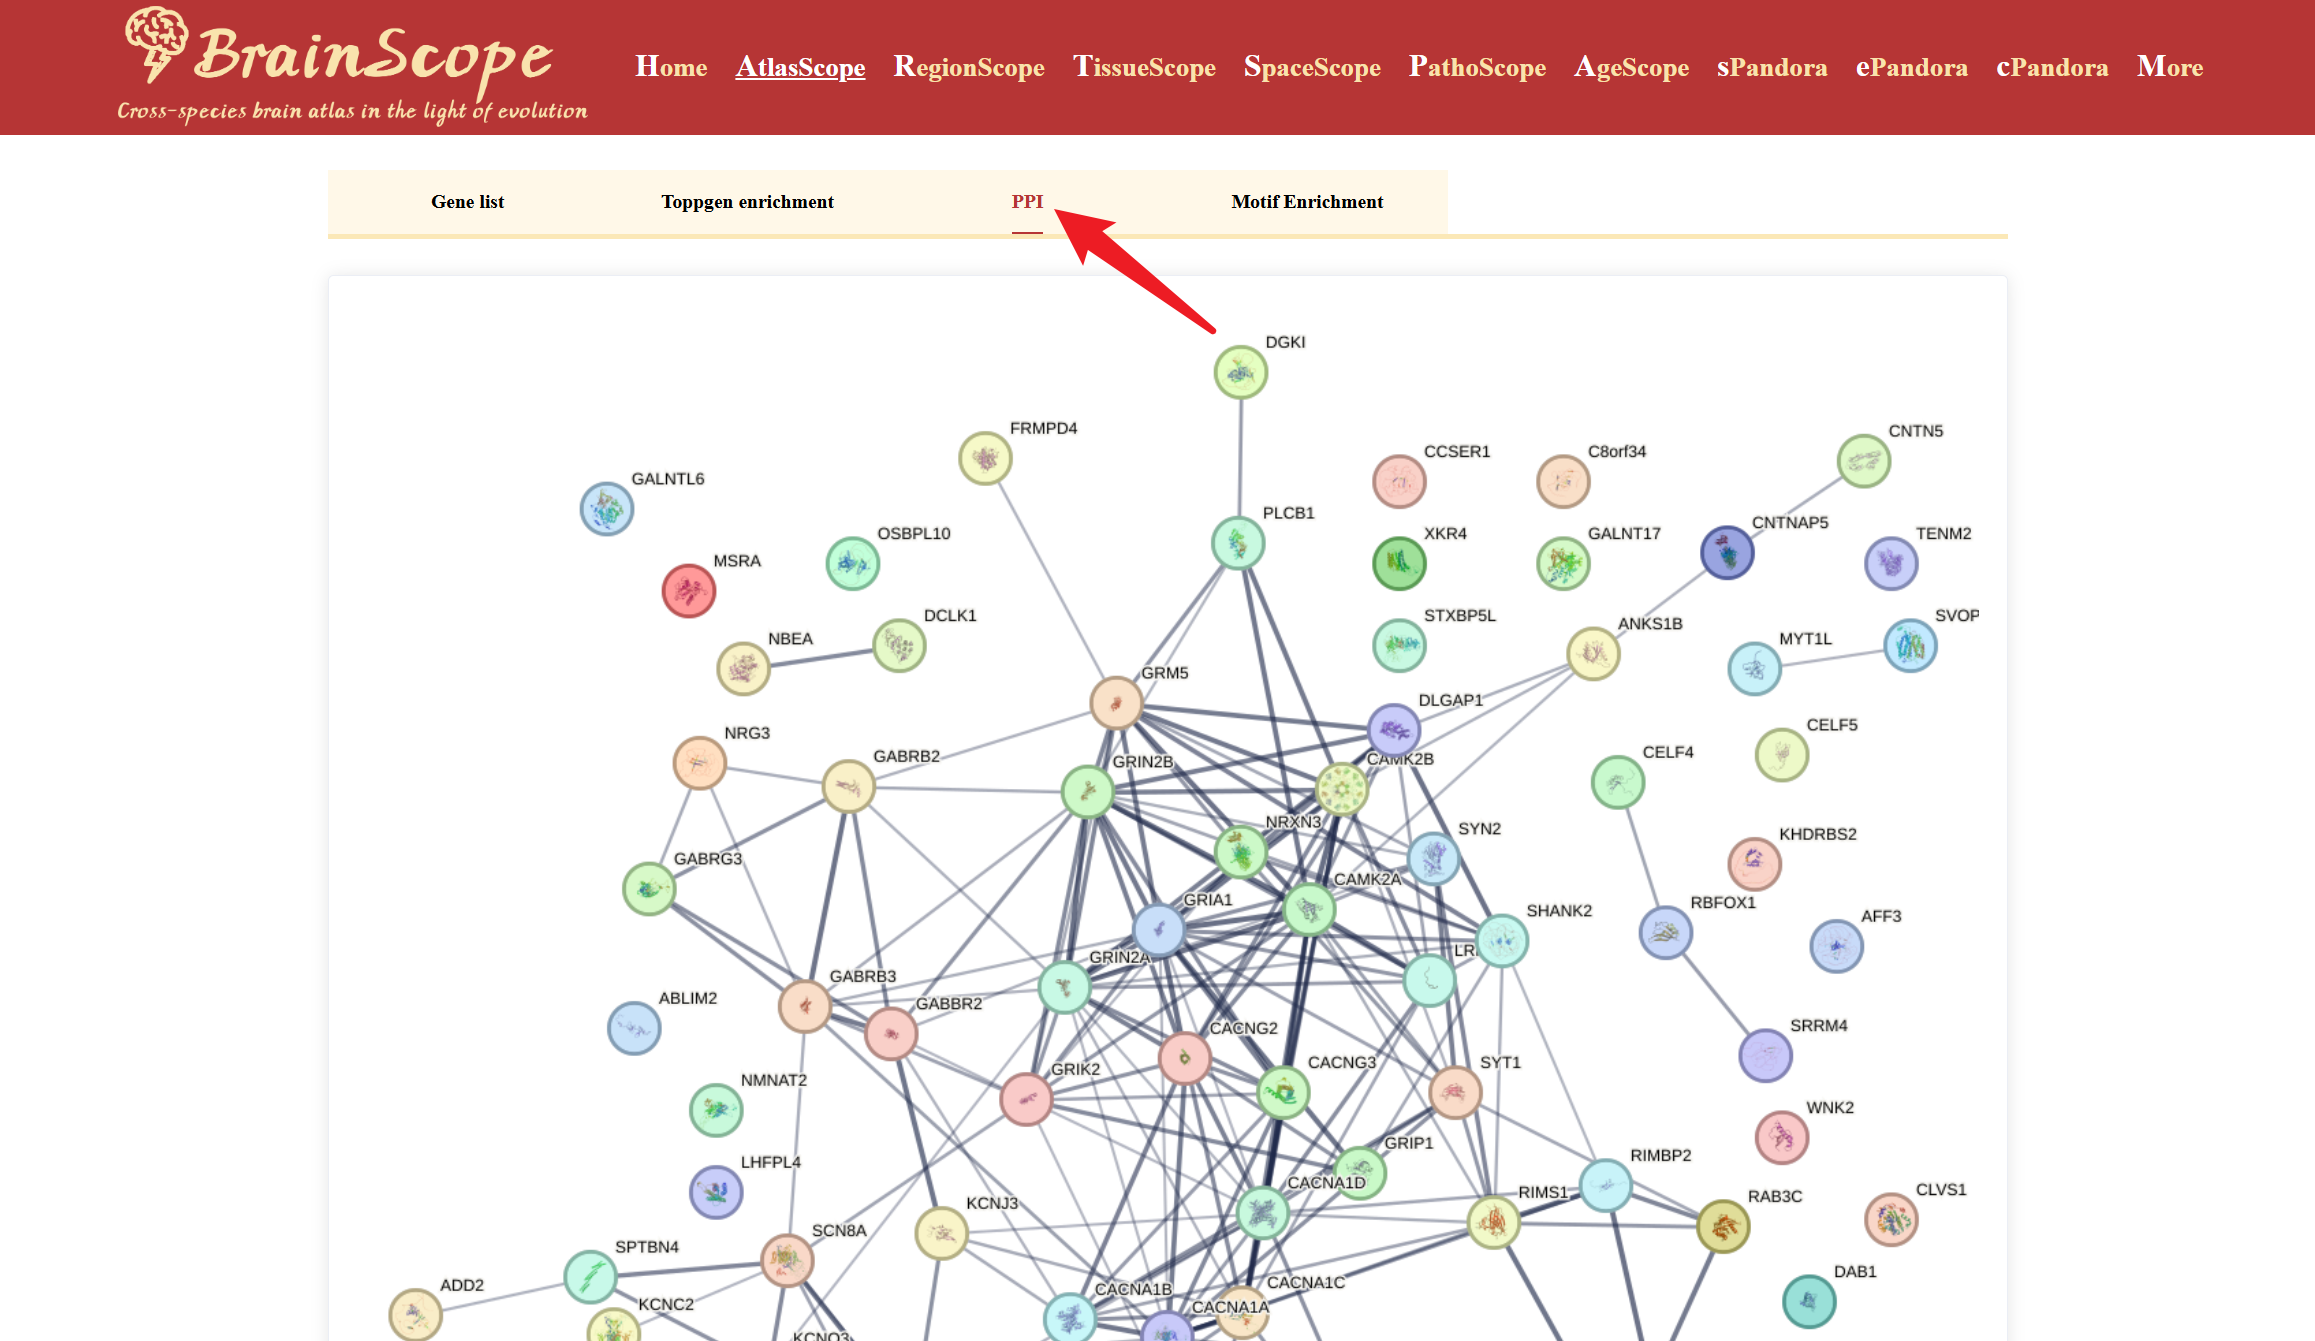
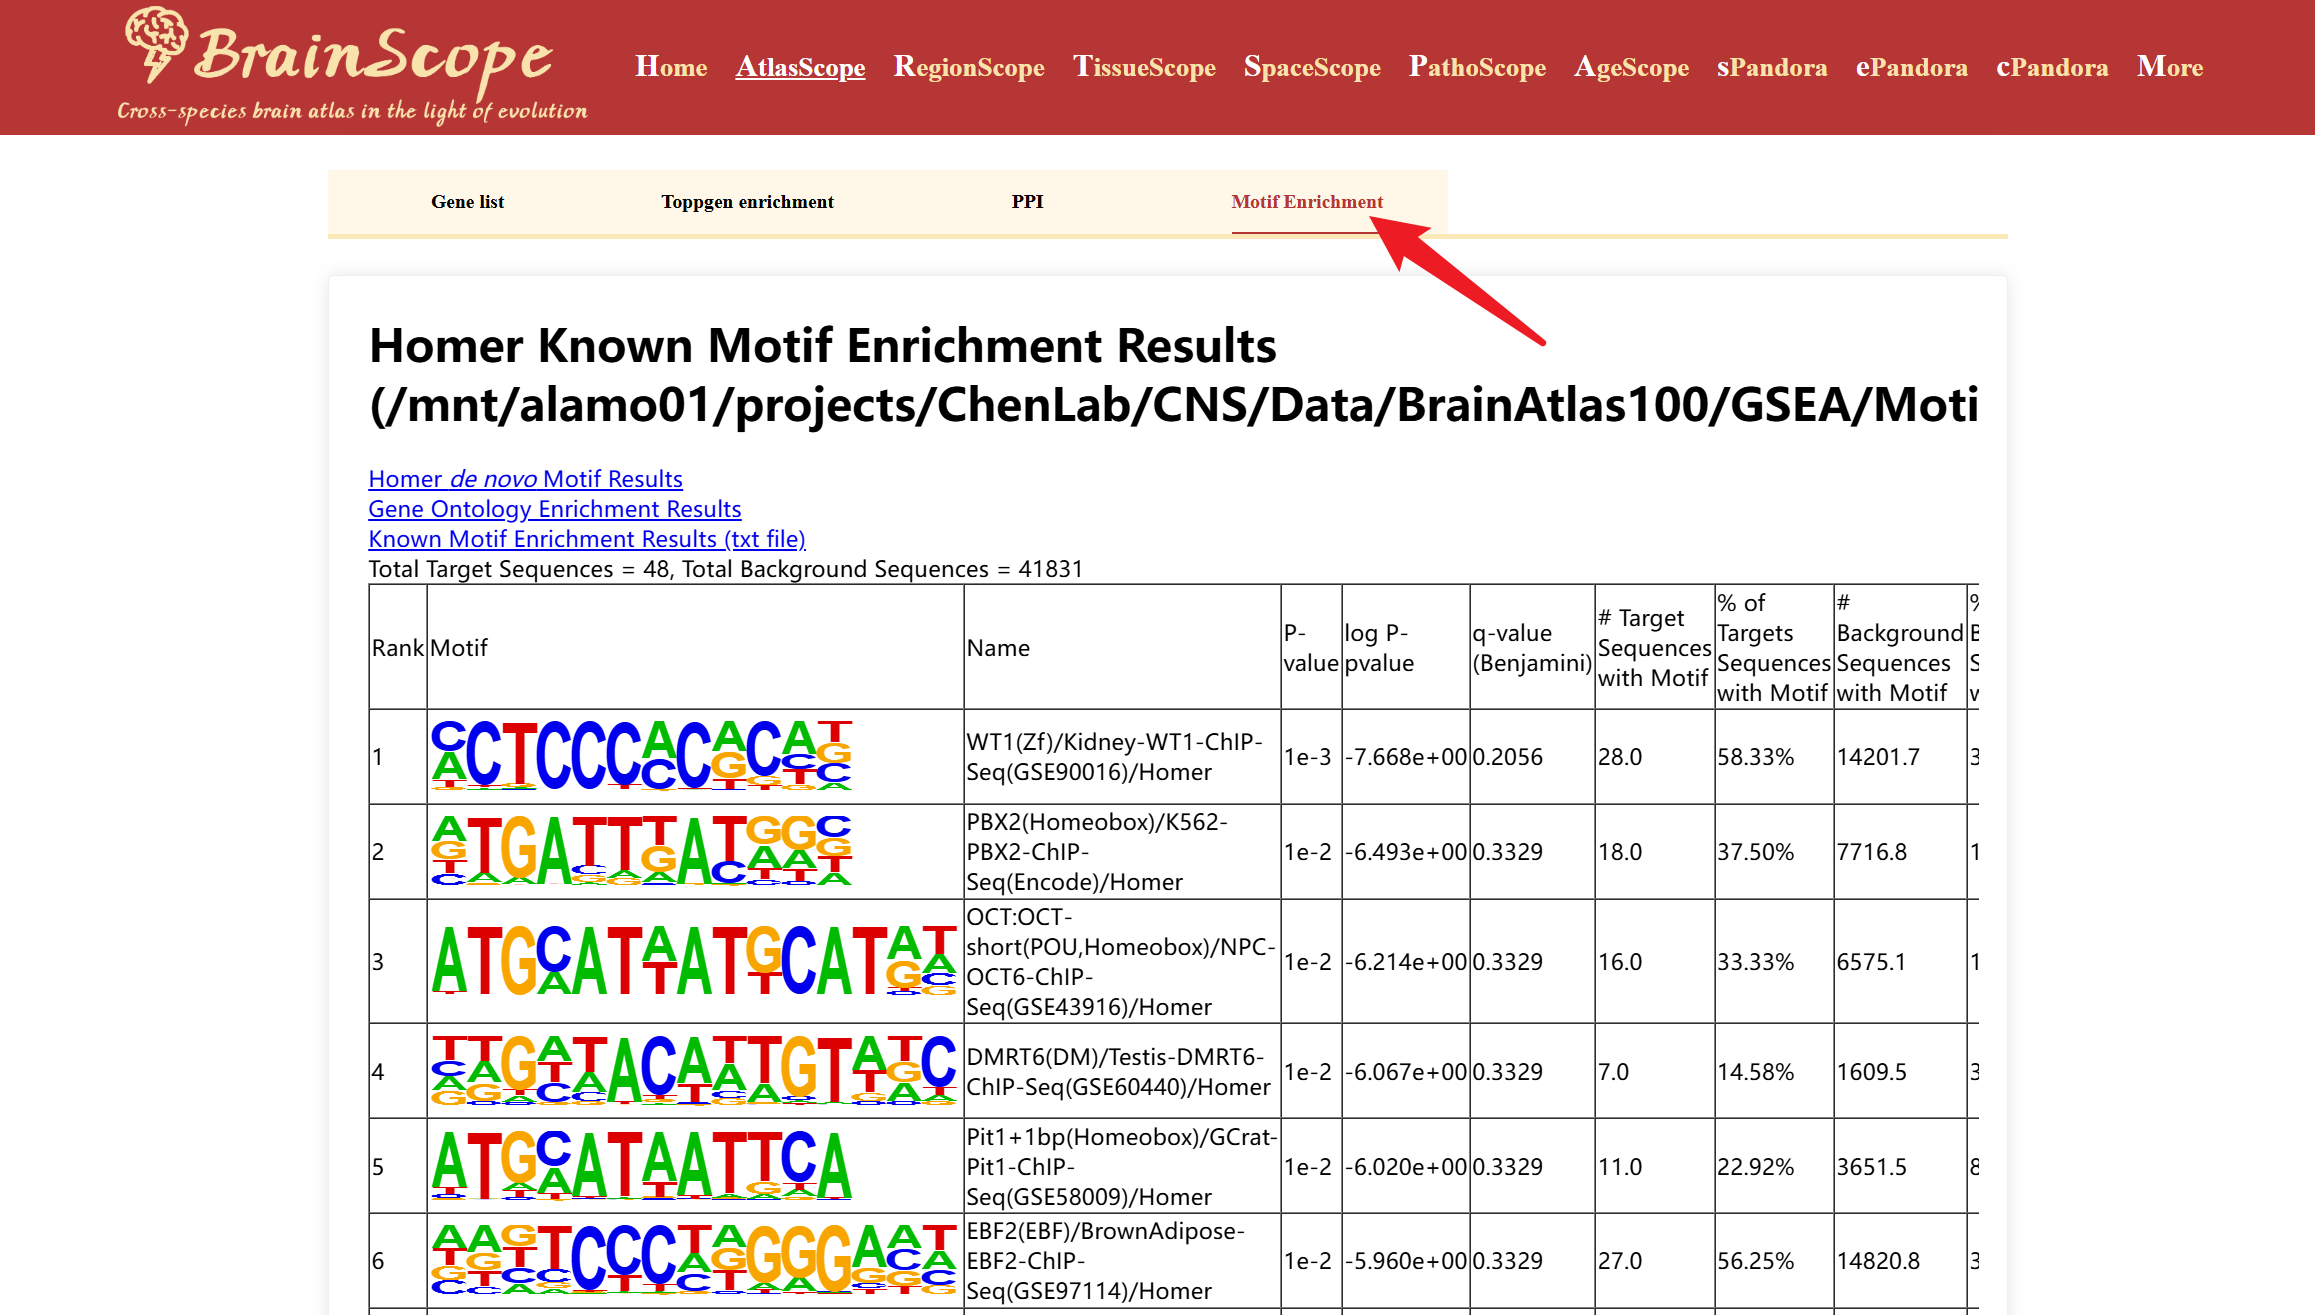
The GeneLists module provides users with access to differentially expressed gene (DEG) lists for various brain cell types available in our database. This module enables researchers to explore cell-type-specific gene expression patterns, enrichment analysis, protein-protein interactions (PPI), and motif enrichment analysis.
Select a cell type by checking the box.
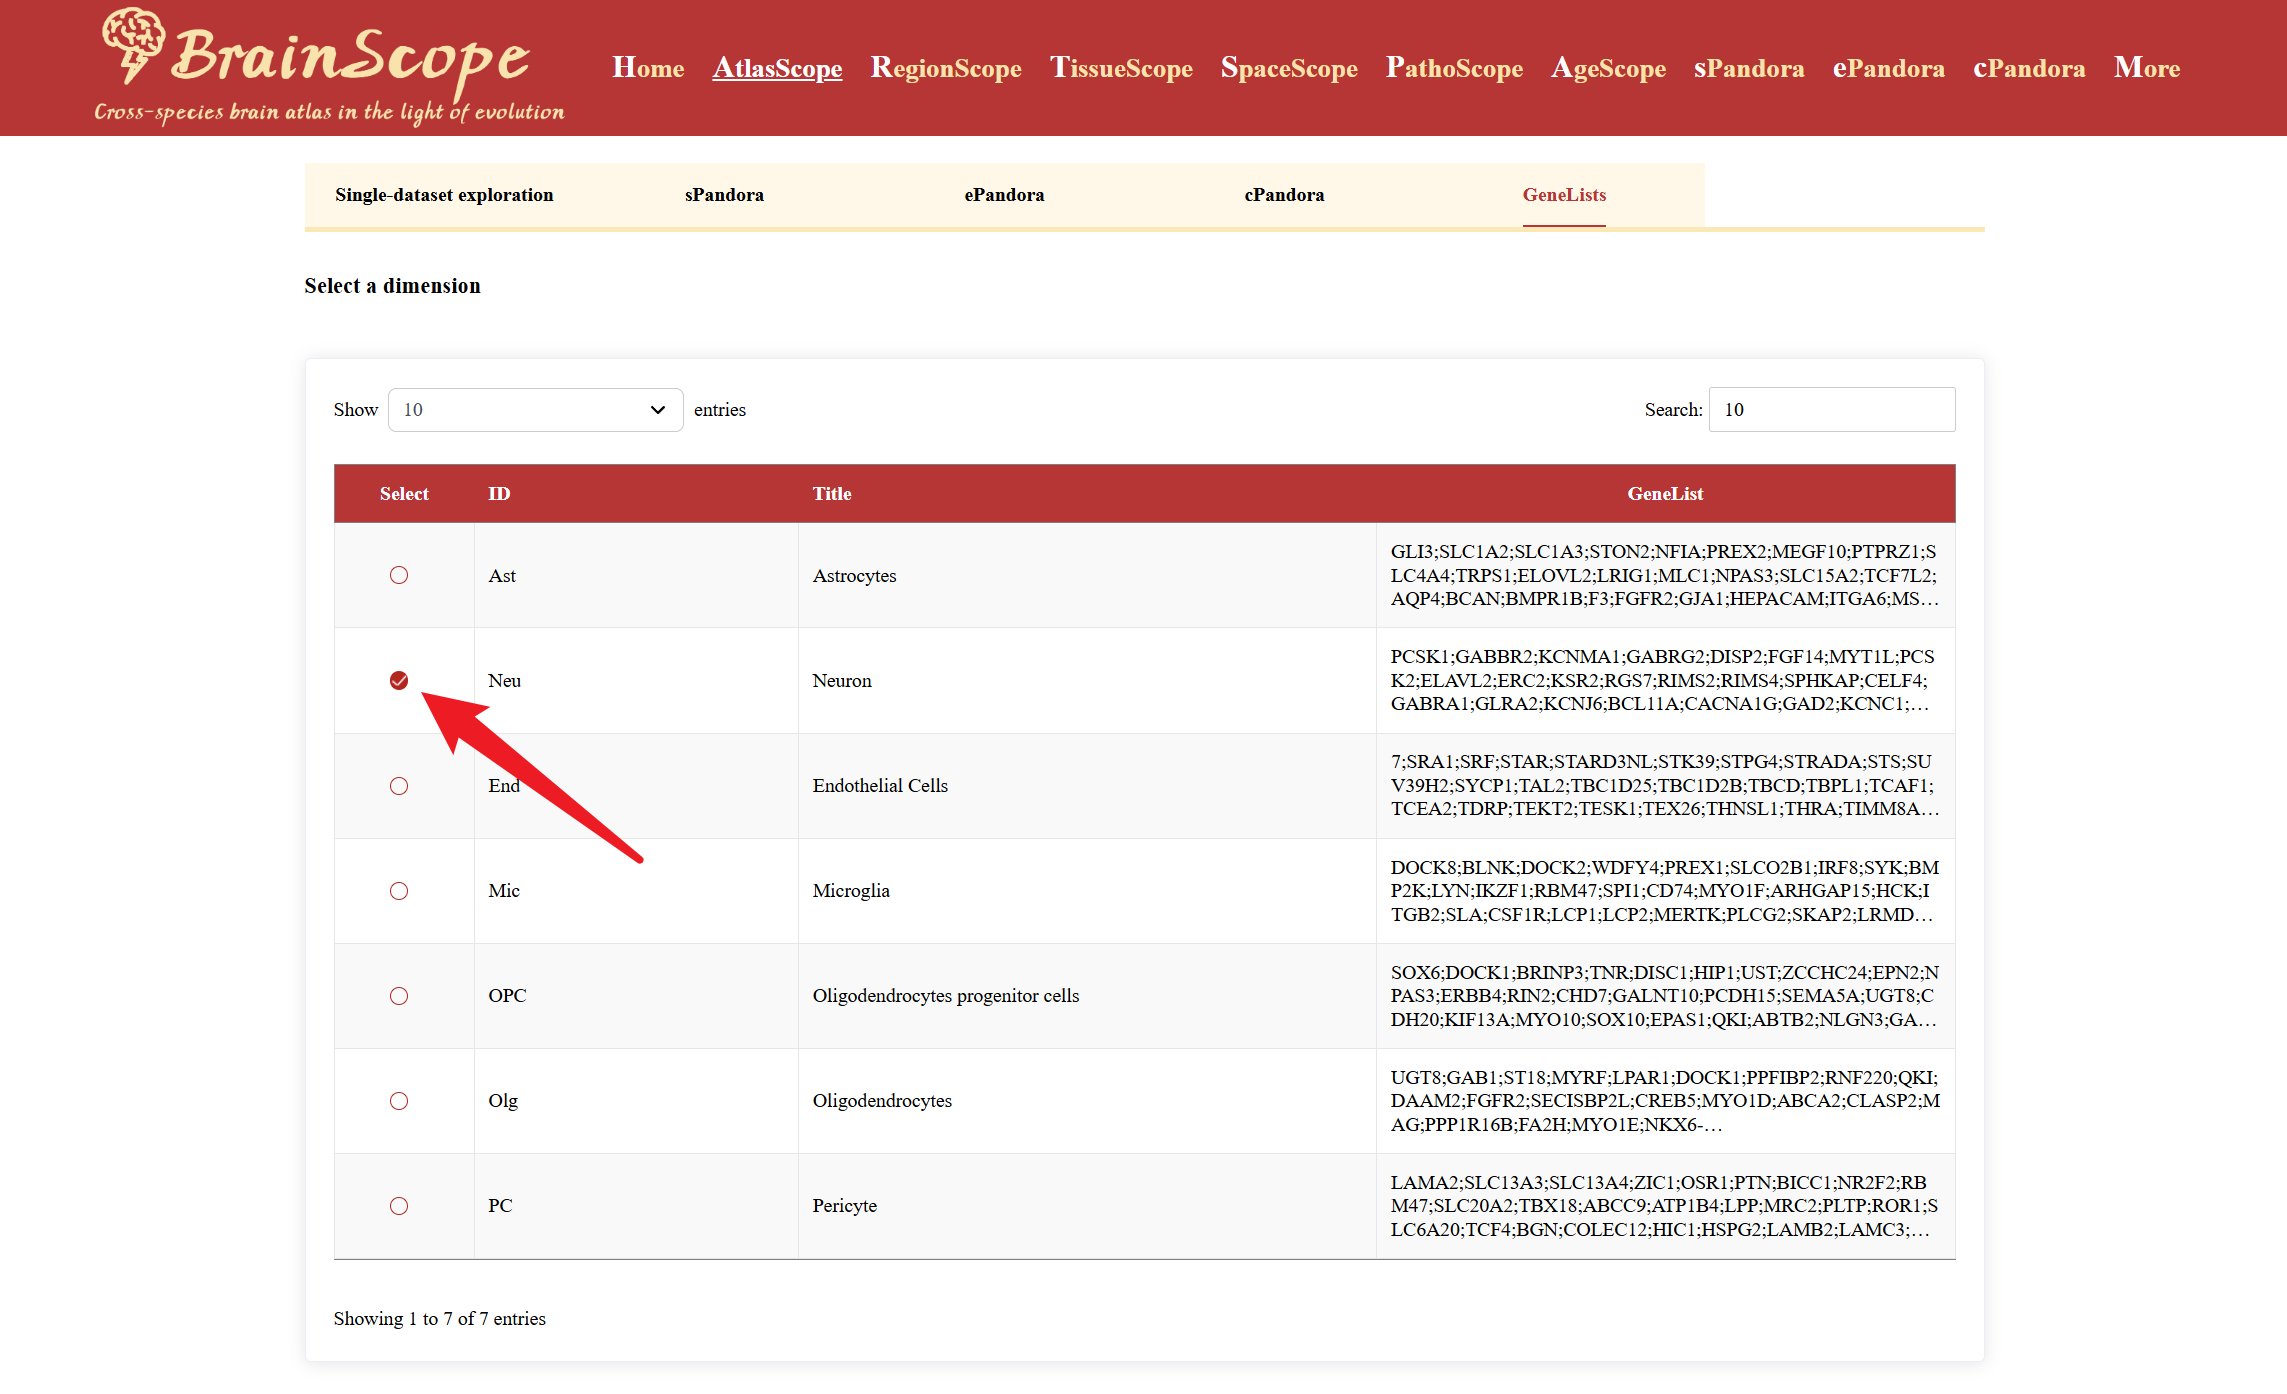
Gene List provides key information about the selected cell type’s differential expression profile.
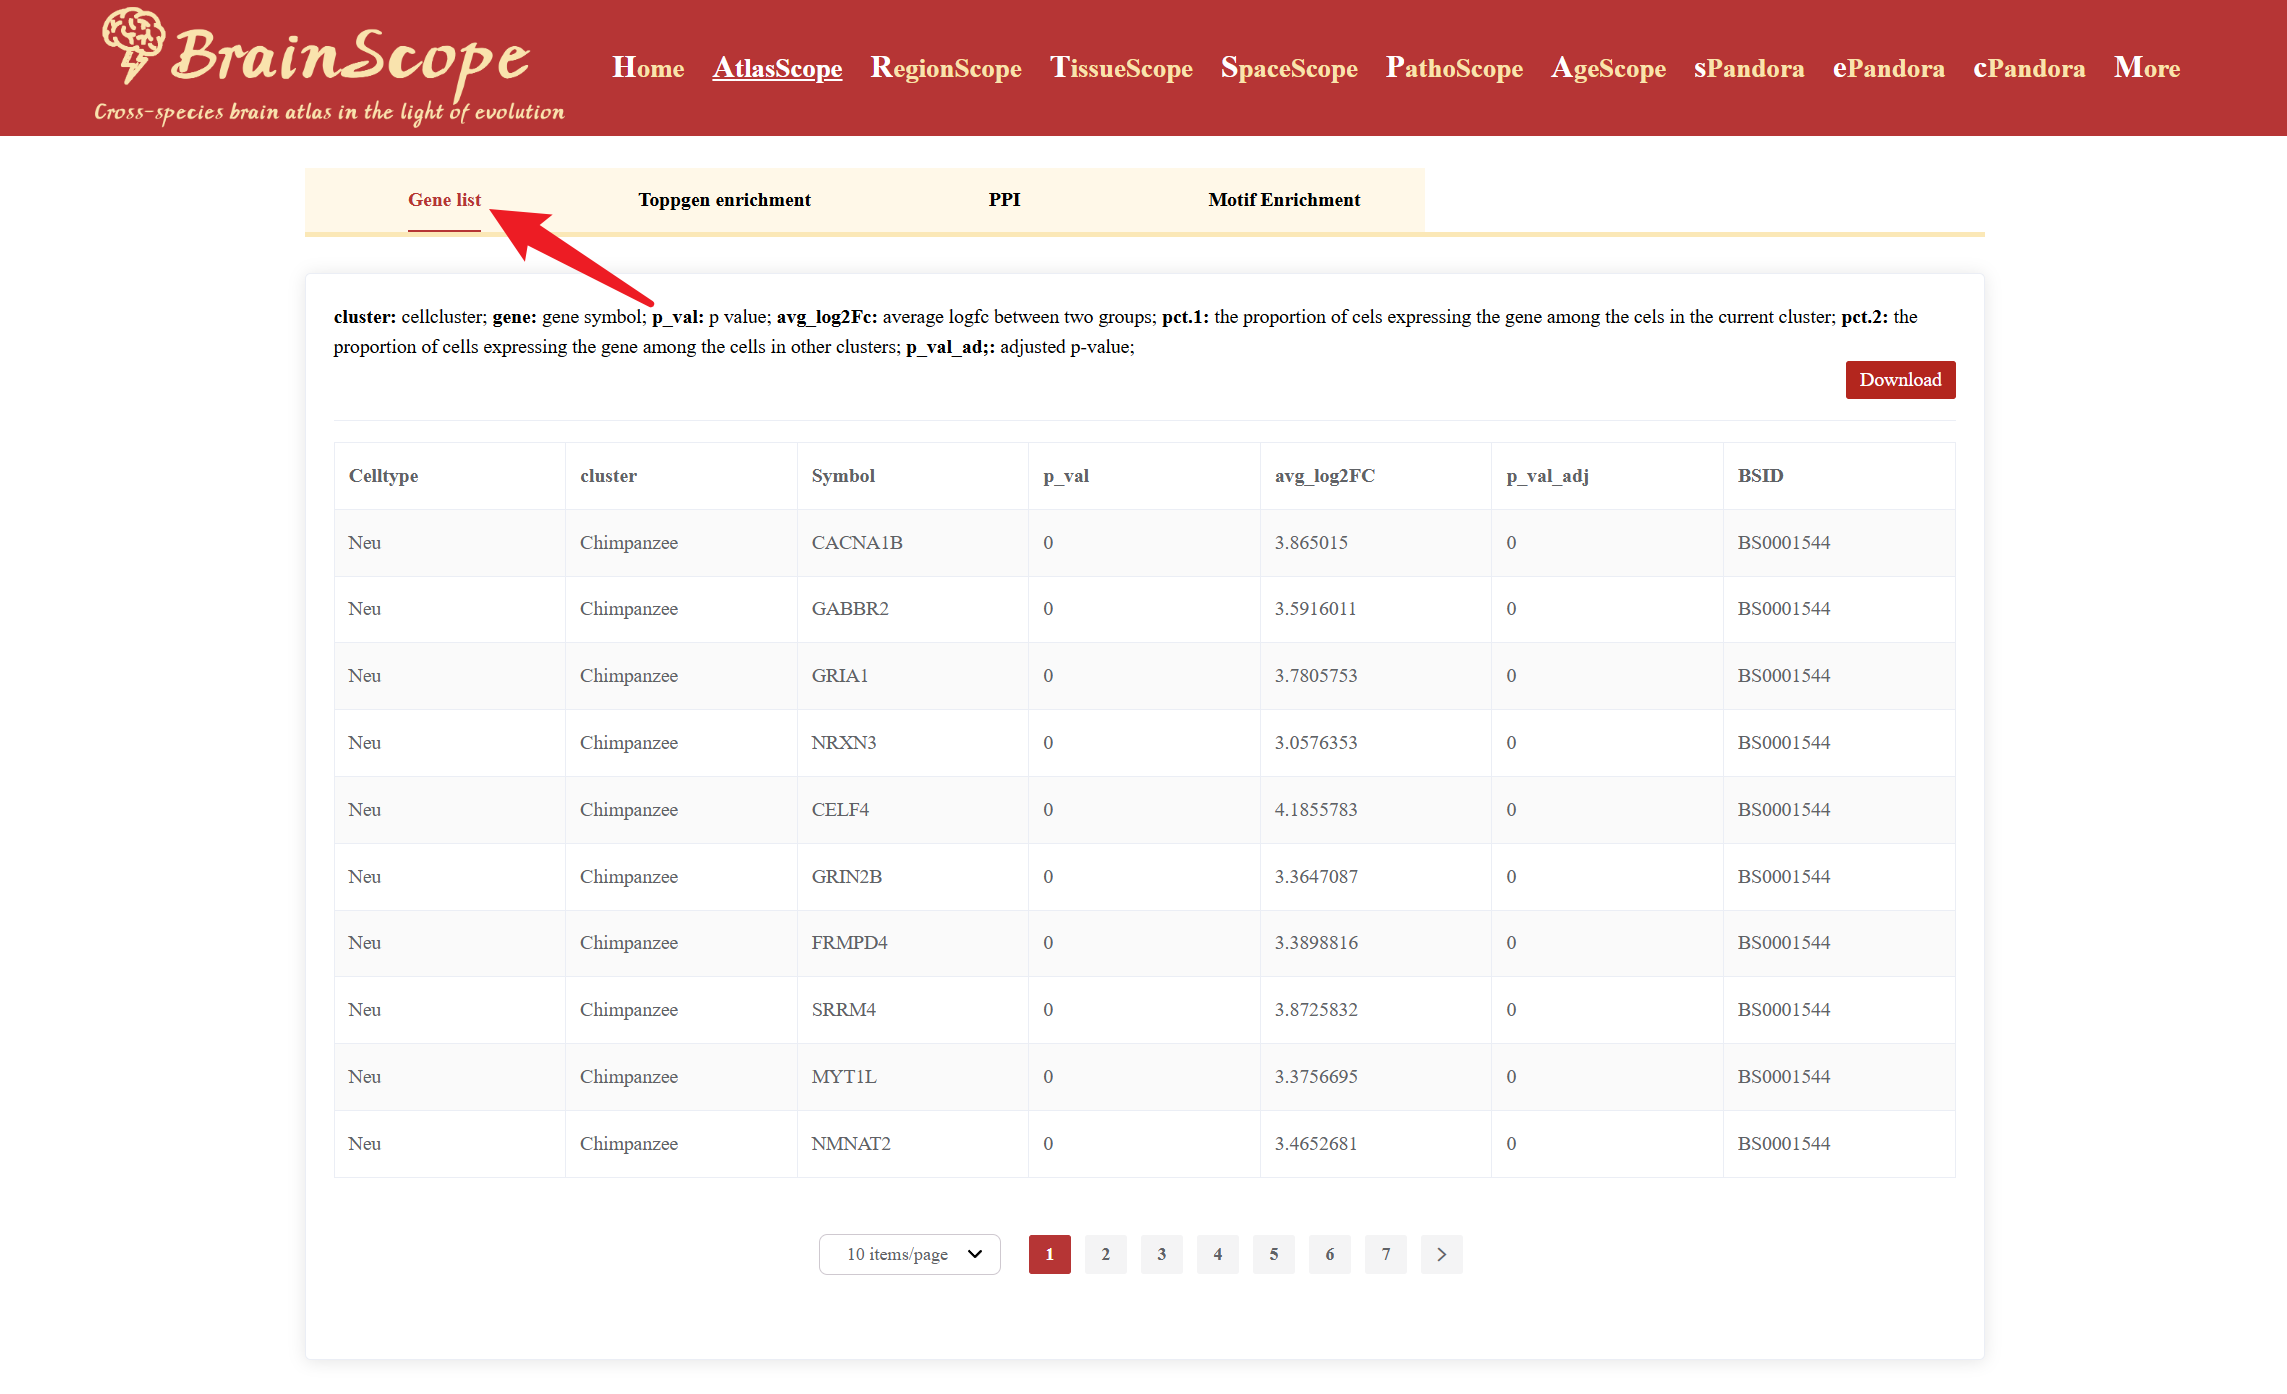
The module also allows users to perform further functional analyses on selected DEGs using the following tools: ToppGene Enrichment Analysis, PPI (Protein-Protein Interaction) Analysis, Motif Enrichment Analysis.