SpoonMan
The Wonder4Cell module offers a comprehensive atlas of eight distinct brain cell types, providing an integrated view of the cellular landscape in the brain. Each map within the L8 module focuses on a specific cell type, allowing users to explore their unique properties, gene expression profiles, and functional roles. This module is an essential resource for understanding the diversity of brain cells and their contributions to both normal and pathological brain functions, offering a valuable tool for researchers studying brain development, diseases, and cellular interactions.
VIEW HELP
Deer
Rats
Emu
Ant
Mule
Tiger
Iguana
Mammoth
Eft
Part01: Deer, Disease, Evolution, Embryogenesis, Region scope of cell populations

  • Disease
  • Evolution
  • Embryogenesis
  • Region
Explore data at the single-gene level
Features
Explore data at the single-gene level
Features
Explore data at the single-gene level
Features
Explore data at the single-gene level
Features
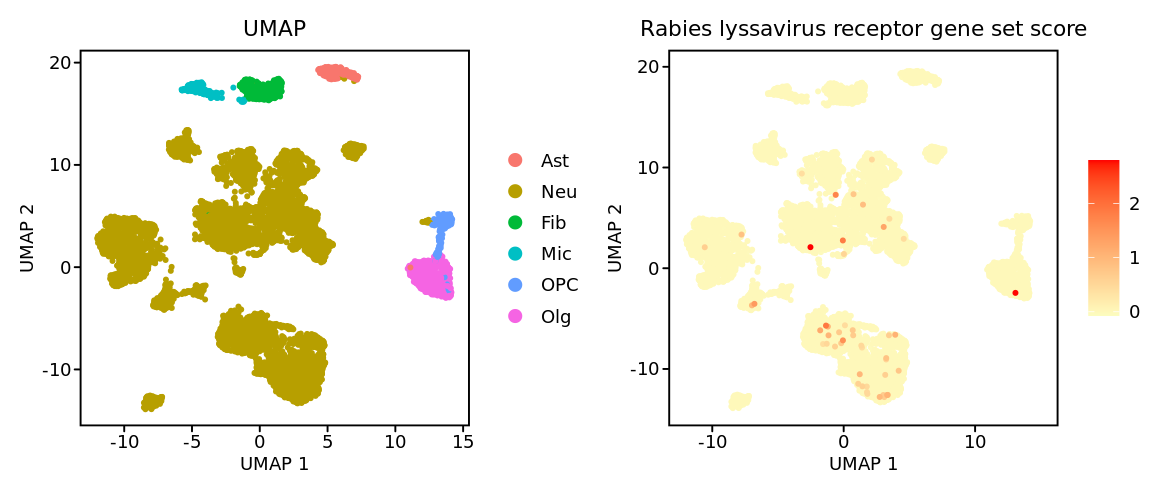
Part02: Rats, Receptor Aided Targets screening
  • Rat_show
View virus and host information
Virus information

Virus:Rabies lyssavirus

Family:Rhabdoviridae

Host:Homo sapiens (Human)

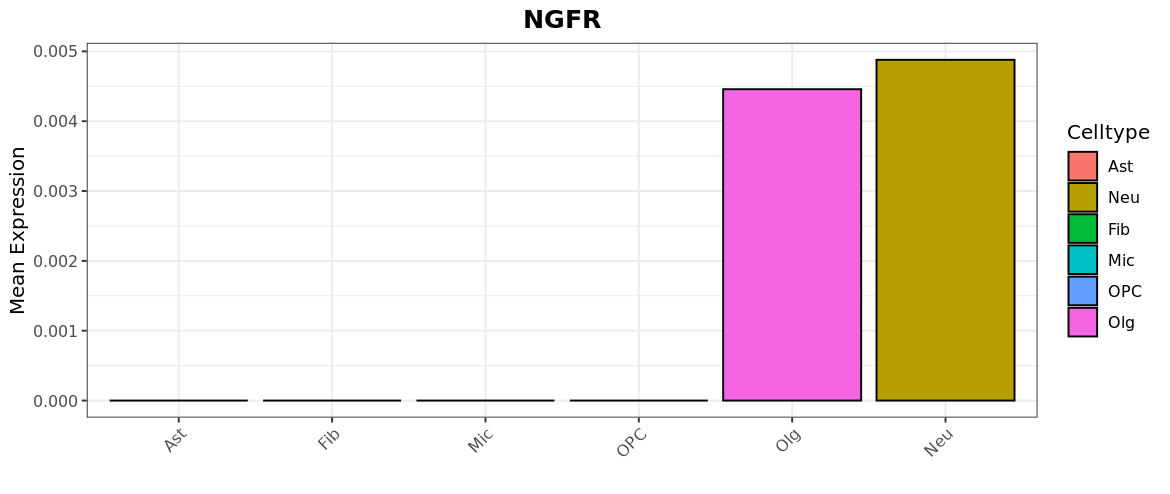
Target Gene:NGFR,NCAM1,GRM2
Dataset information

BSID: BS0001613

Classification: Mammals

CommonName: Domestic pig

LatinName: Sus scrofa

BrainRegion: M1

Timing: Adult

Diseases: Normal

Tech: Chromium

CellNum: 113741

Title: Allen

Journal: Allen

PMID: NA

Matrix Download : Click to download

Shinycell: View data
  • All Target Gene
  • NGFR
  • NCAM1
  • GRM2

Virus target gene expression

View expression summary
Download
  • VirusID
  • Virus
  • Gene
  • Celltype
  • MeanExpression

Virus target gene expression
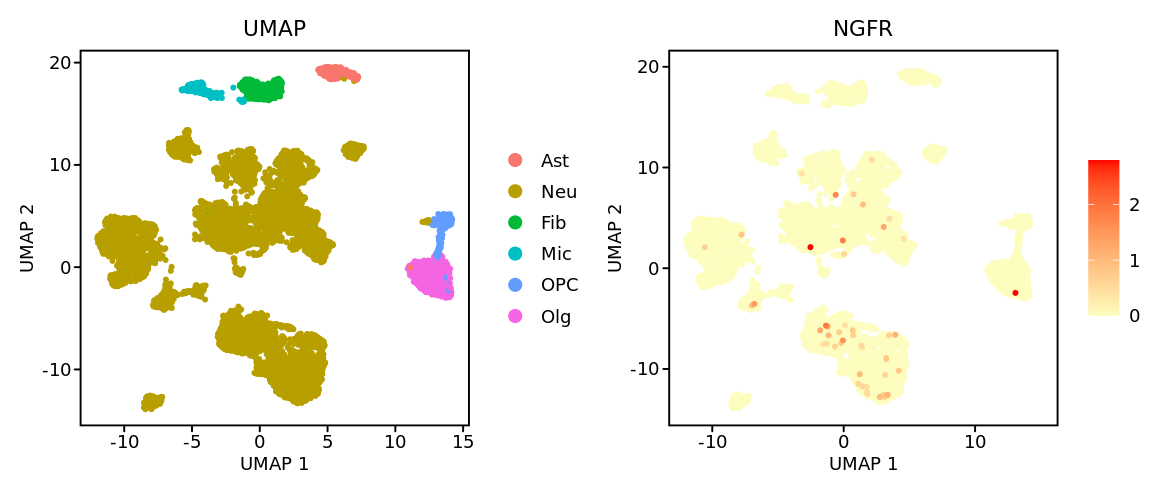
mRNA expression of NGFR in human tissues [NCBI]

Protein expression of NGFR in human tissues [Proteinatlas]

Virus target gene expression

mRNA expression of NCAM1 in human tissues [NCBI]

Protein expression of NCAM1 in human tissues [Proteinatlas]

Virus target gene expression

mRNA expression of GRM2 in human tissues [NCBI]

Protein expression of GRM2 in human tissues [Proteinatlas]

Part03: Emu, Evolution Map underlying the Tree of life

  • Turtle
Part04: ANT, Association Network infered from Transcriptome

  • Ant
    • Select
    • BriefIntro
    • Remark
    • GeneNum
    • GeneList
    • Association
    Putative positive regulators of
    Show
    entries
    Search:
    • Symbol
    • Correlation
    • P value
    • Adjusted P value
    Putative negative regulators of
    Show
    entries
    Search:
    • Symbol
    • Correlation
    • P value
    • Adjusted P value
    Part05: Mule, MolecUlar LandscapE
    • Brain Hallmark defined by 108 gene sets
    Show
    entries
    Search:
    • DimID
    • DimTitle
    • BSID
    • Detail
    Comparision across multiple cancer types
    Part06: Tiger, Trajectory Unsupervised re-construction of Key cell types

    • CytoTRACE
    View ligand-receptor mediated cellular communications
    Download
    • CytoTRACE
    • Component1
    • Component2
    • Phenotype
    Part07: Iguana, InteGrated ANnotAtion
    • POSTER enrichment
    Mode 1: select BSID
    {{ tabName }}
    • Classification
    • Species
    • Tissue
    Dataset information

    BSID: {{dataInfo.BSID}}

    Classification: {{dataInfo.Classification}}

    CommonName: {{dataInfo.CommonName}}

    LatinName: {{dataInfo.LatinName}}

    BrainRegion:{{dataInfo.Region}}

    Timing:{{dataInfo.Timing}}

    Diseases: {{dataInfo.Diseases}}

    Tech: {{dataInfo.Diseases}}

    CellNum: {{dataInfo.Tech}}

    Title: {{dataInfo.Title}}

    Journal: {{dataInfo.Journal}}

    PMID: {{dataInfo.PMID}}

    Matrix Download : Click to download

    Shinycell: View data

    Mode 2: select gene list
    • Gene List
    • scRNASeq
    • Spatial Transcriptomics
    Input Genes
    Choose a subsection
    • Dimensions
    Enter your own Gene symbols
    Only .csv and .h5ad file types accepted for online analysis. Download Demo (Detail of Demo dataset ).
    Only .csv and .h5ad file types accepted for online analysis. Download Demo (Detail of Demo dataset ).
    Top 10 Enriched Dimensions
      Top 30 Enriched Dimensions
      List of Enriched Dimensions
      • Tag
      • Intersect gene num
      • p val
      • p val adj
      Part08: Mammoth, MArkers Map for Model animal and OrTHlogous species
      • Marker
      Show
      entries
      Search:
        Part09: Eft, Enrichment of celltype DEG
        • ToppGene enrichment
        • Gene list
        • ToppGene enrichment
        • PPI
        • Motif enrichment

        Celltype: cell type; Symbol: gene symbol; p_val: p value; avg_log2FC: average logfc between two groups; p_val_adj: adjusted p-value;

          Toppgen enrichment analysis of genelist
          Download
            • Category
            • ID
            • Name
            • PValue
            • QValueFDRBH
            • QValueFDRBY
            • Detail

            Deer
            Rats
            Emu
            Ant
            Mule
            Tiger
            Iguana
            Mammoth
            Eft