The GeneSets module allows users to explore and retrieve curated functional gene sets across 28 biological categories, each supported by detailed gene-level information and external database links. The Species module enables users to explore the expression of functional gene sets across 136 species at single-cell resolution. EvoScreening and OrganScreening allow users to visualize the expression of selected gene sets across evolutionary key species or human organs, respectively. StemAtlas, AgingScope, PathoView, and DeathMap offer focused expression analysis of gene sets related to stemness, aging, disease, and cell death, respectively.Each module enables users to explore these signatures across organs and cell types in human, crab-eating macaque, mouse, zebrafish and fly.
scGeneBank enables you to explore the expression of 597 gene sets, compare gene activity across species and evolutionary branches, dive into tissue- and cell-type specific patterns in human and model organism and study important biological process like stemness, aging, disease, and cell death.
-
Tutorial of Home
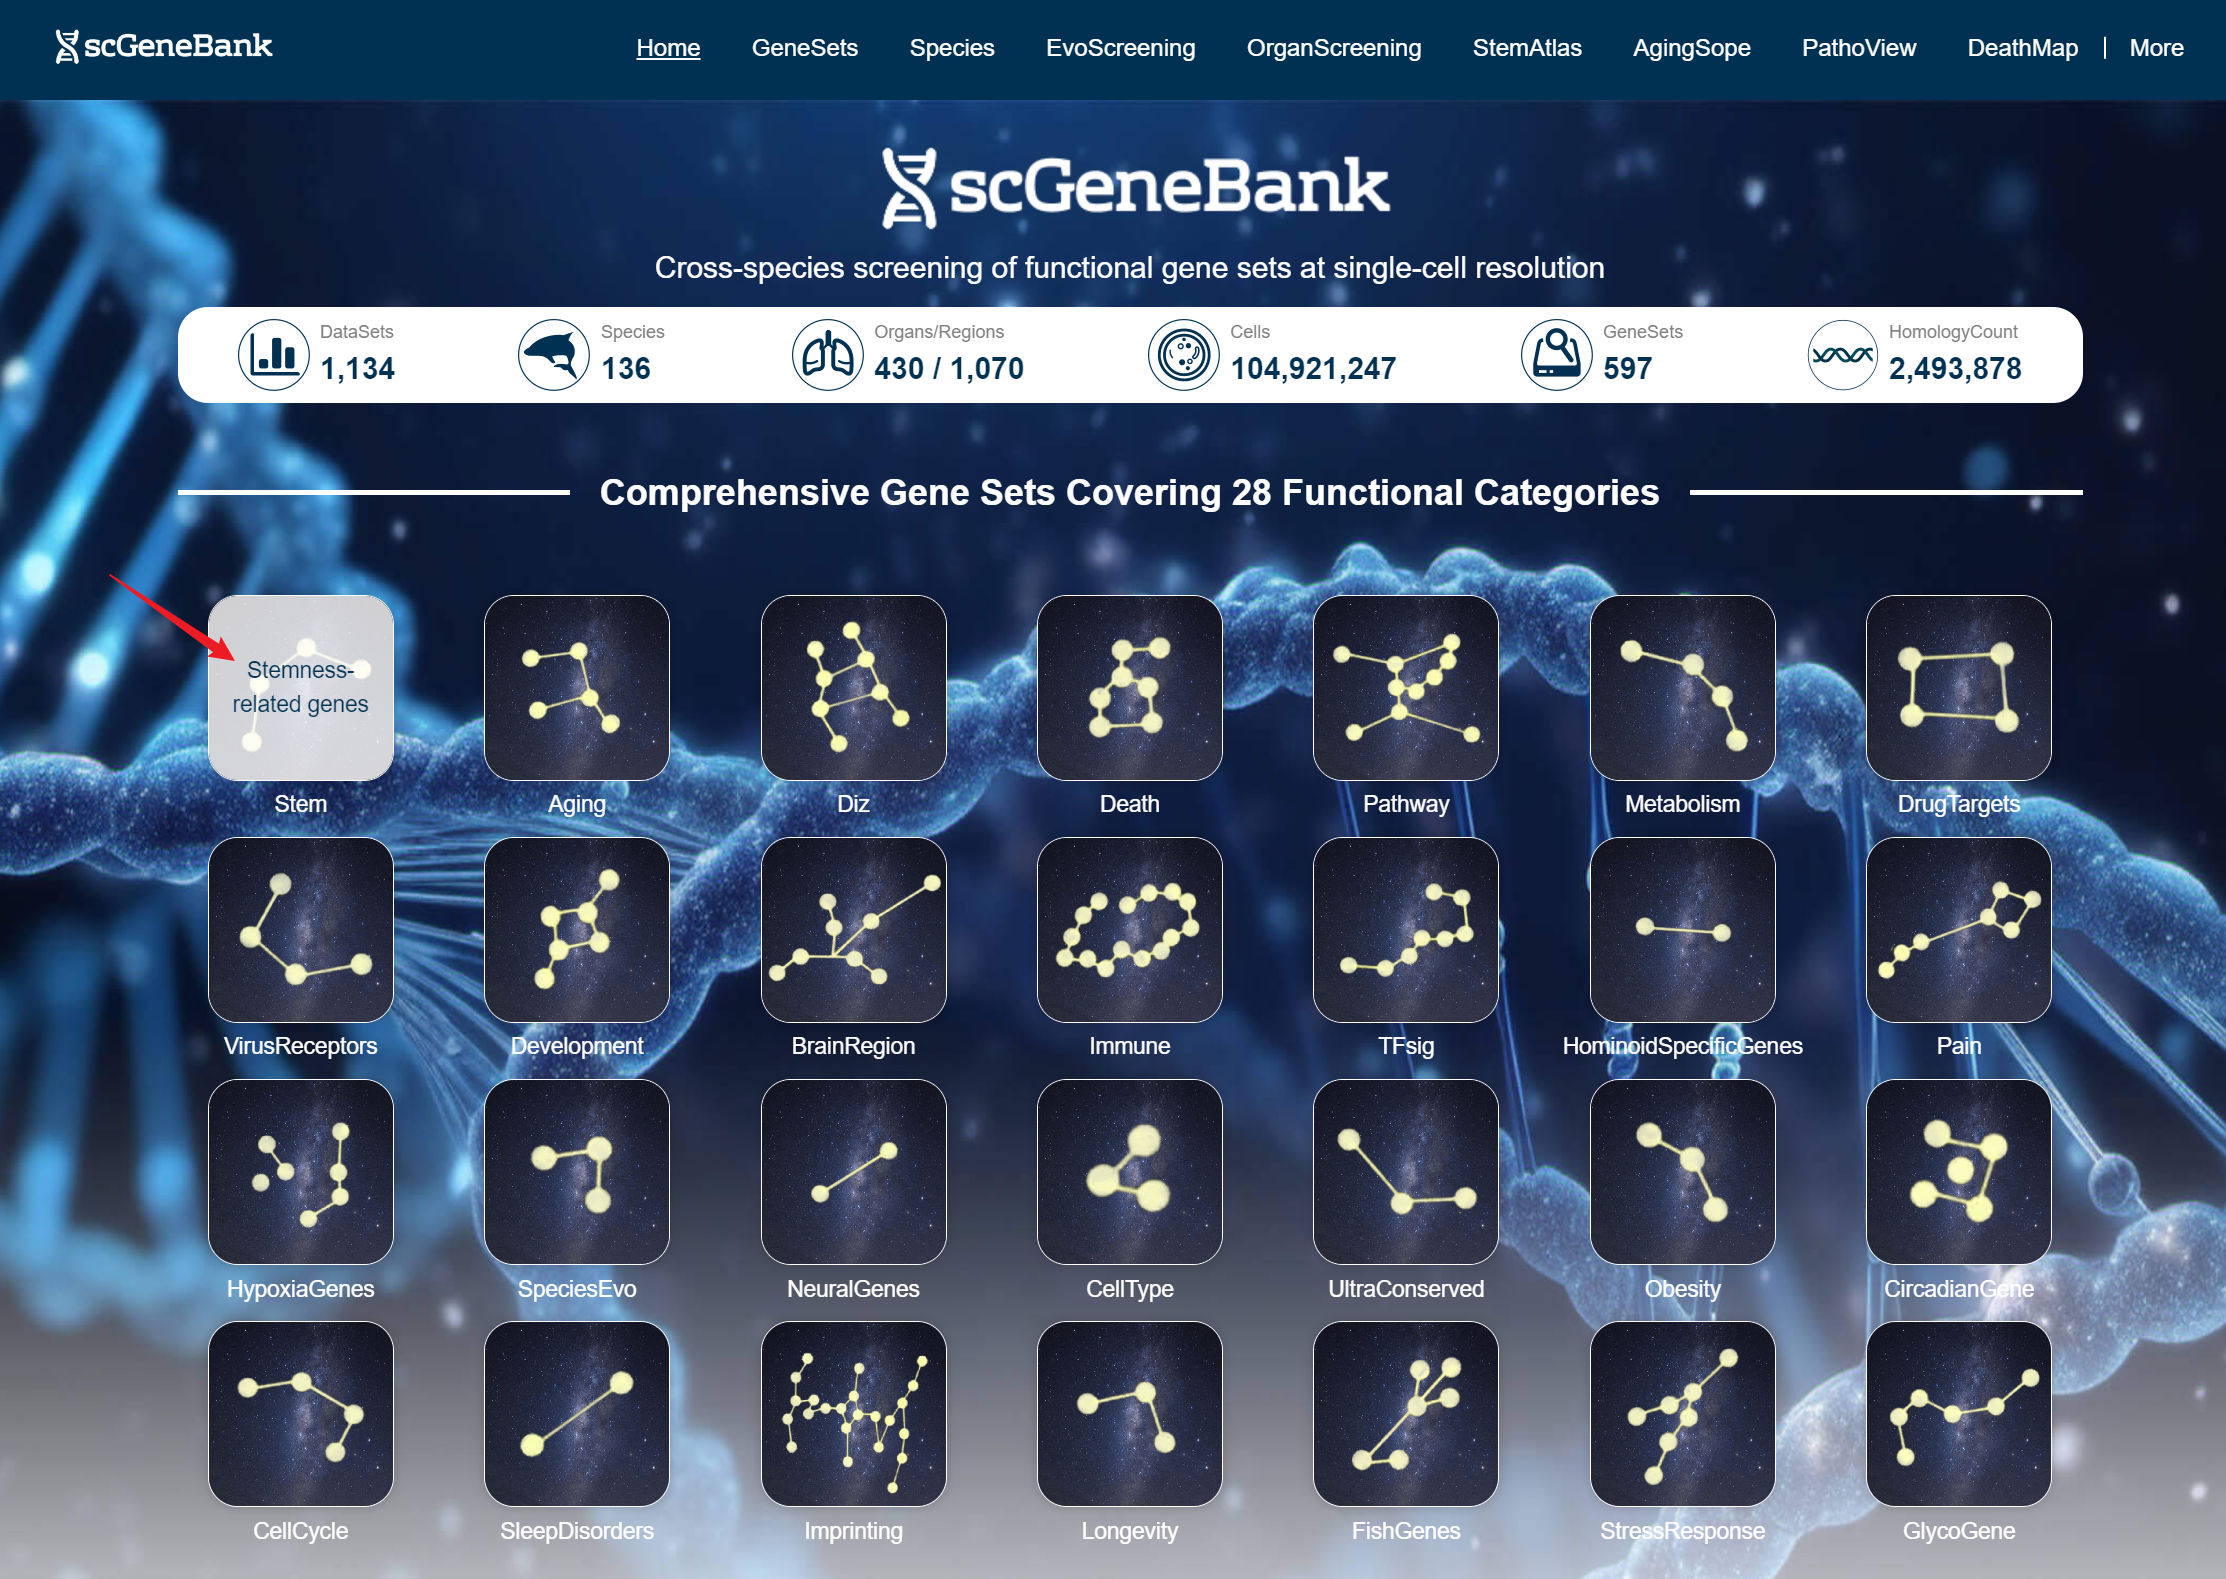
scGeneBank provides as a useful platform to explore functional gene sets across species. scGeneBank integrated 1,134 single-cell datasets, covering 136 species, 430 organs/1,070 regions, containing 104,921,247 cells, and systematically annotated 597 gene sets for 28 functional categories and 2,493,878 pairs of homologous gene relationships. Users can click the Dataset, Organs/Regions, or Cells icons at the top of the homepage to enter the Statistics page and view the corresponding details, or select the Species, GeneSets, or HomologyCount icons to navigate to dedicated pages for Species, GeneSets, and HomoGen.
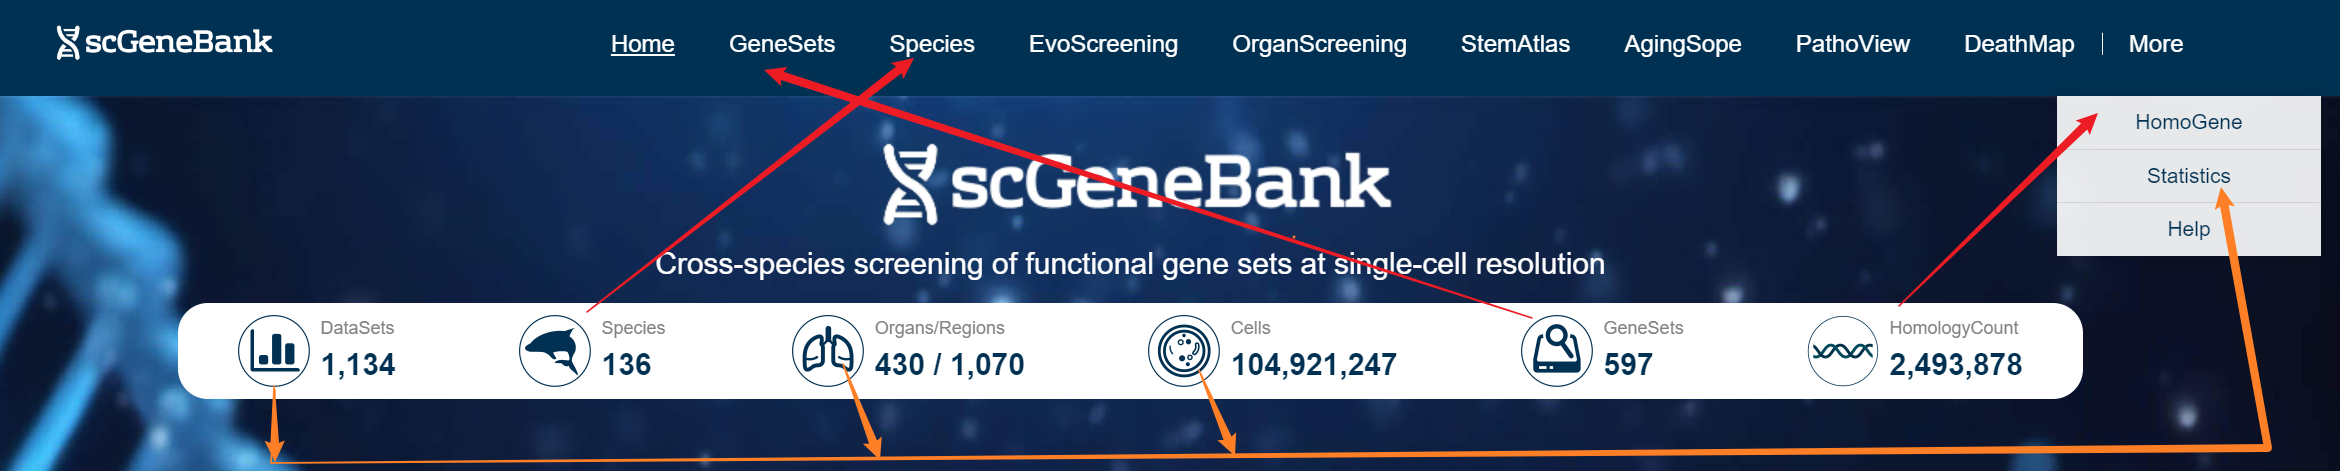
On the Home page, users can browse all 28 gene set categories and view the full list of species.
Clicking on a gene set category image directs users to the GeneSets module for further exploration.
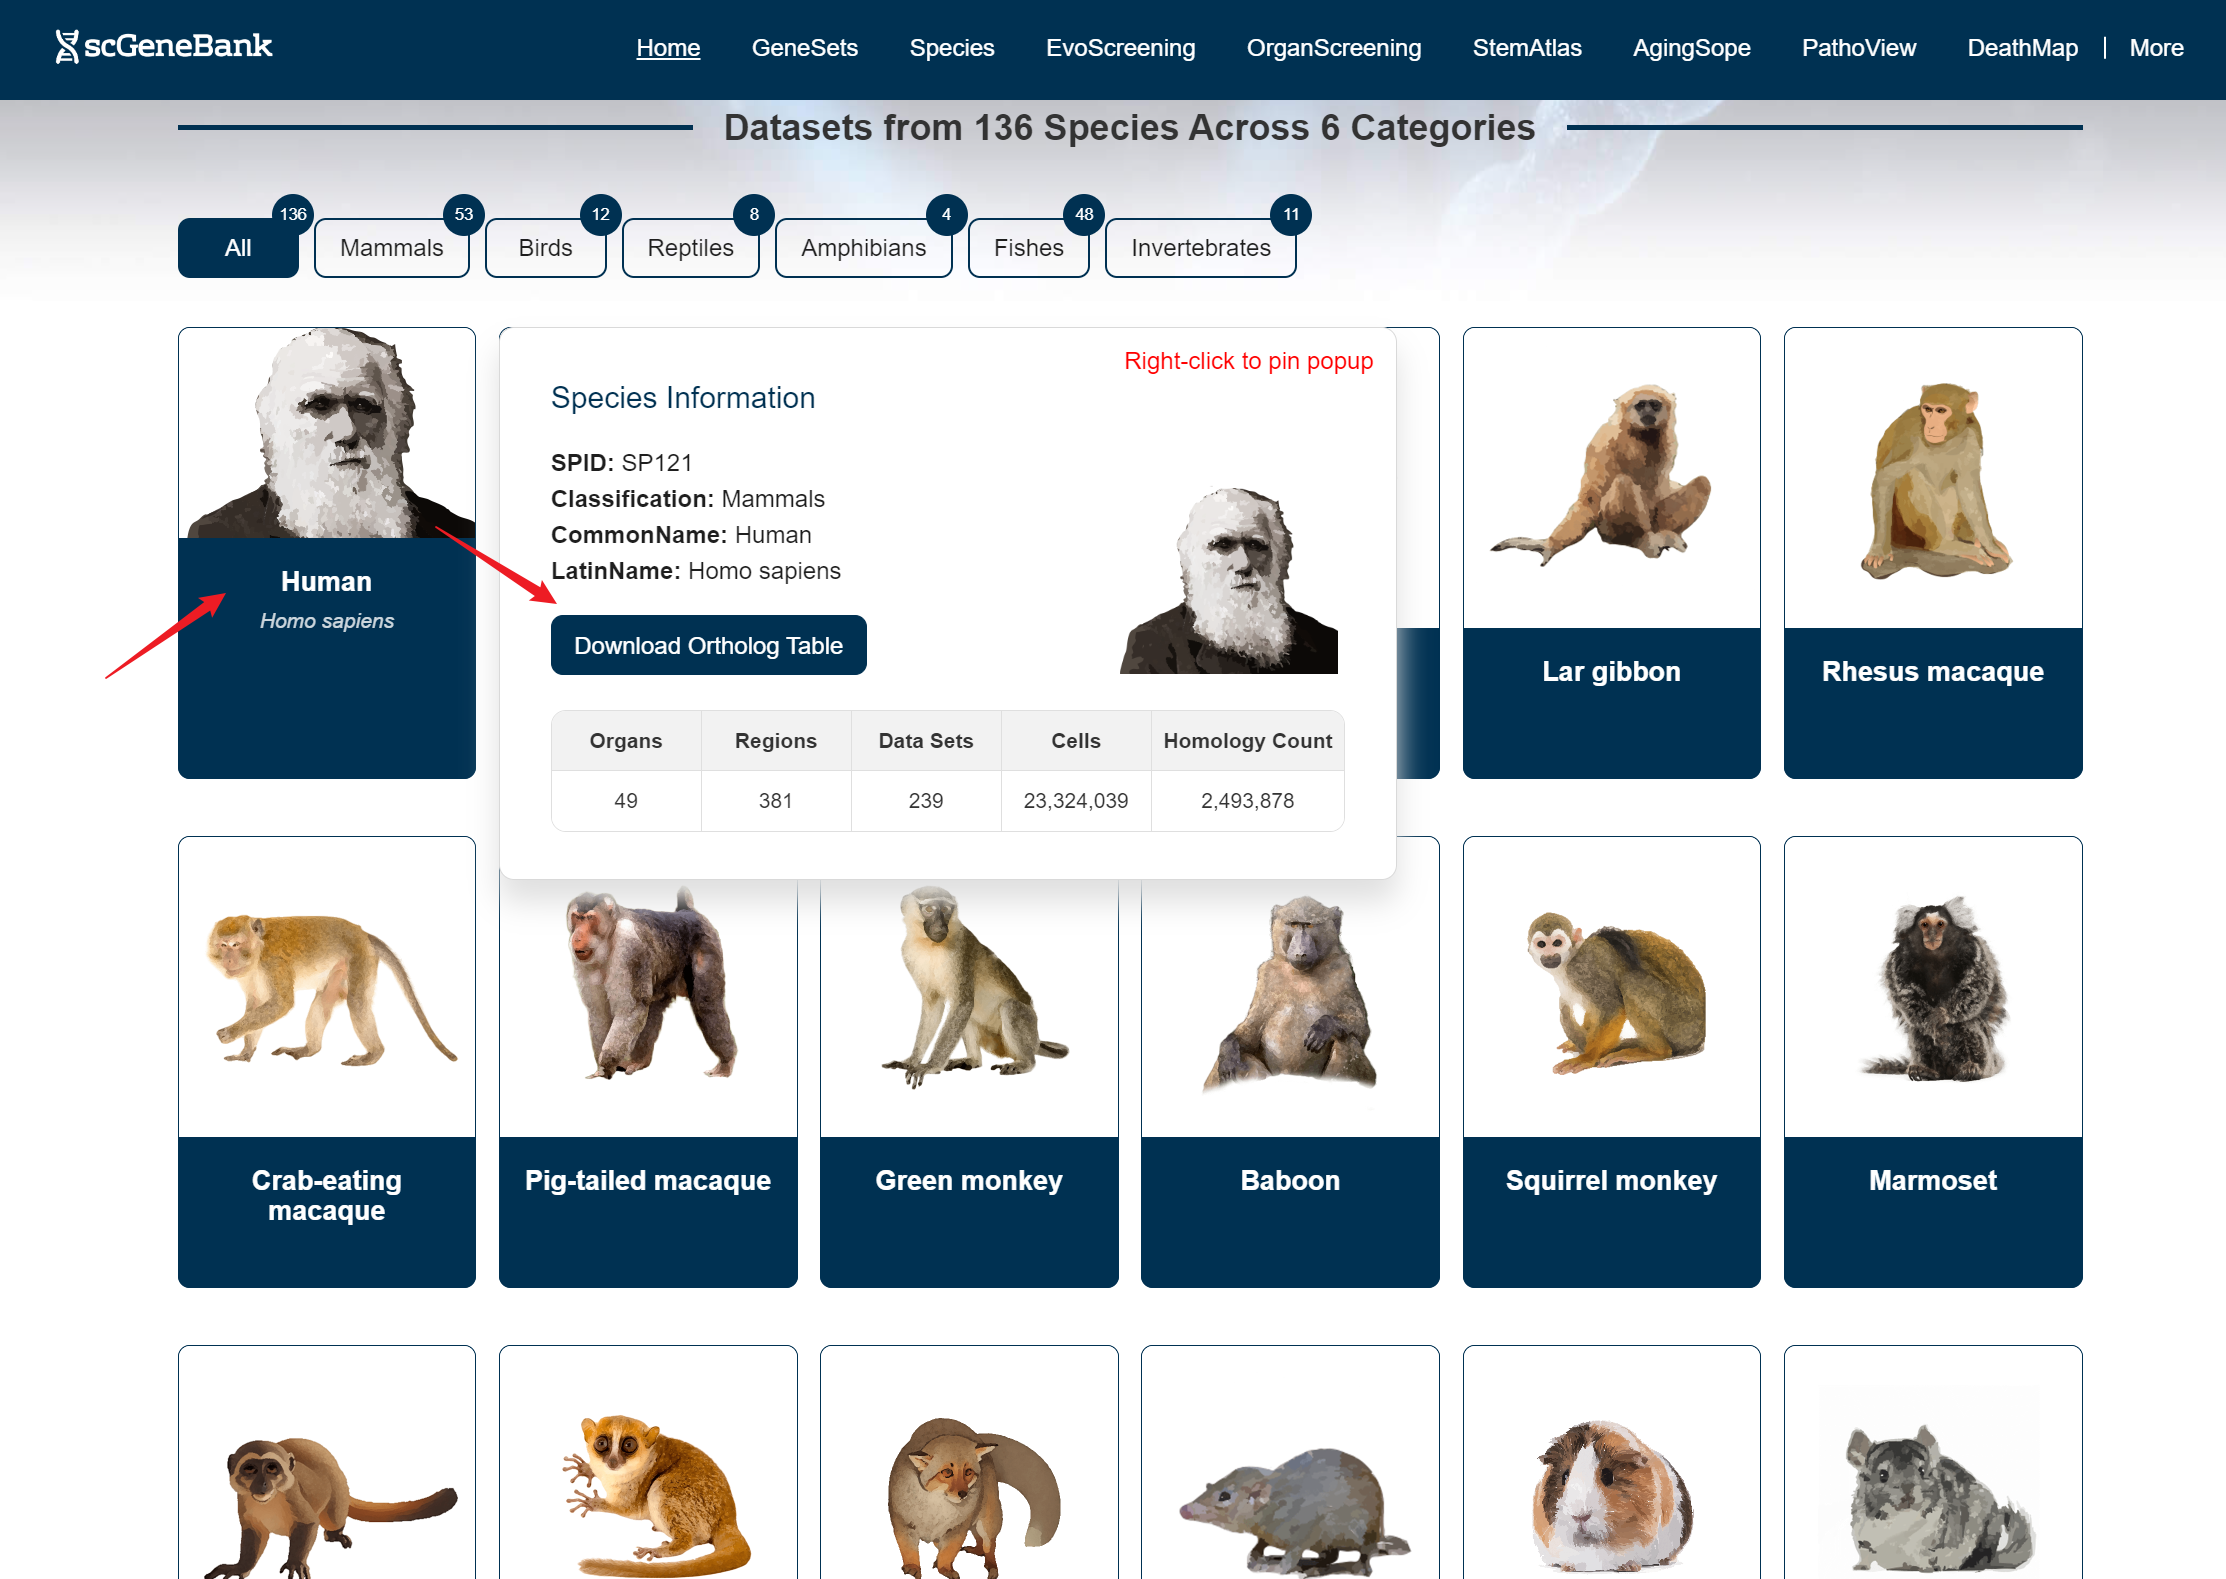
Hovering over a species image brings up an information card displaying details such as the species ID (SPID), taxonomic classification, common name, Latin name, a download button for the homology table, and dataset statistics related to that species. Clicking on a species image directs users to the Species module for further exploration.
-
Tutorial of GeneSets
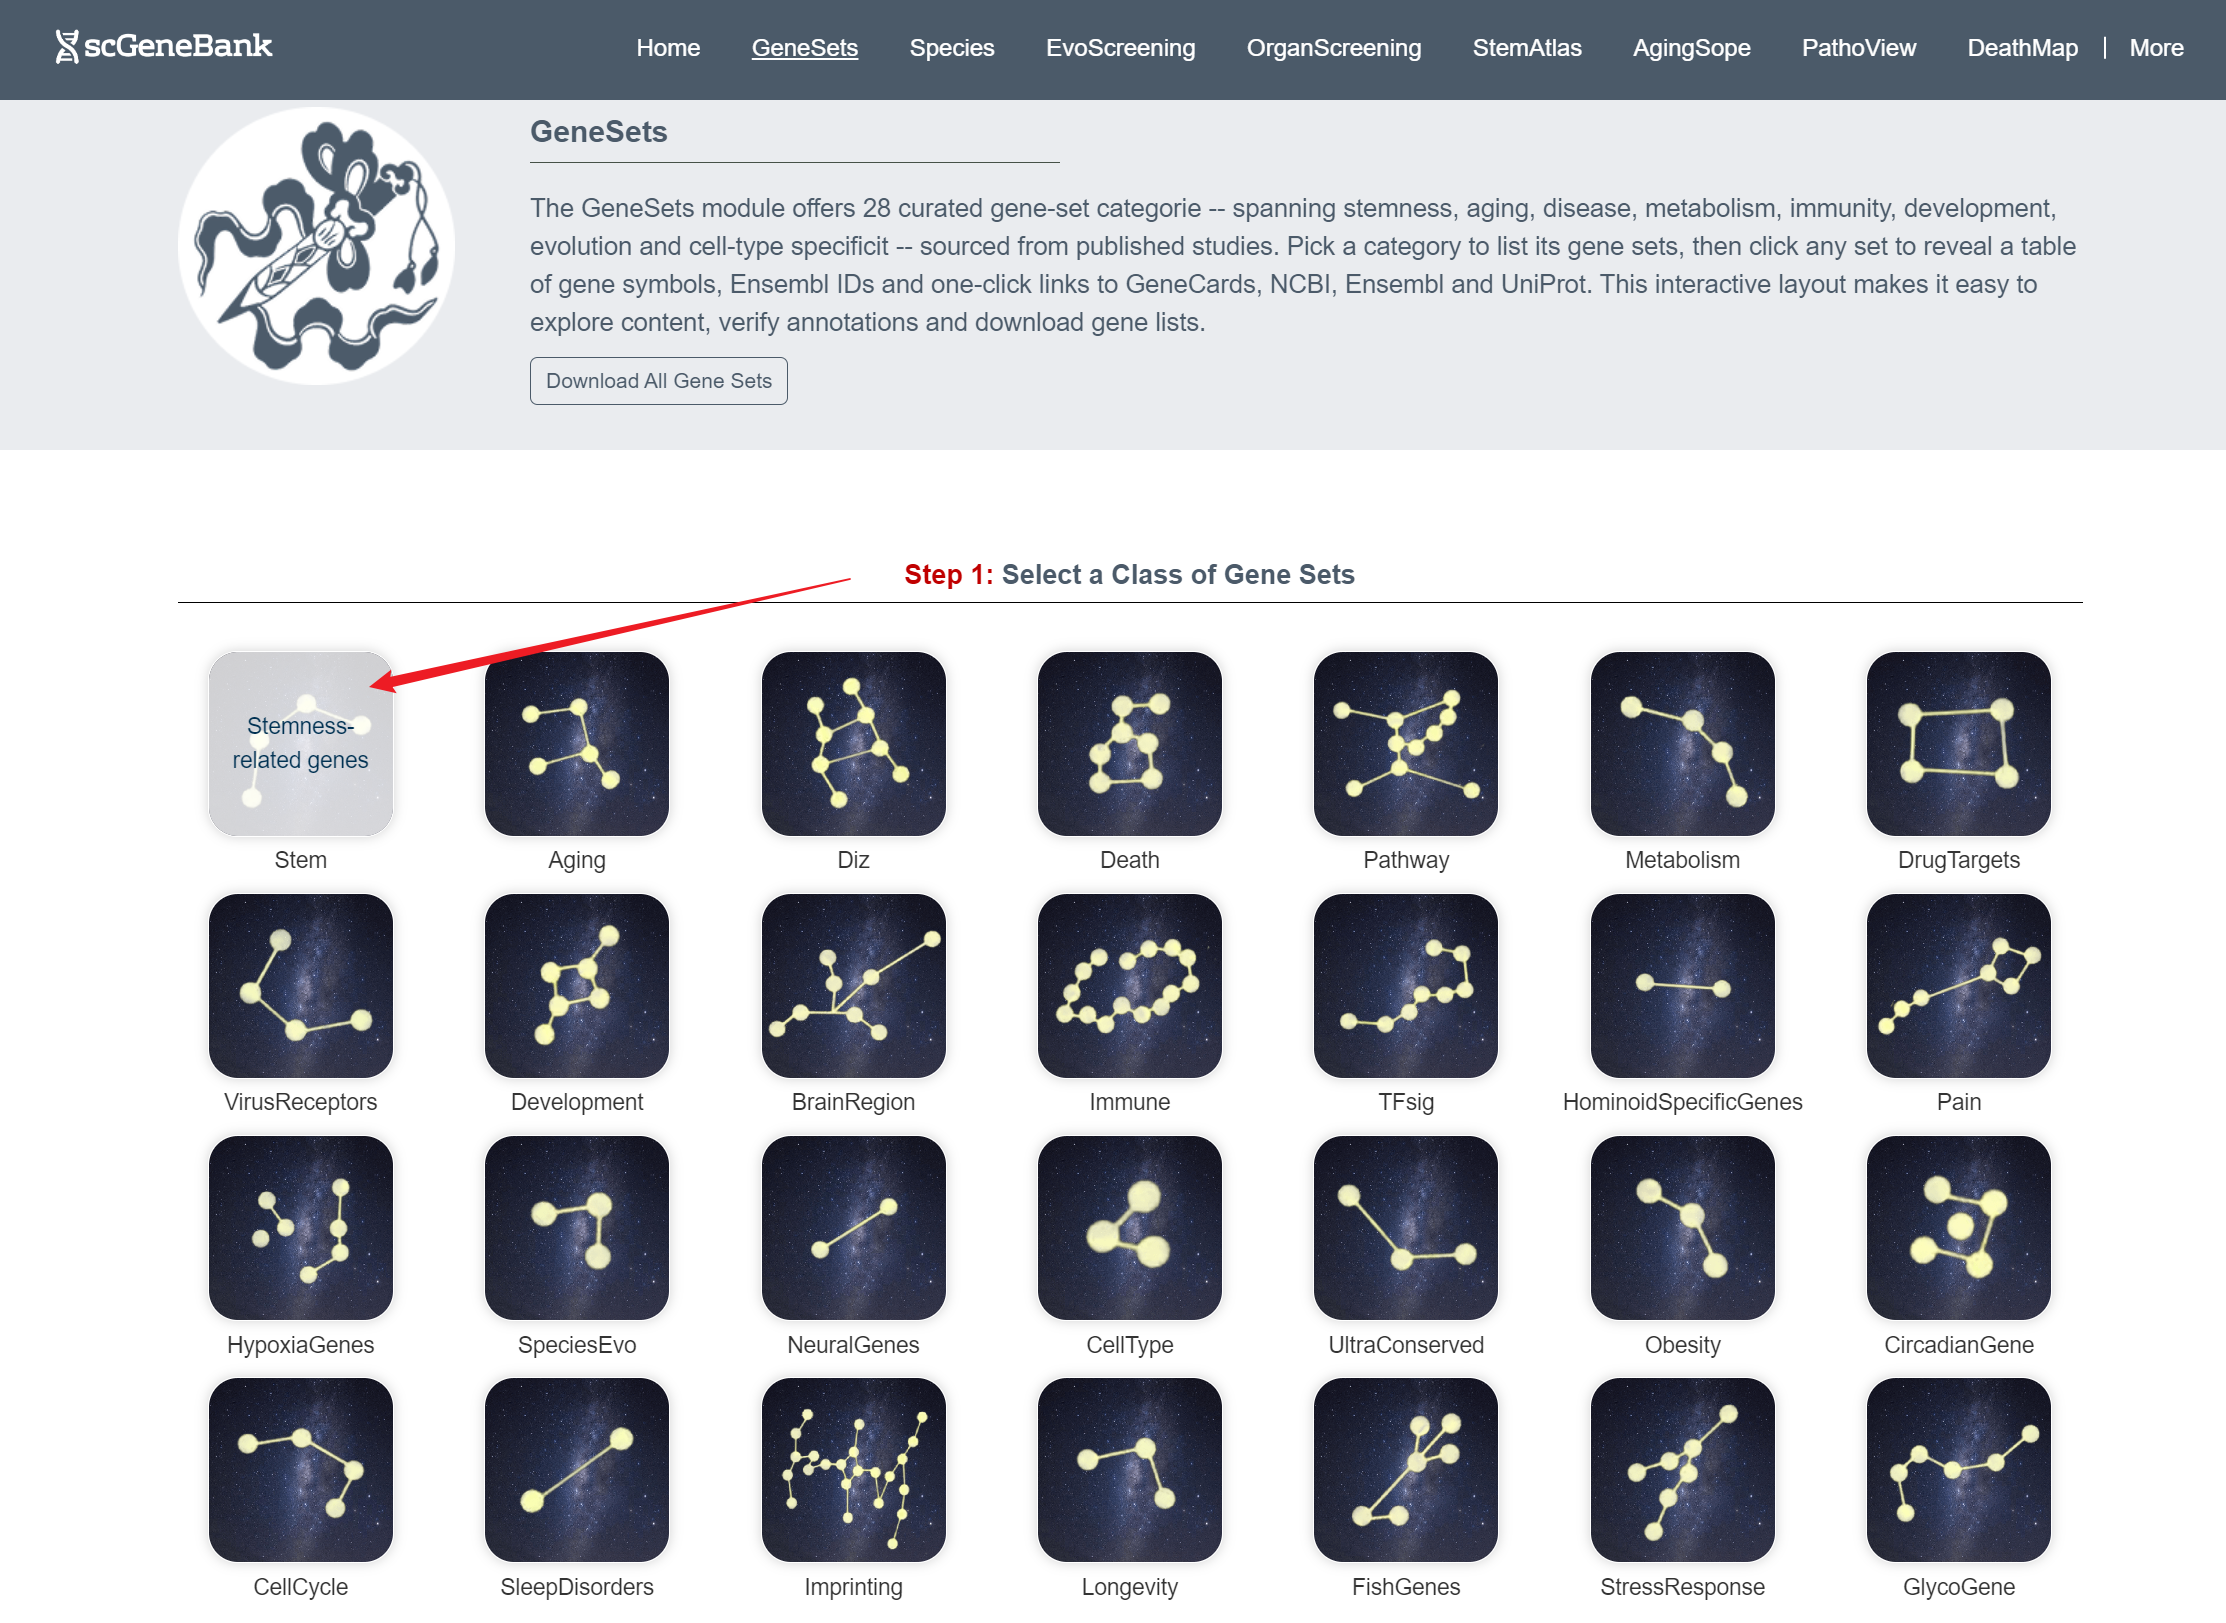
The GeneSets module provides a curated collection of 28 major categories of functional gene sets. These gene sets are derived from published studies and highlights processes related to development, evolution, and human health.
Click the “Download All Gene Sets” button to download information on all the gene sets used by this website.

When a class is selected (e.g., Stem) in the Step1 panel, users can browse all associated gene sets within that class in the Step 2 panel.
Step 1
Step 2
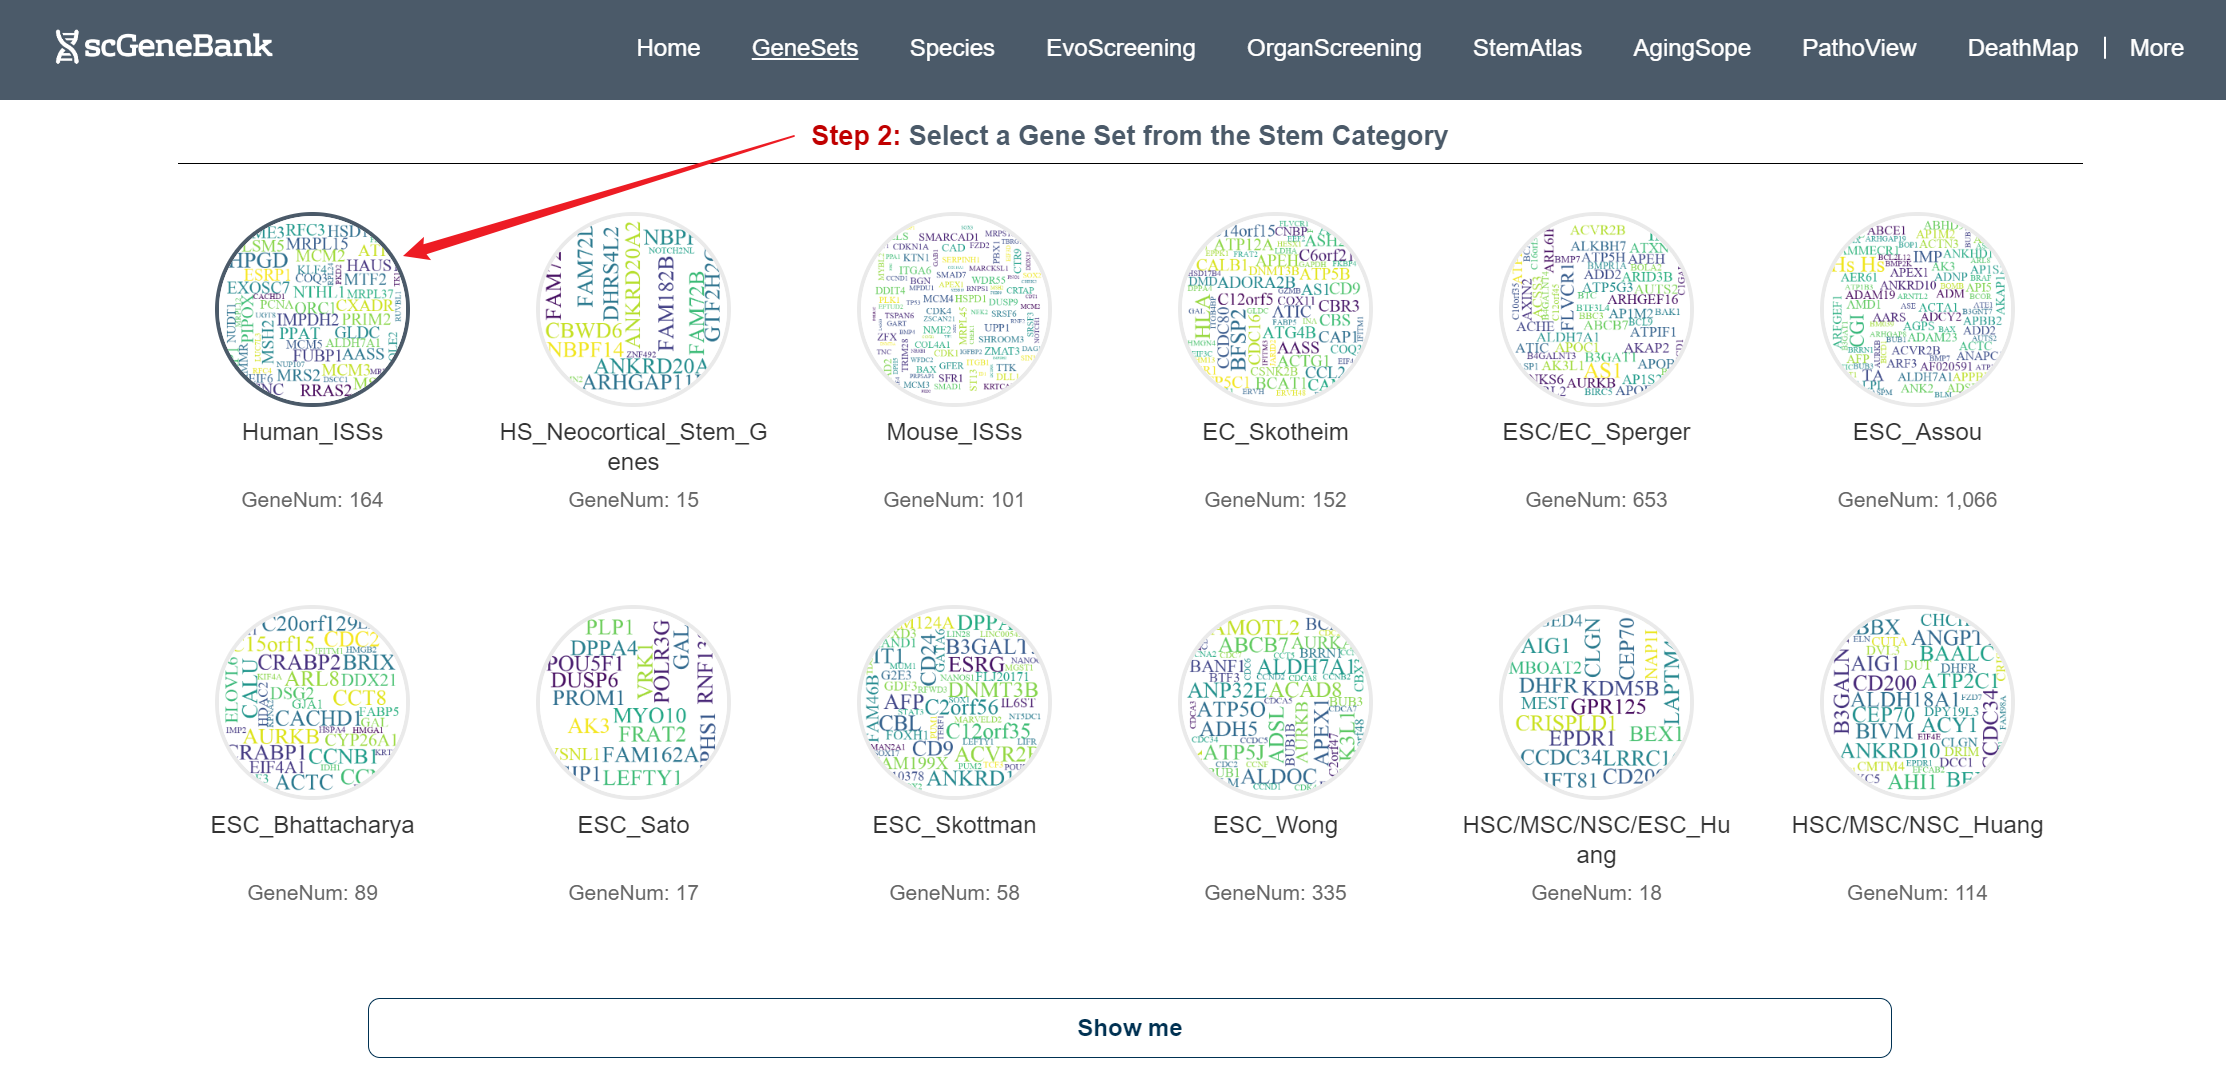
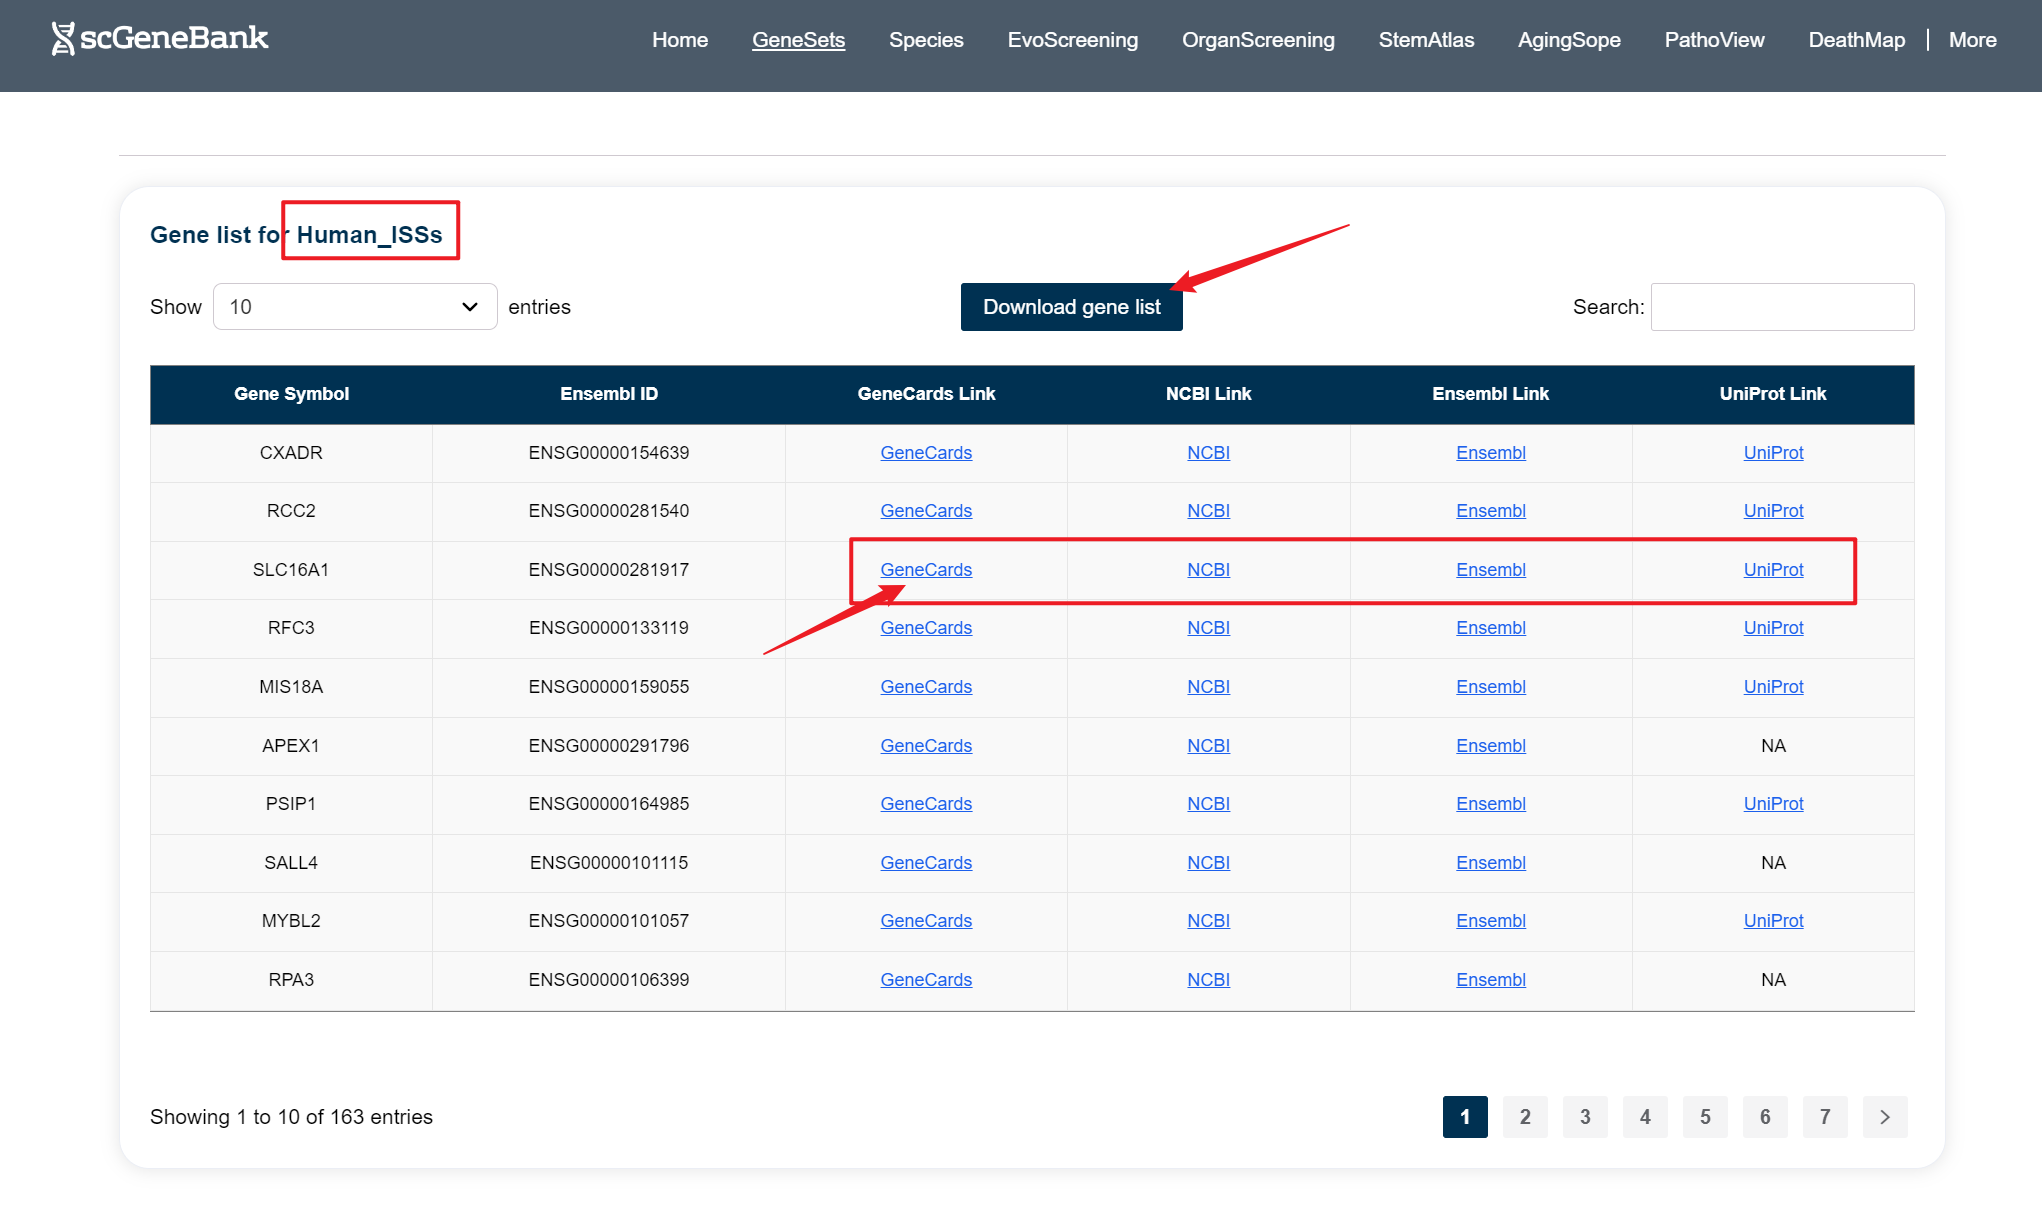
Clicking on a specific gene set reveals a detailed list of genes beneath the Step 2 panel, with each row displaying the gene symbol, Ensembl ID, and direct links to external resources including GeneCards, NCBI, Ensembl, and UniProt.
-
Tutorial of Species
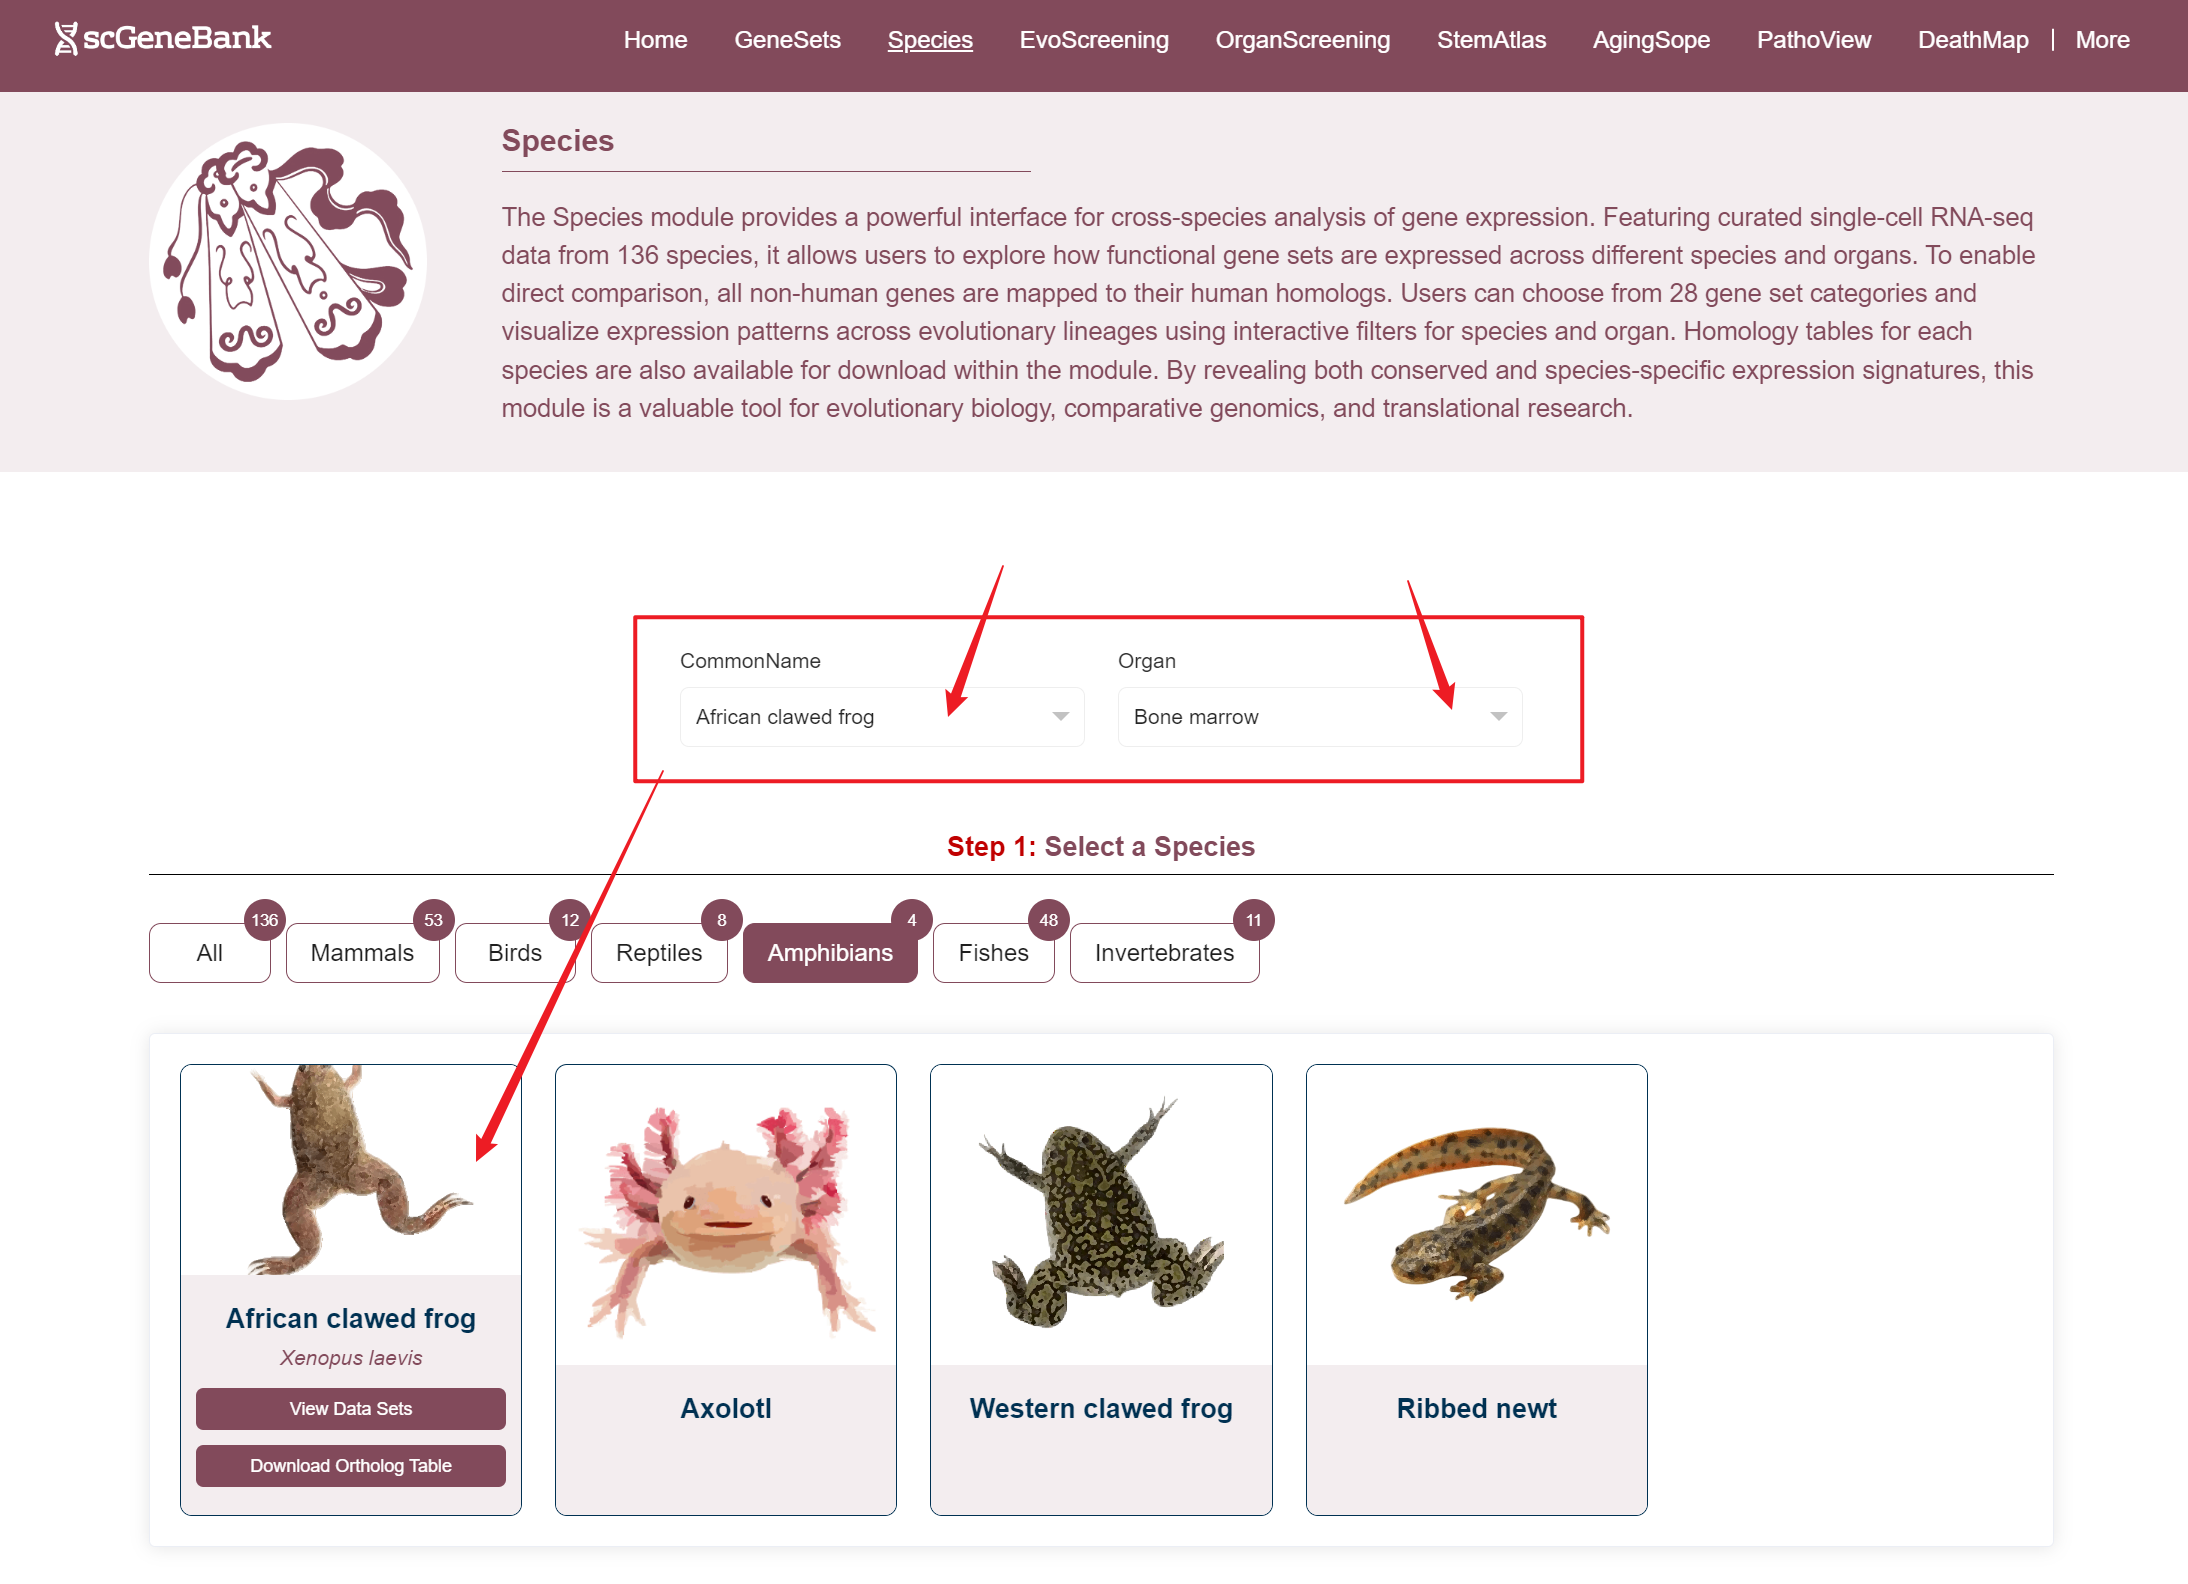
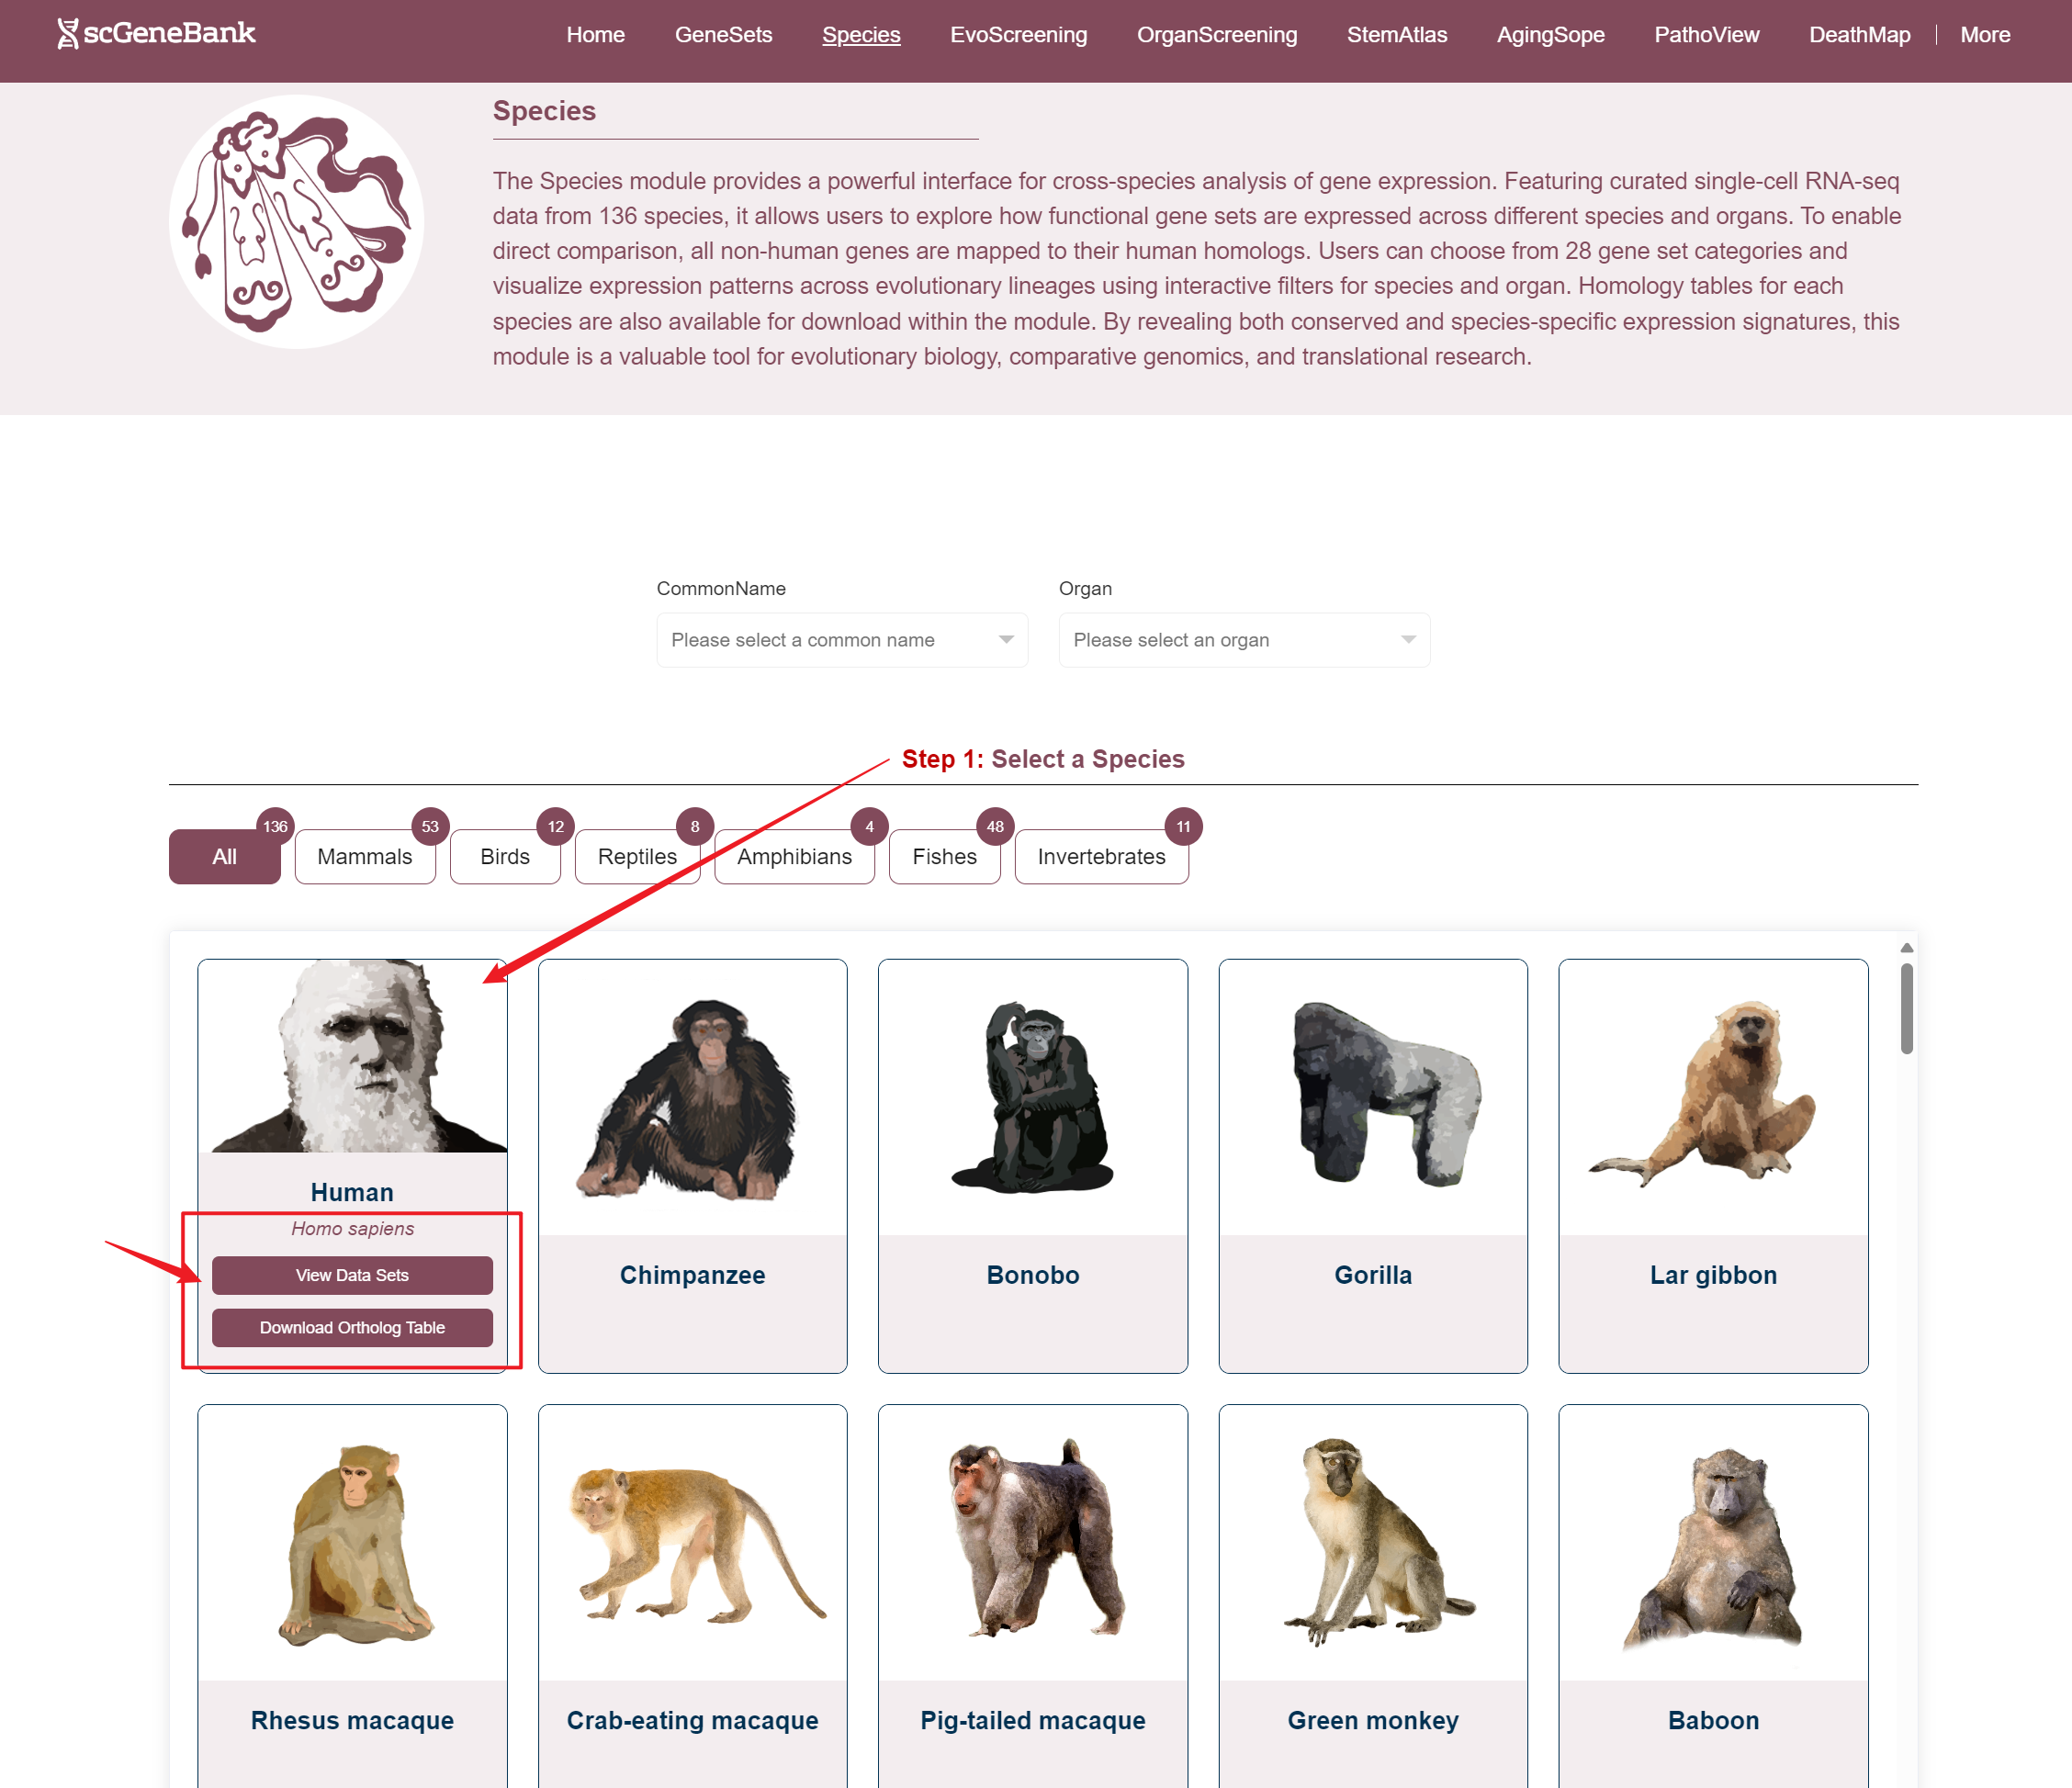
The Species module offers a powerful interface for cross-species analysis of gene expression. With curated single-cell RNA-seq data from 137 species, it enables users to explore how functional gene sets are expressed across different species and organs. Homology tables for each species are available for download directly within the module.
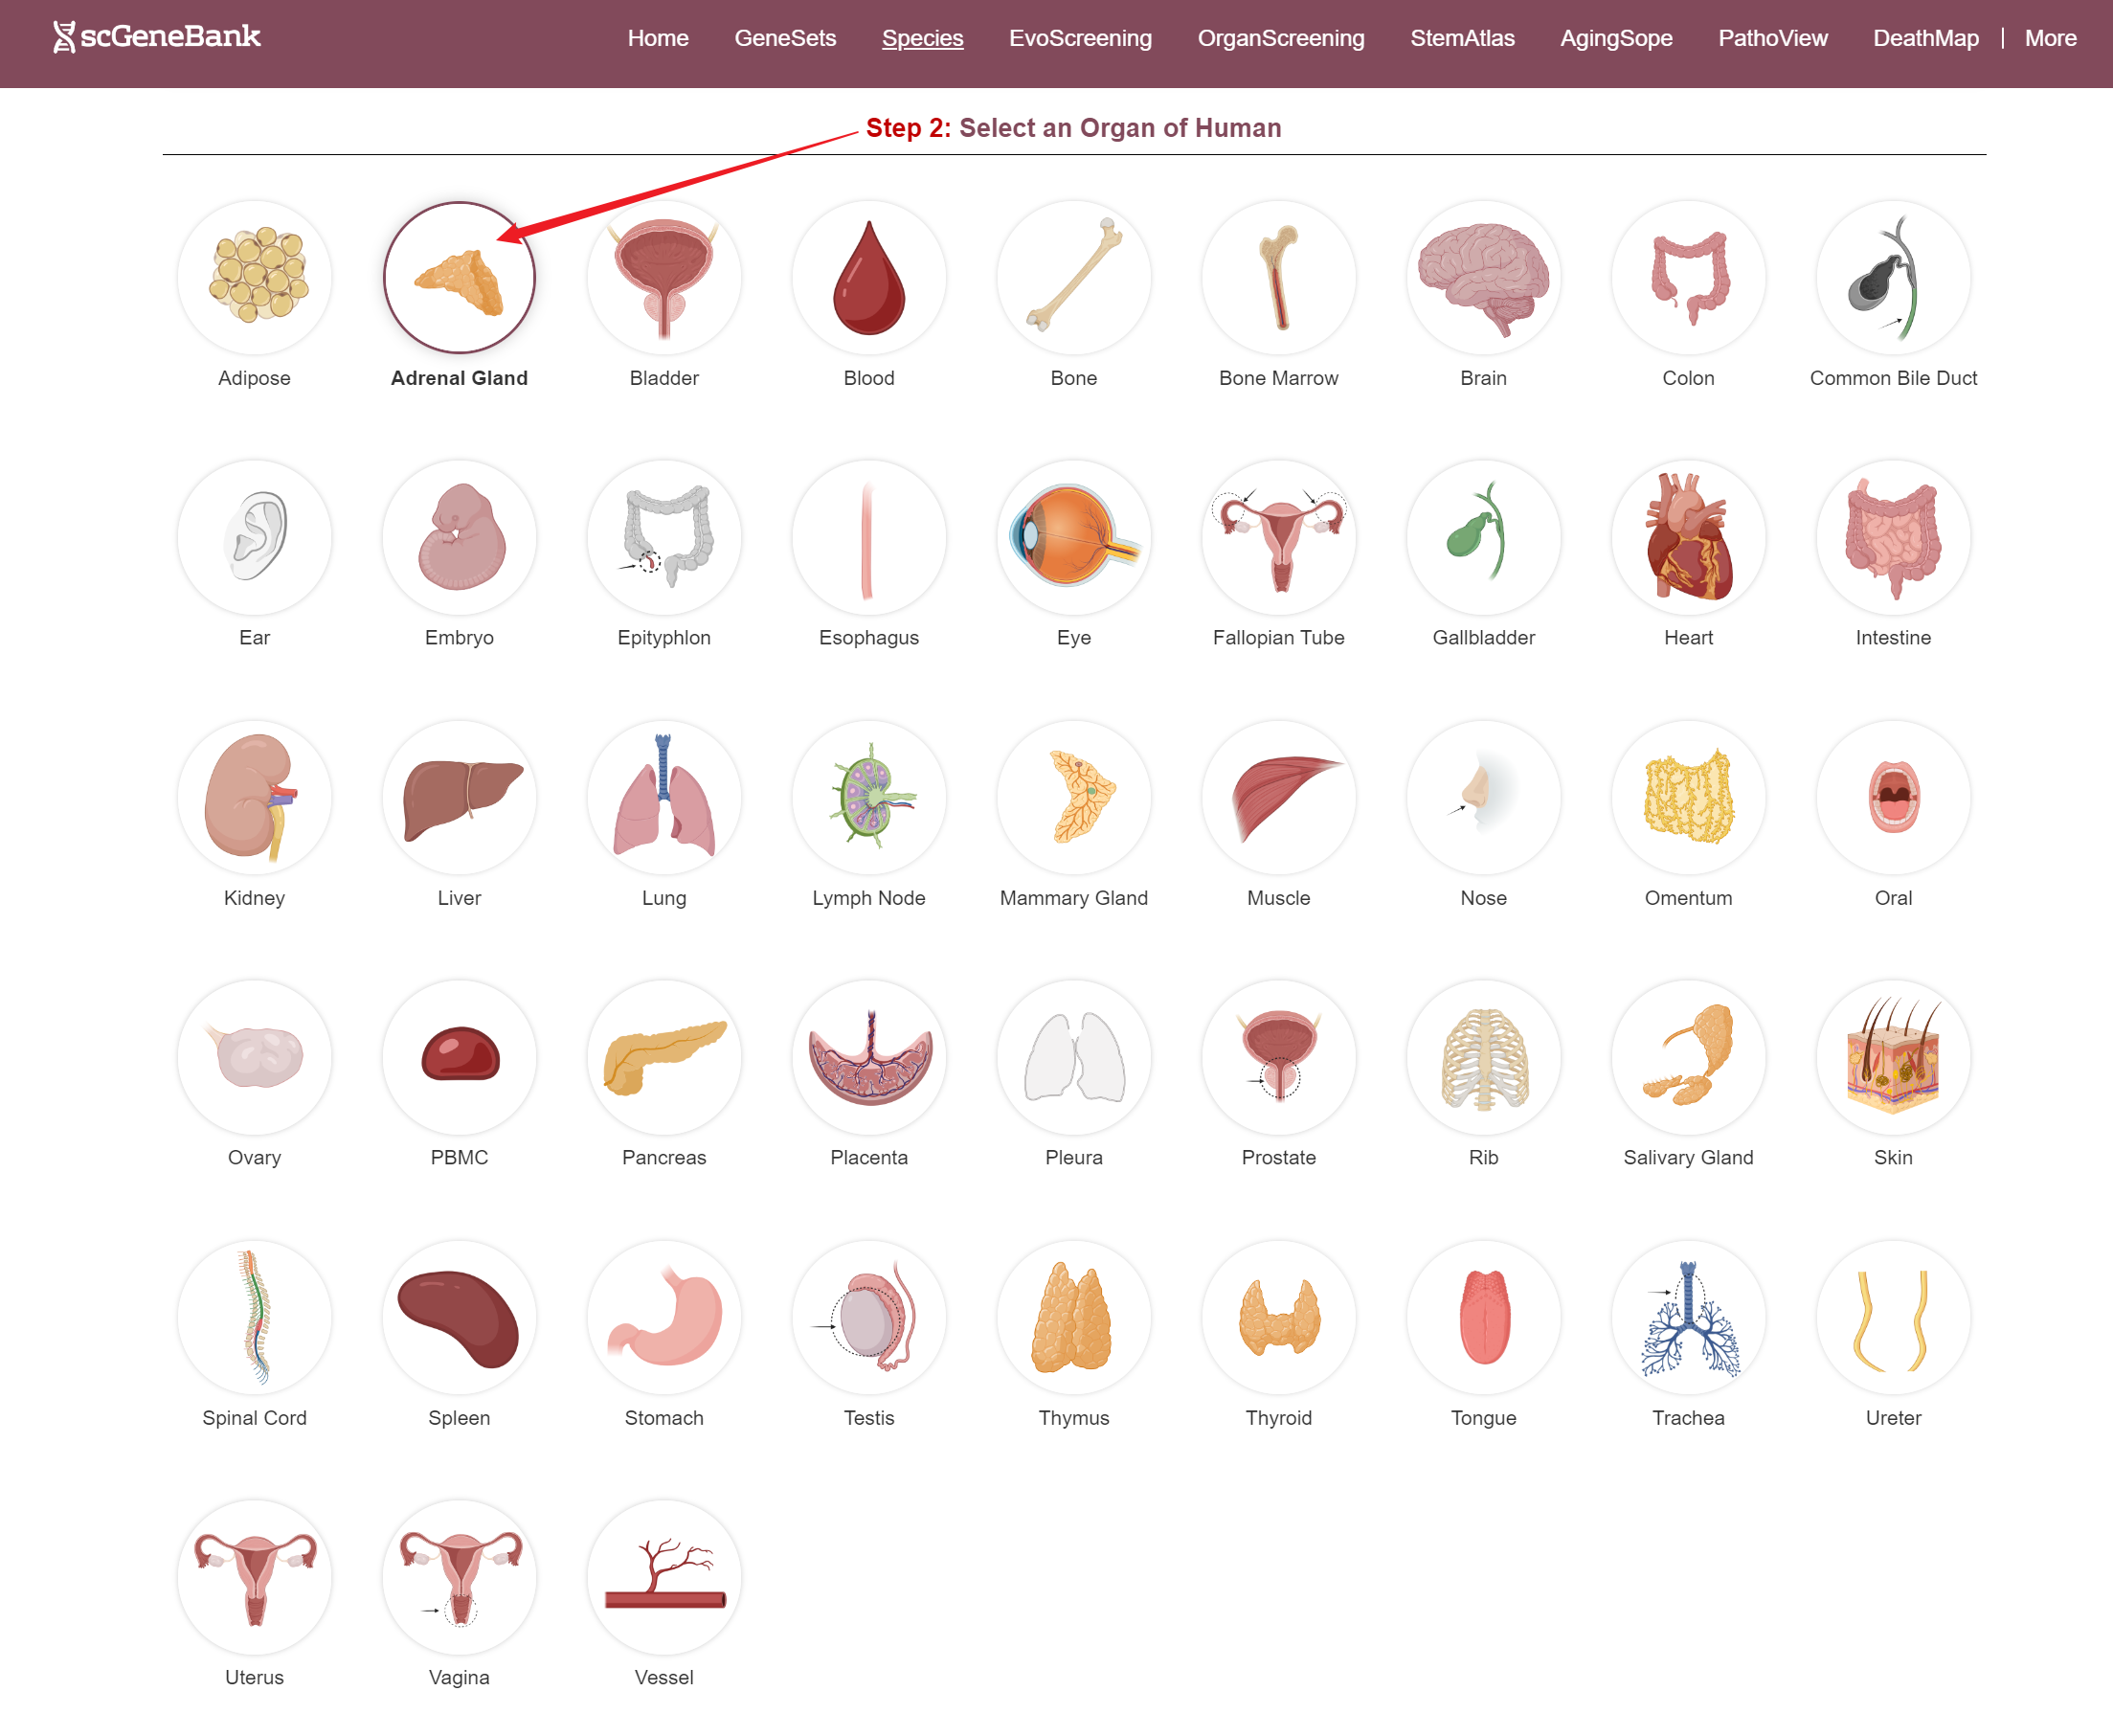
Users can access datasets in two ways: by filtering based on the species' common name and organ, or by clicking directly on a species image (in the Step 1 panel) and organ (in the Step 2 panel) to explore the data.When hovering over a species image, a tooltip appears showing the species' Latin name, a button to access related datasets, and a download option for the homology table.
Way 1
Way 2
Step 1
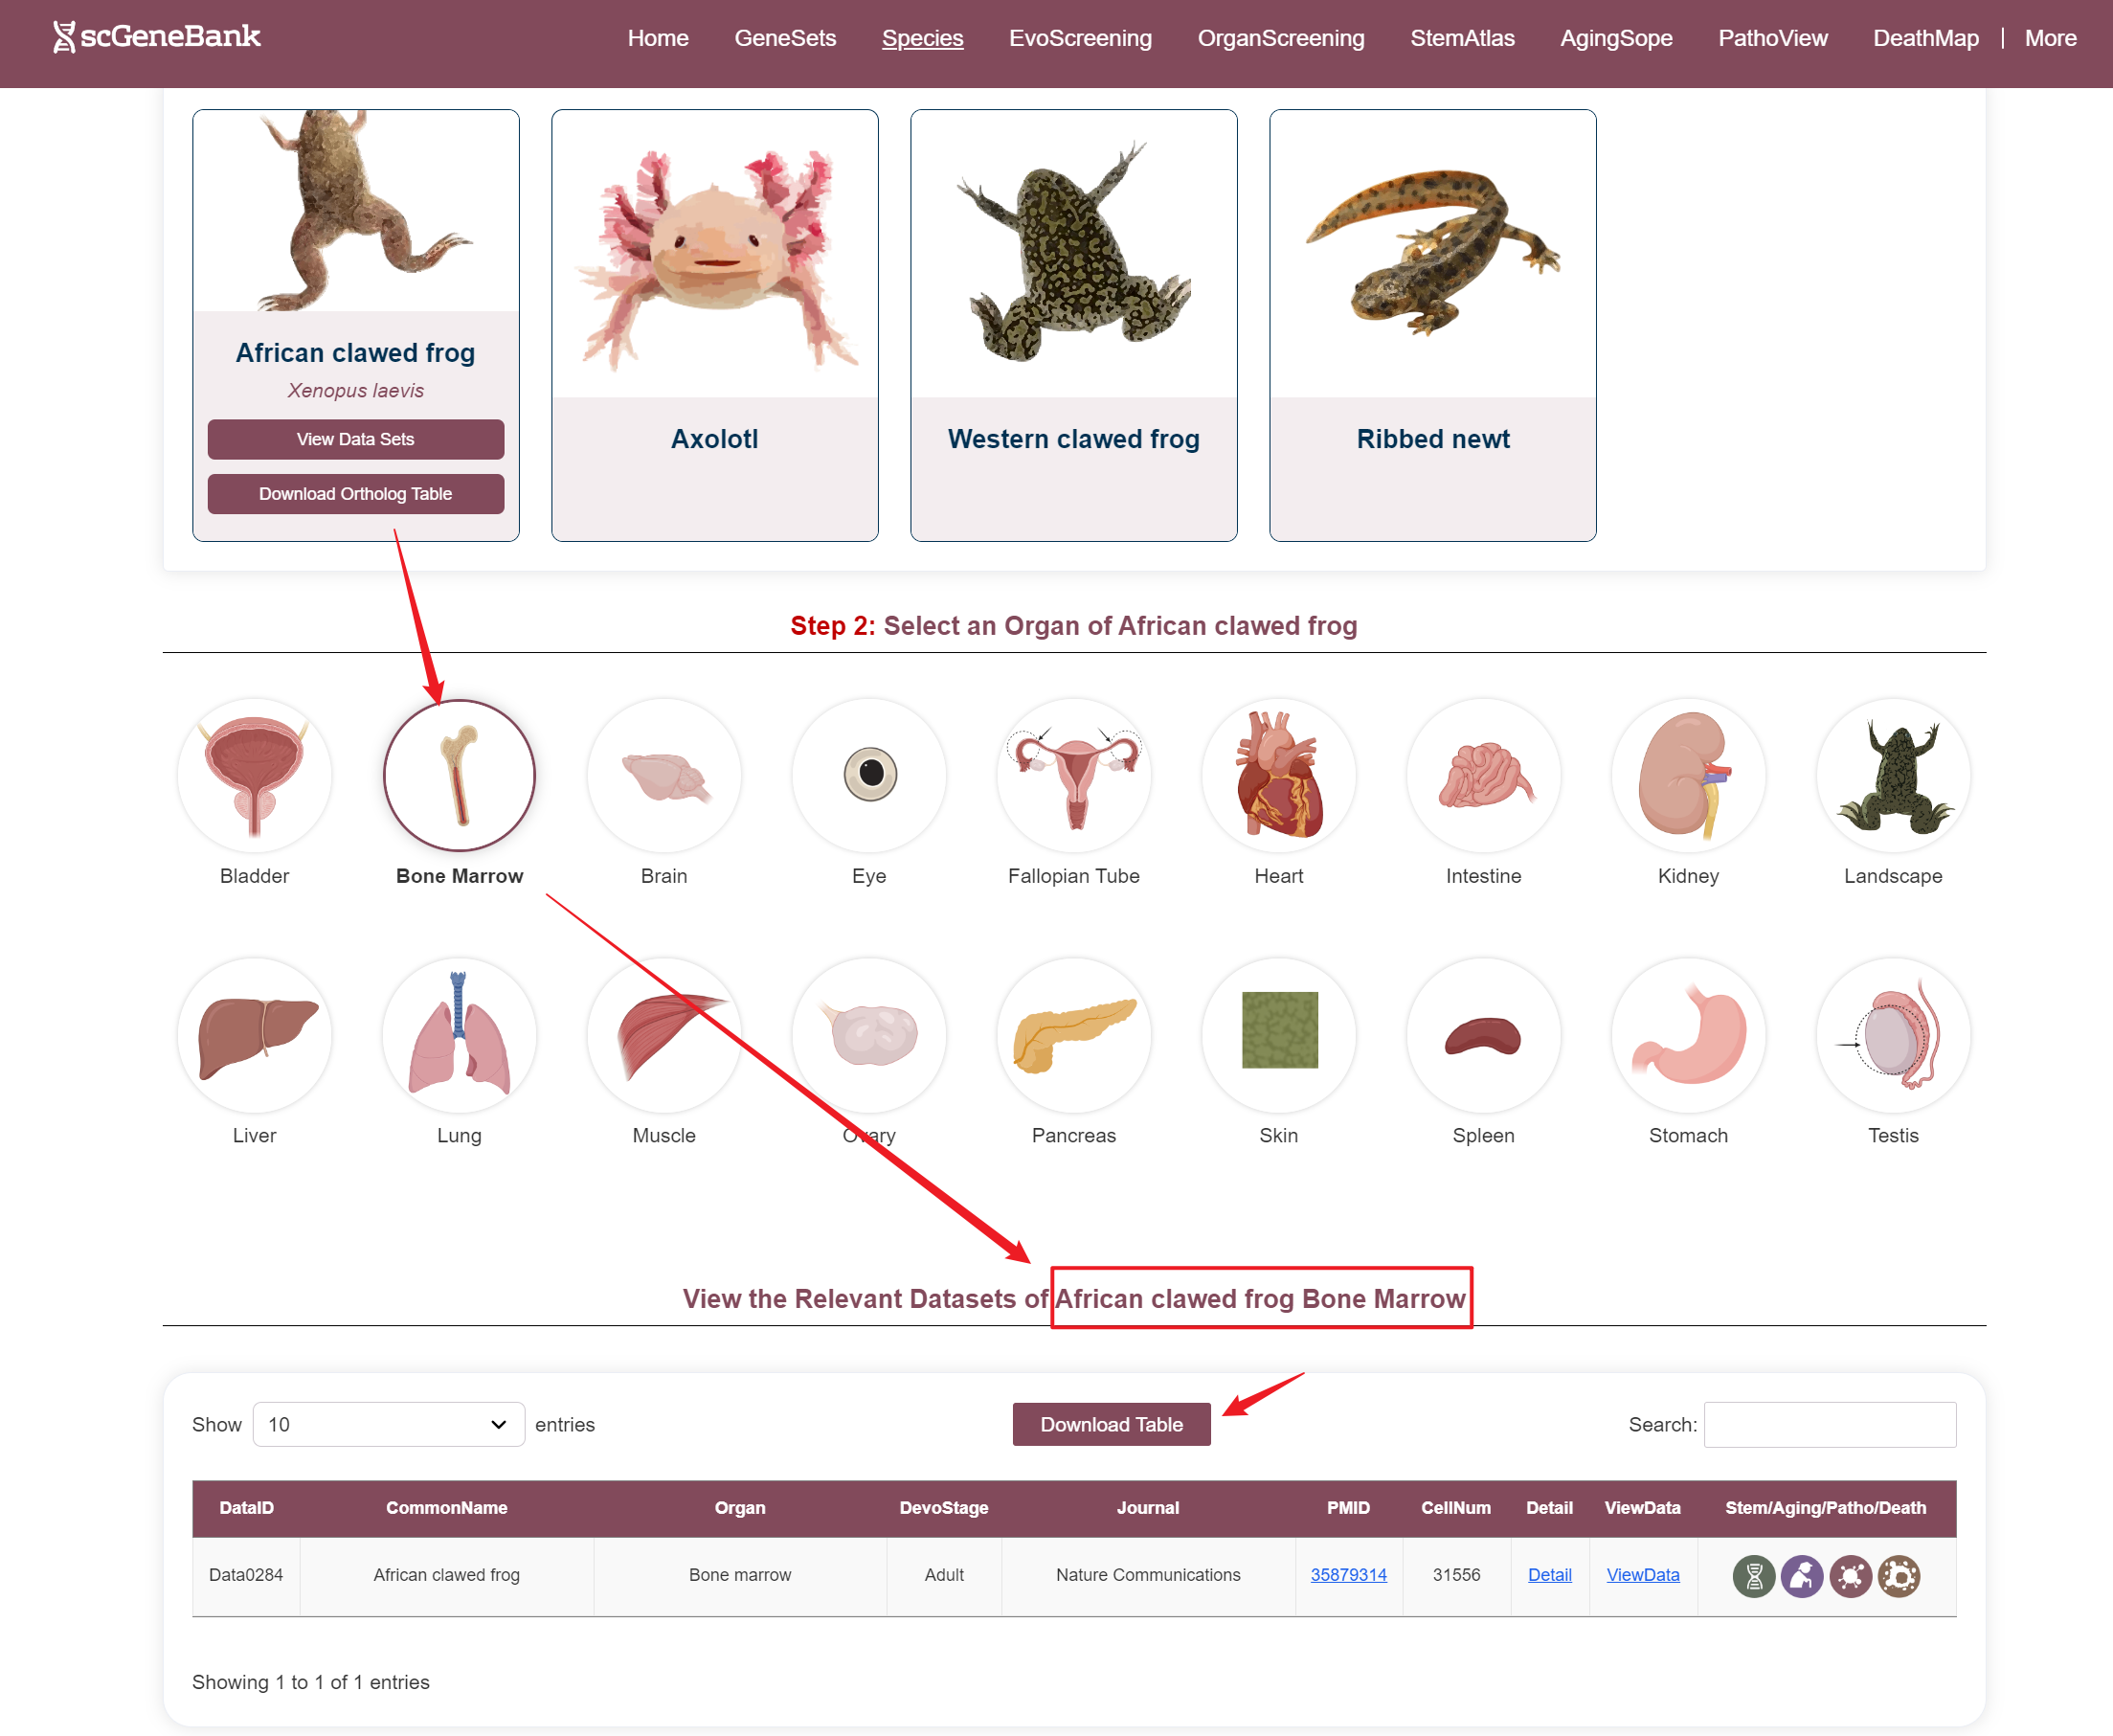
Step 2
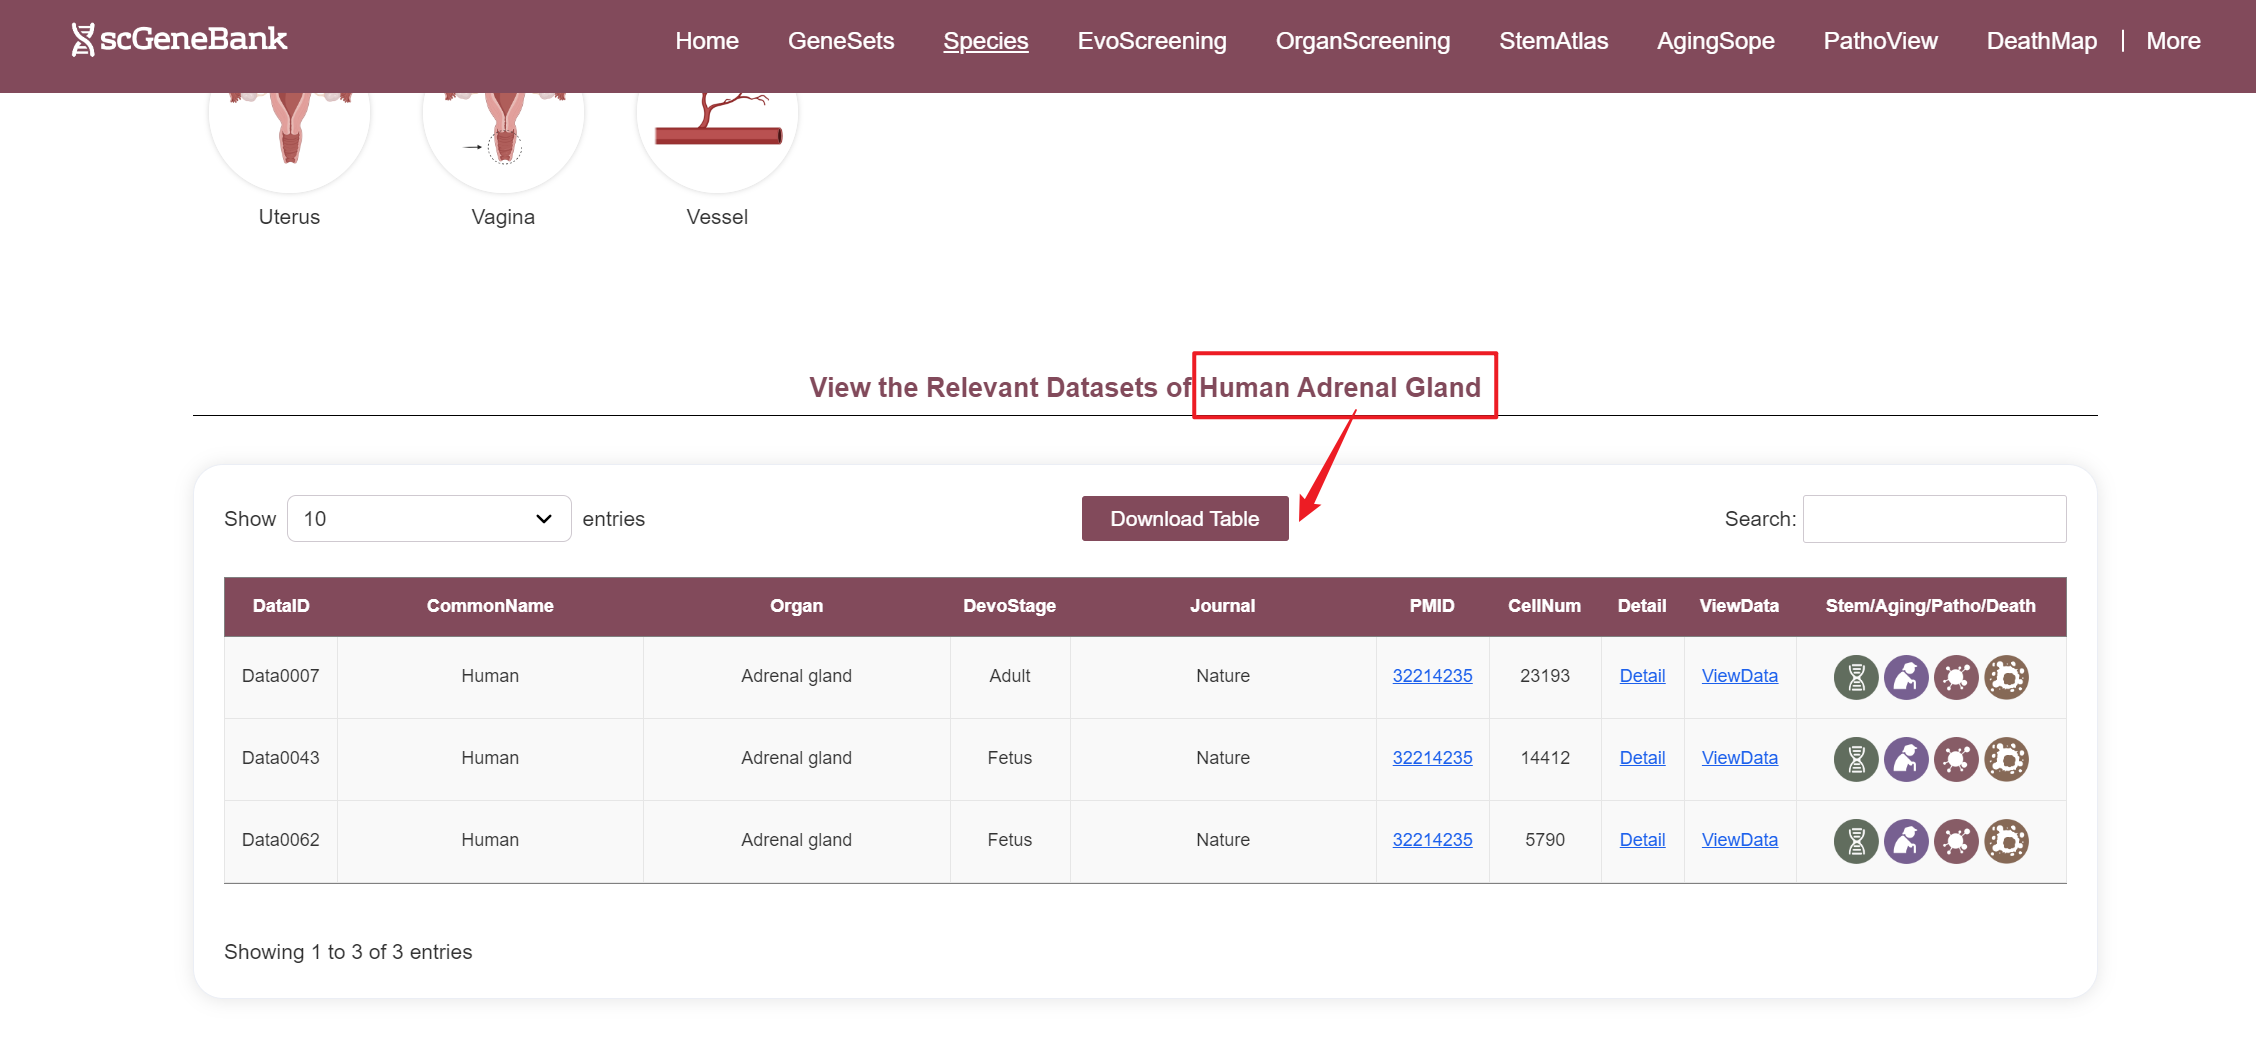
After selecting a species and organ, relevant datasets are displayed in a table. Each row includes the species' common name, organ name, developmental stage, journal name, PMID, cell count, and interactive access to additional information.
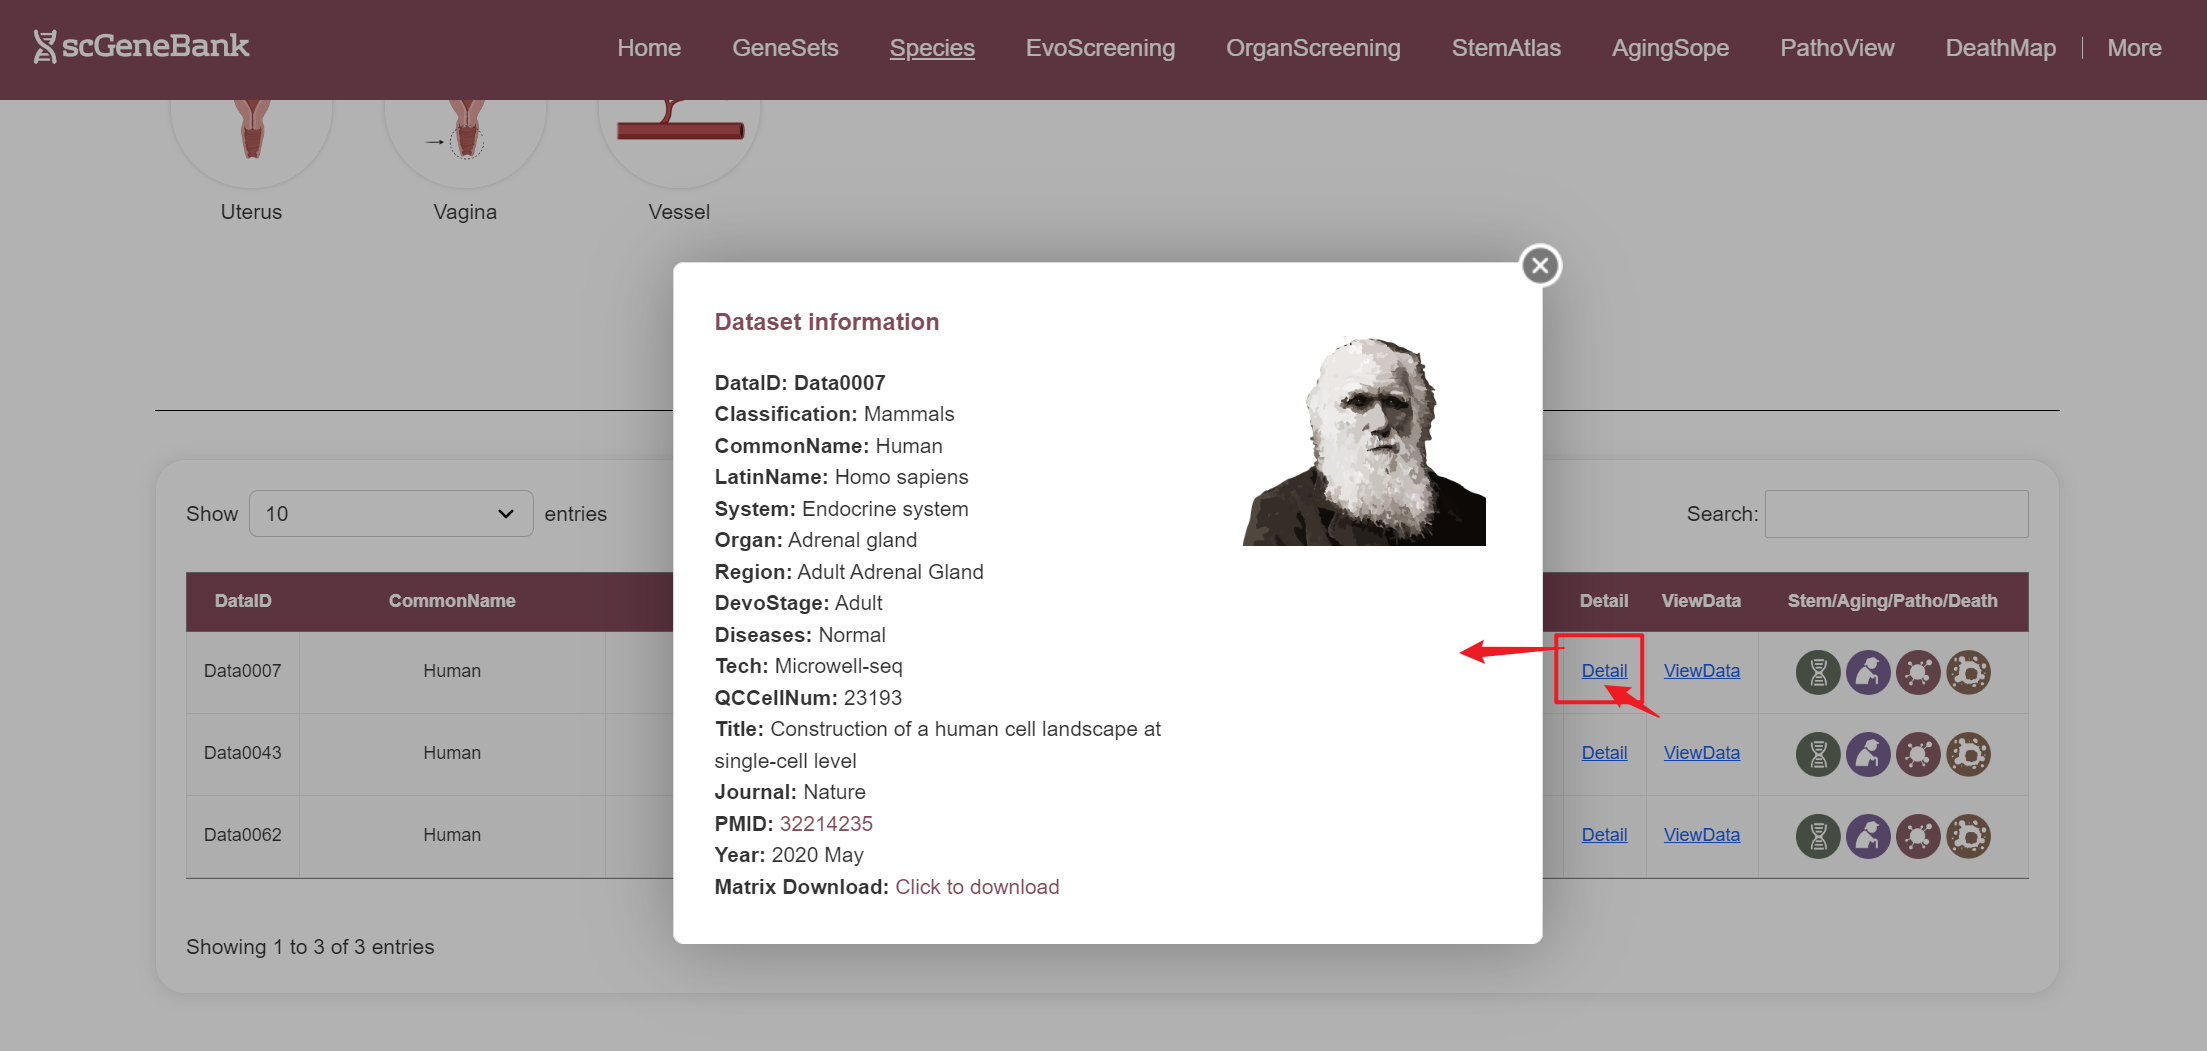
--By clicking “Detail”, additional metadata for the selected dataset will be displayed.
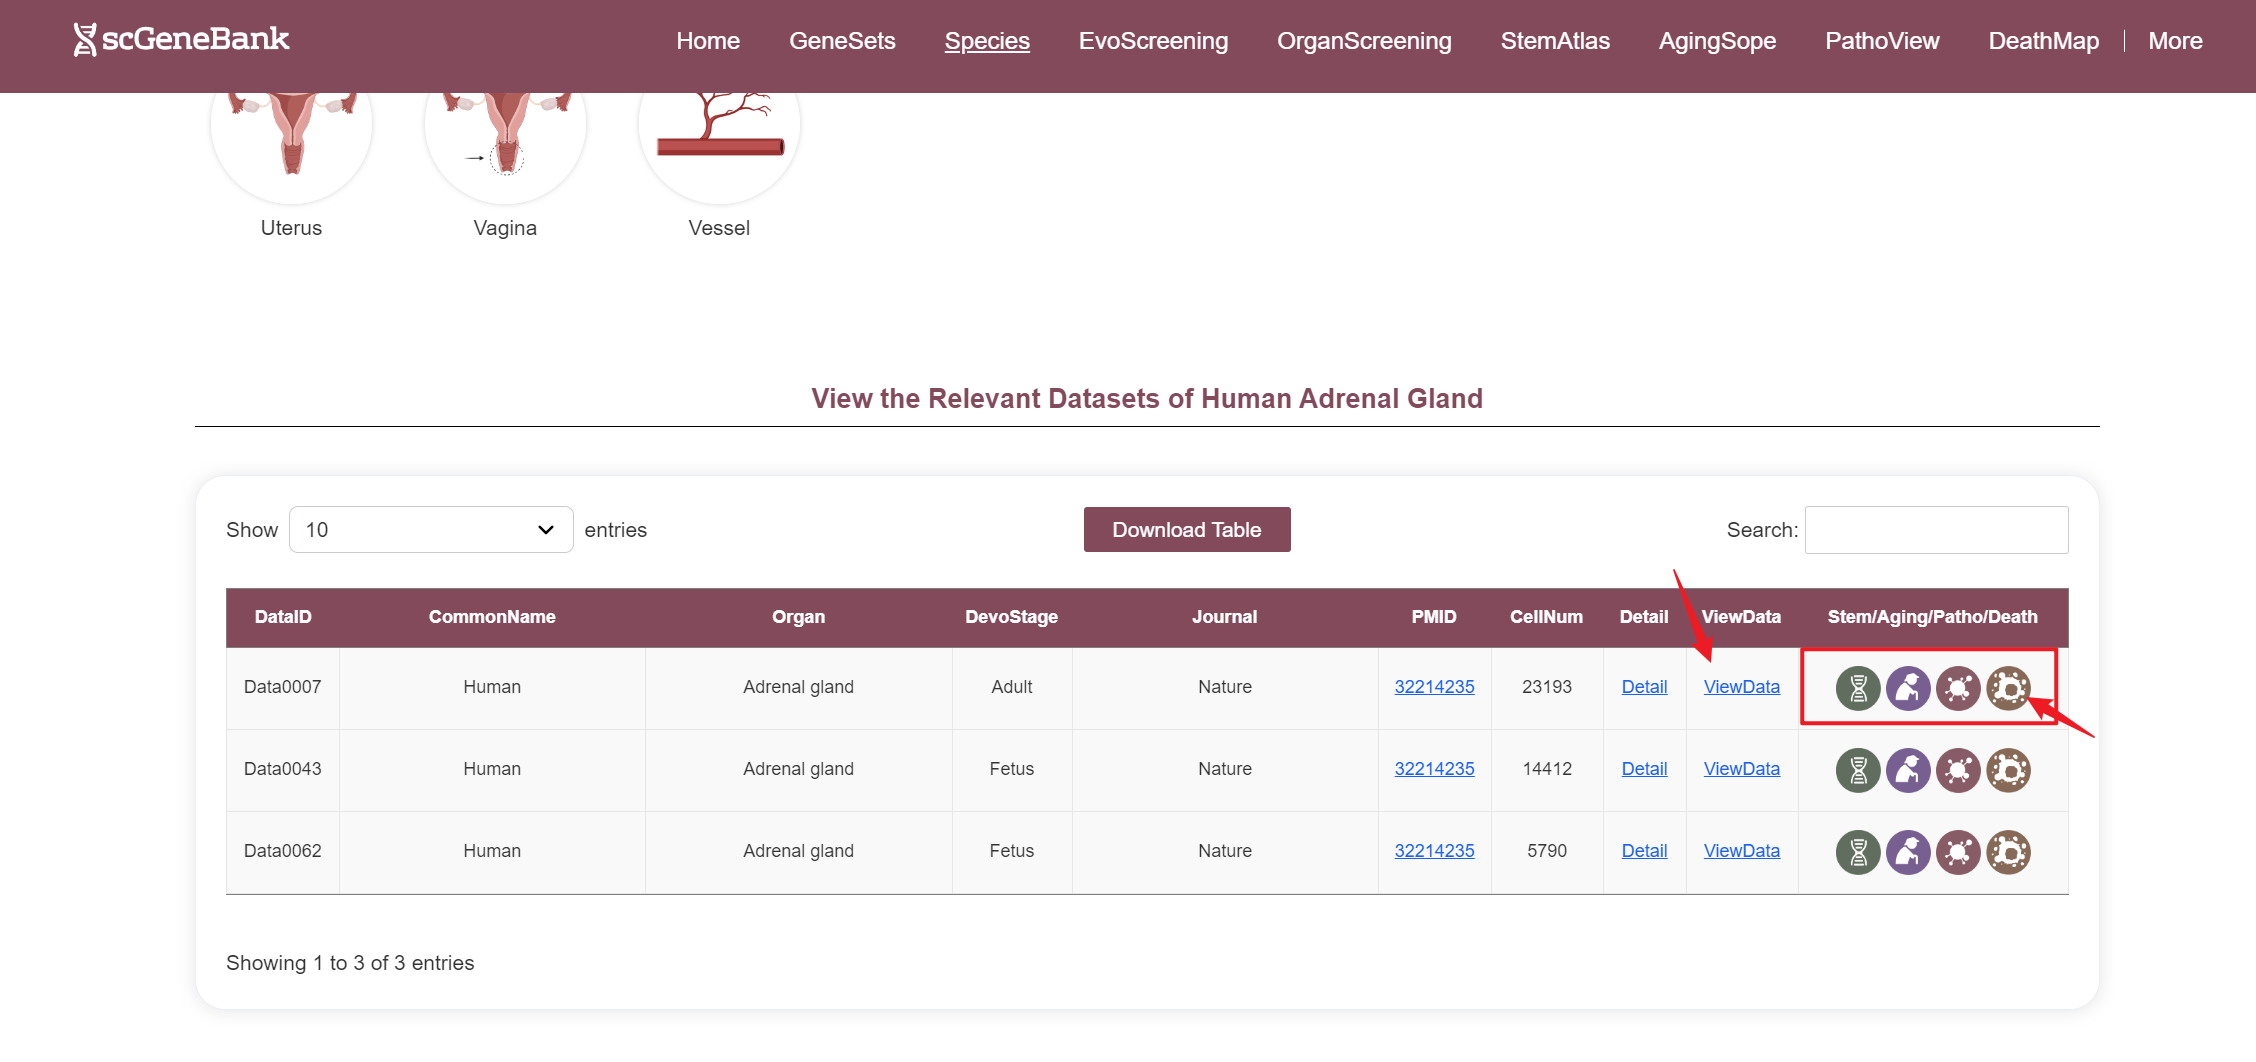
--By clicking “ViewData”, users can access a detailed page for the selected dataset, including dataset information, clustering results, and the bubble plot of the scoring results for each of 28-categories gene sets. To specifically analyze Stem/Aging/Patho/Death gene sets, users can also click the icon in the table's last column to view their dedicated detail pages.
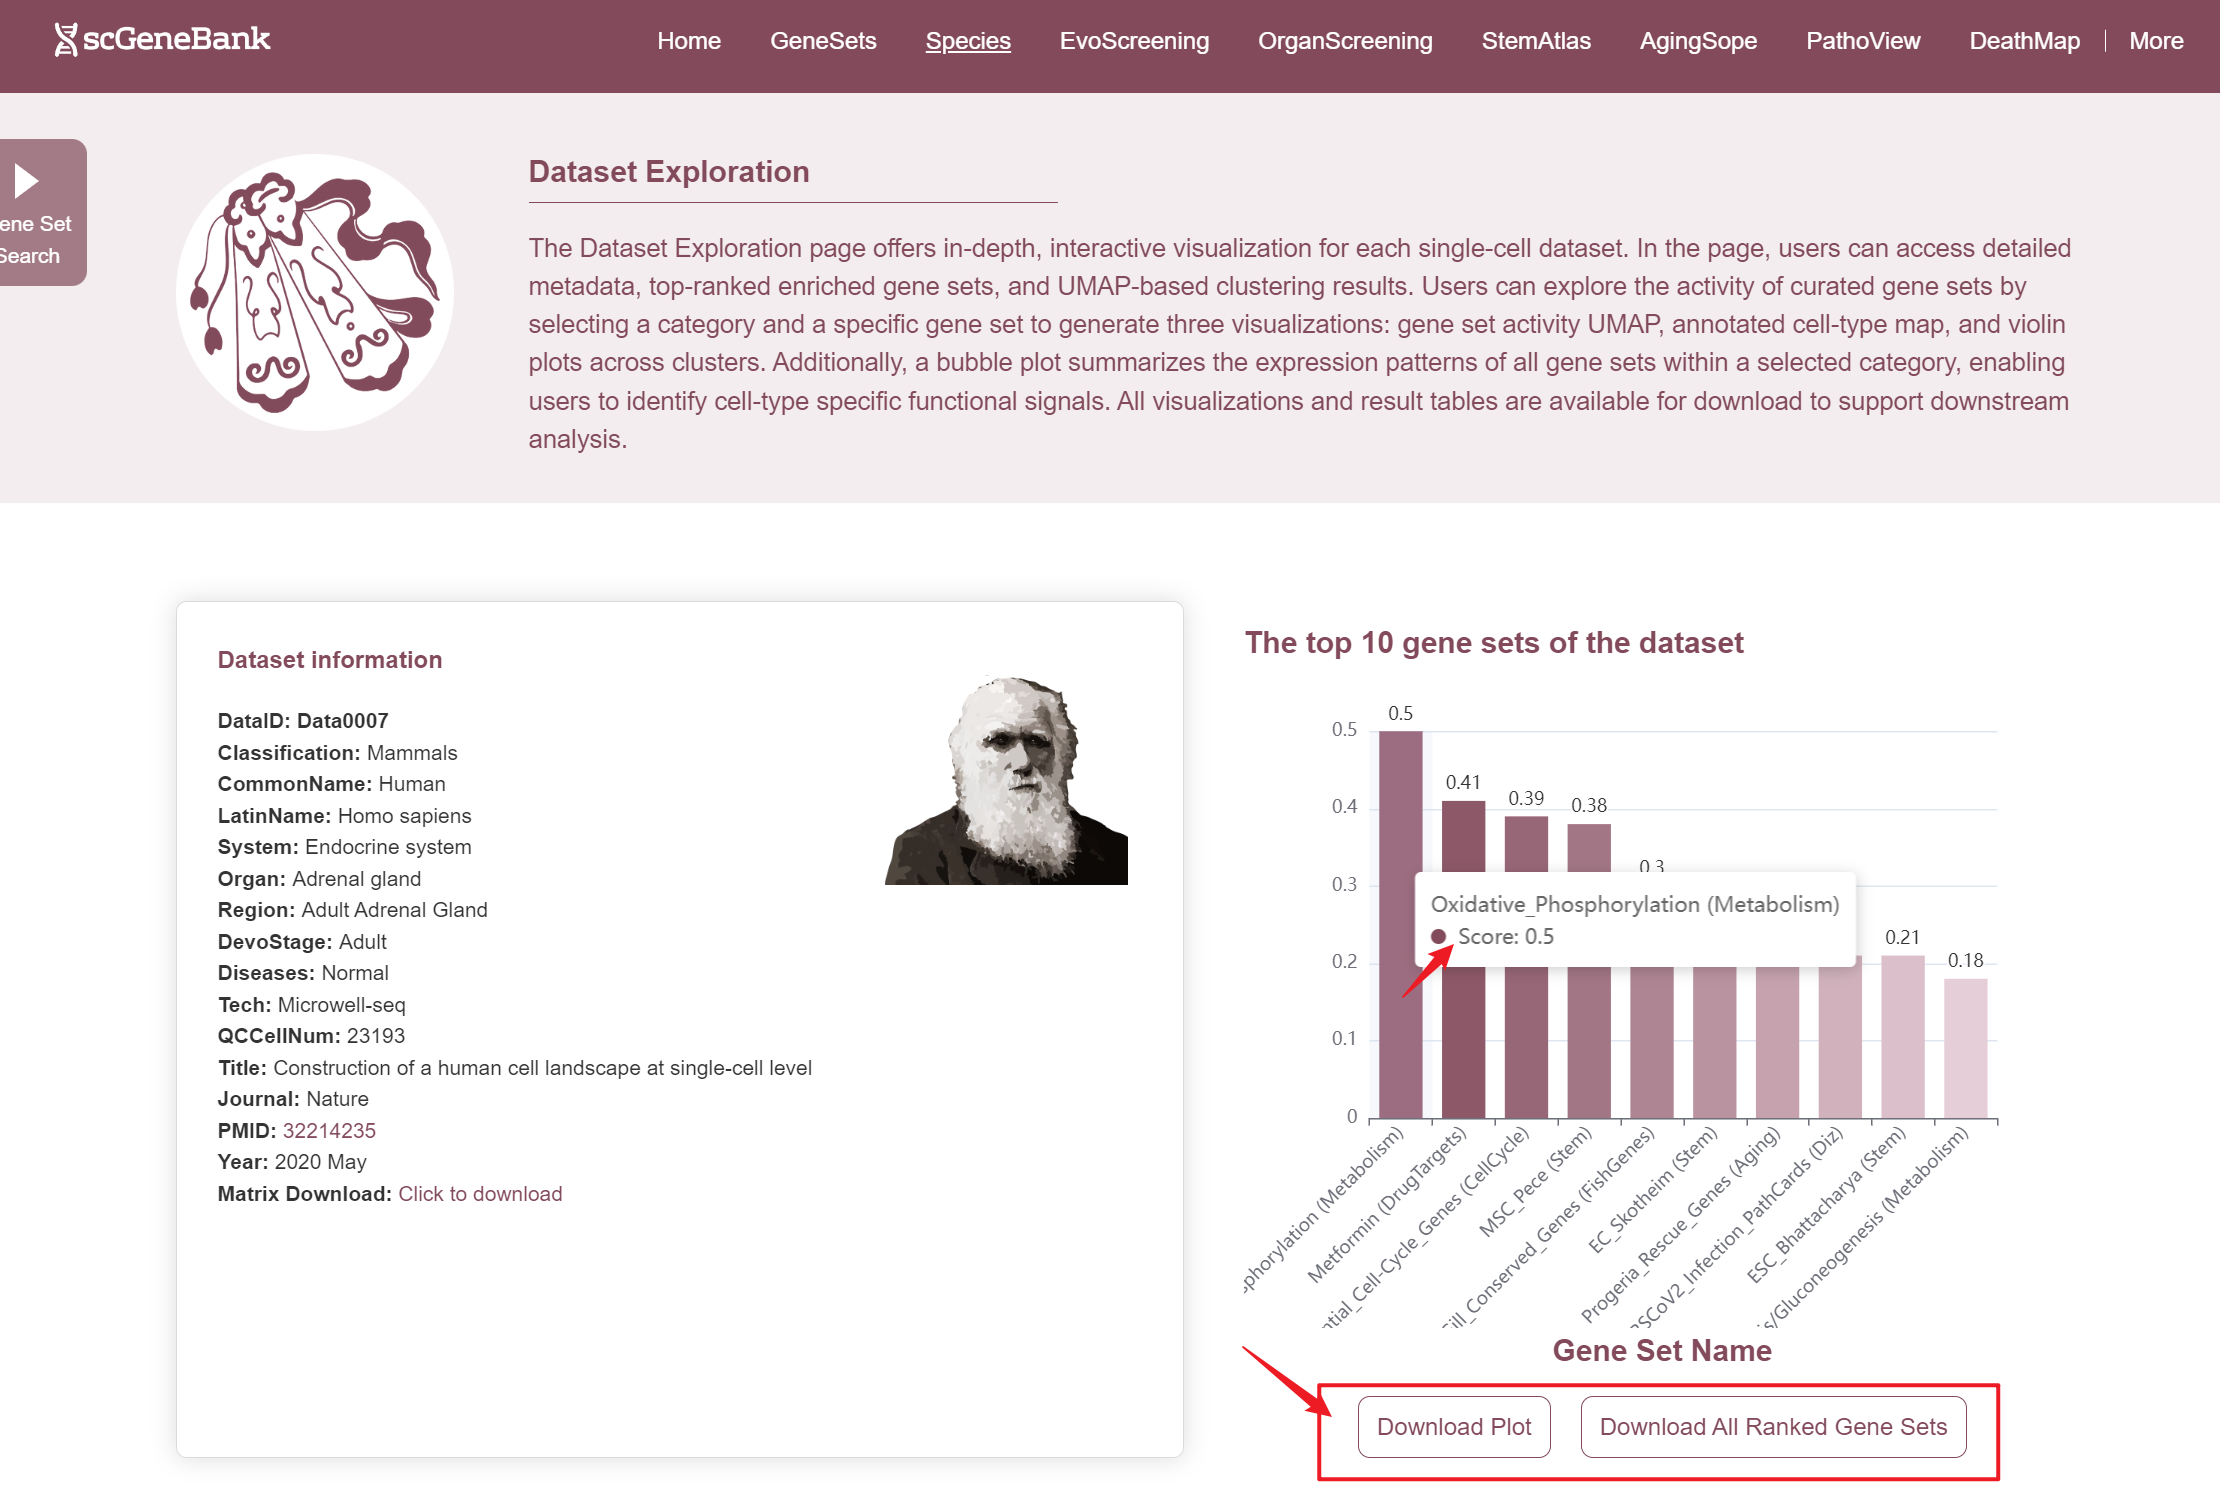
In ViewData page, the first section offers an overview of the dataset's core information and function highlights. One the left, the Dataset Infomation panel summarizes key details, including the dataset ID, species classification, common and Latin names, biological system, tissue, region, developmental stage, sequencing technology, quality-controlled cell count, and publication details such as journal name, PMID, and year. A direct link is also provided for downloading the expression matrix. On the right, it displays the top 10 enriched gene sets in the dataset, ranked by activity scores. Users can hover over the corresponding bars to view the full gene names and their specific scores. Additionally, below the bar chart, users can download the complete bar chart and the ranked gene set results table.
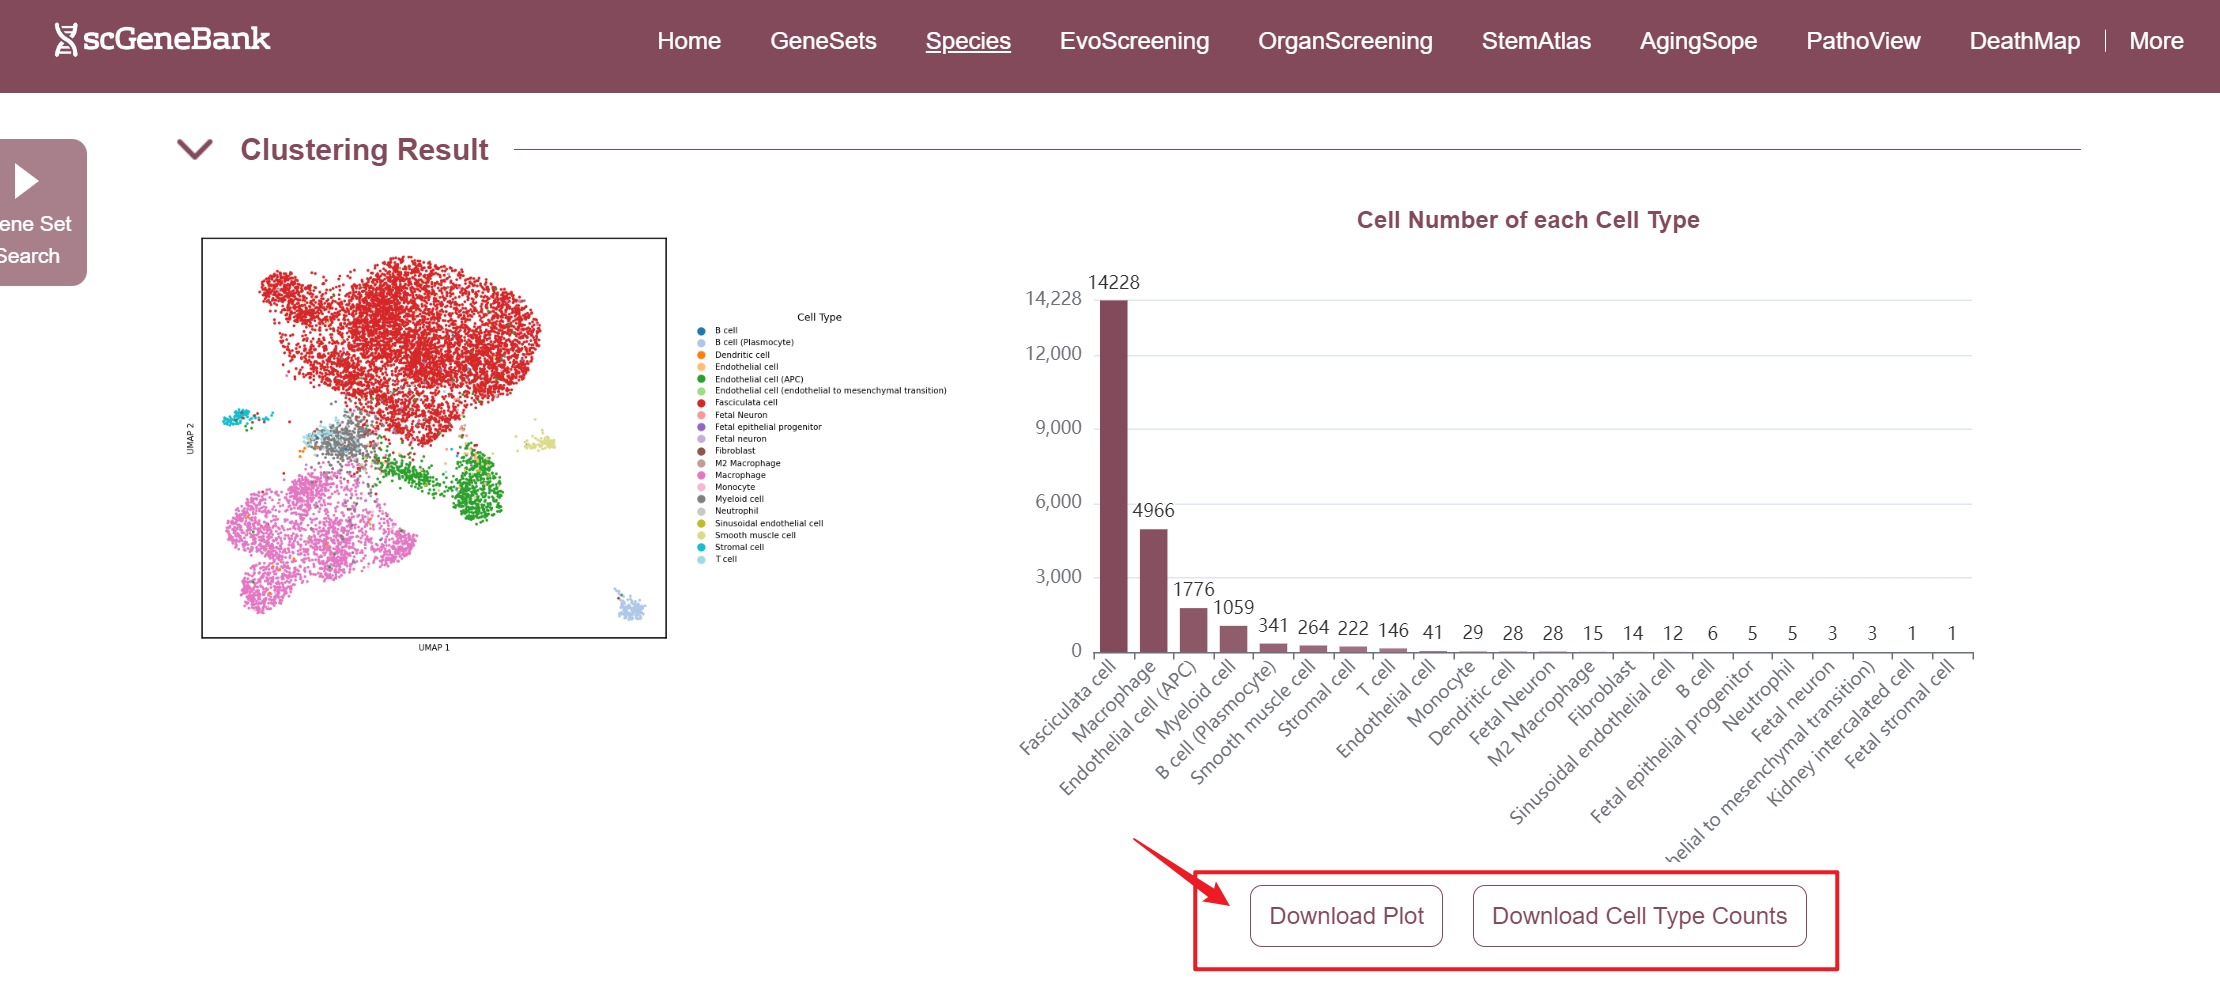
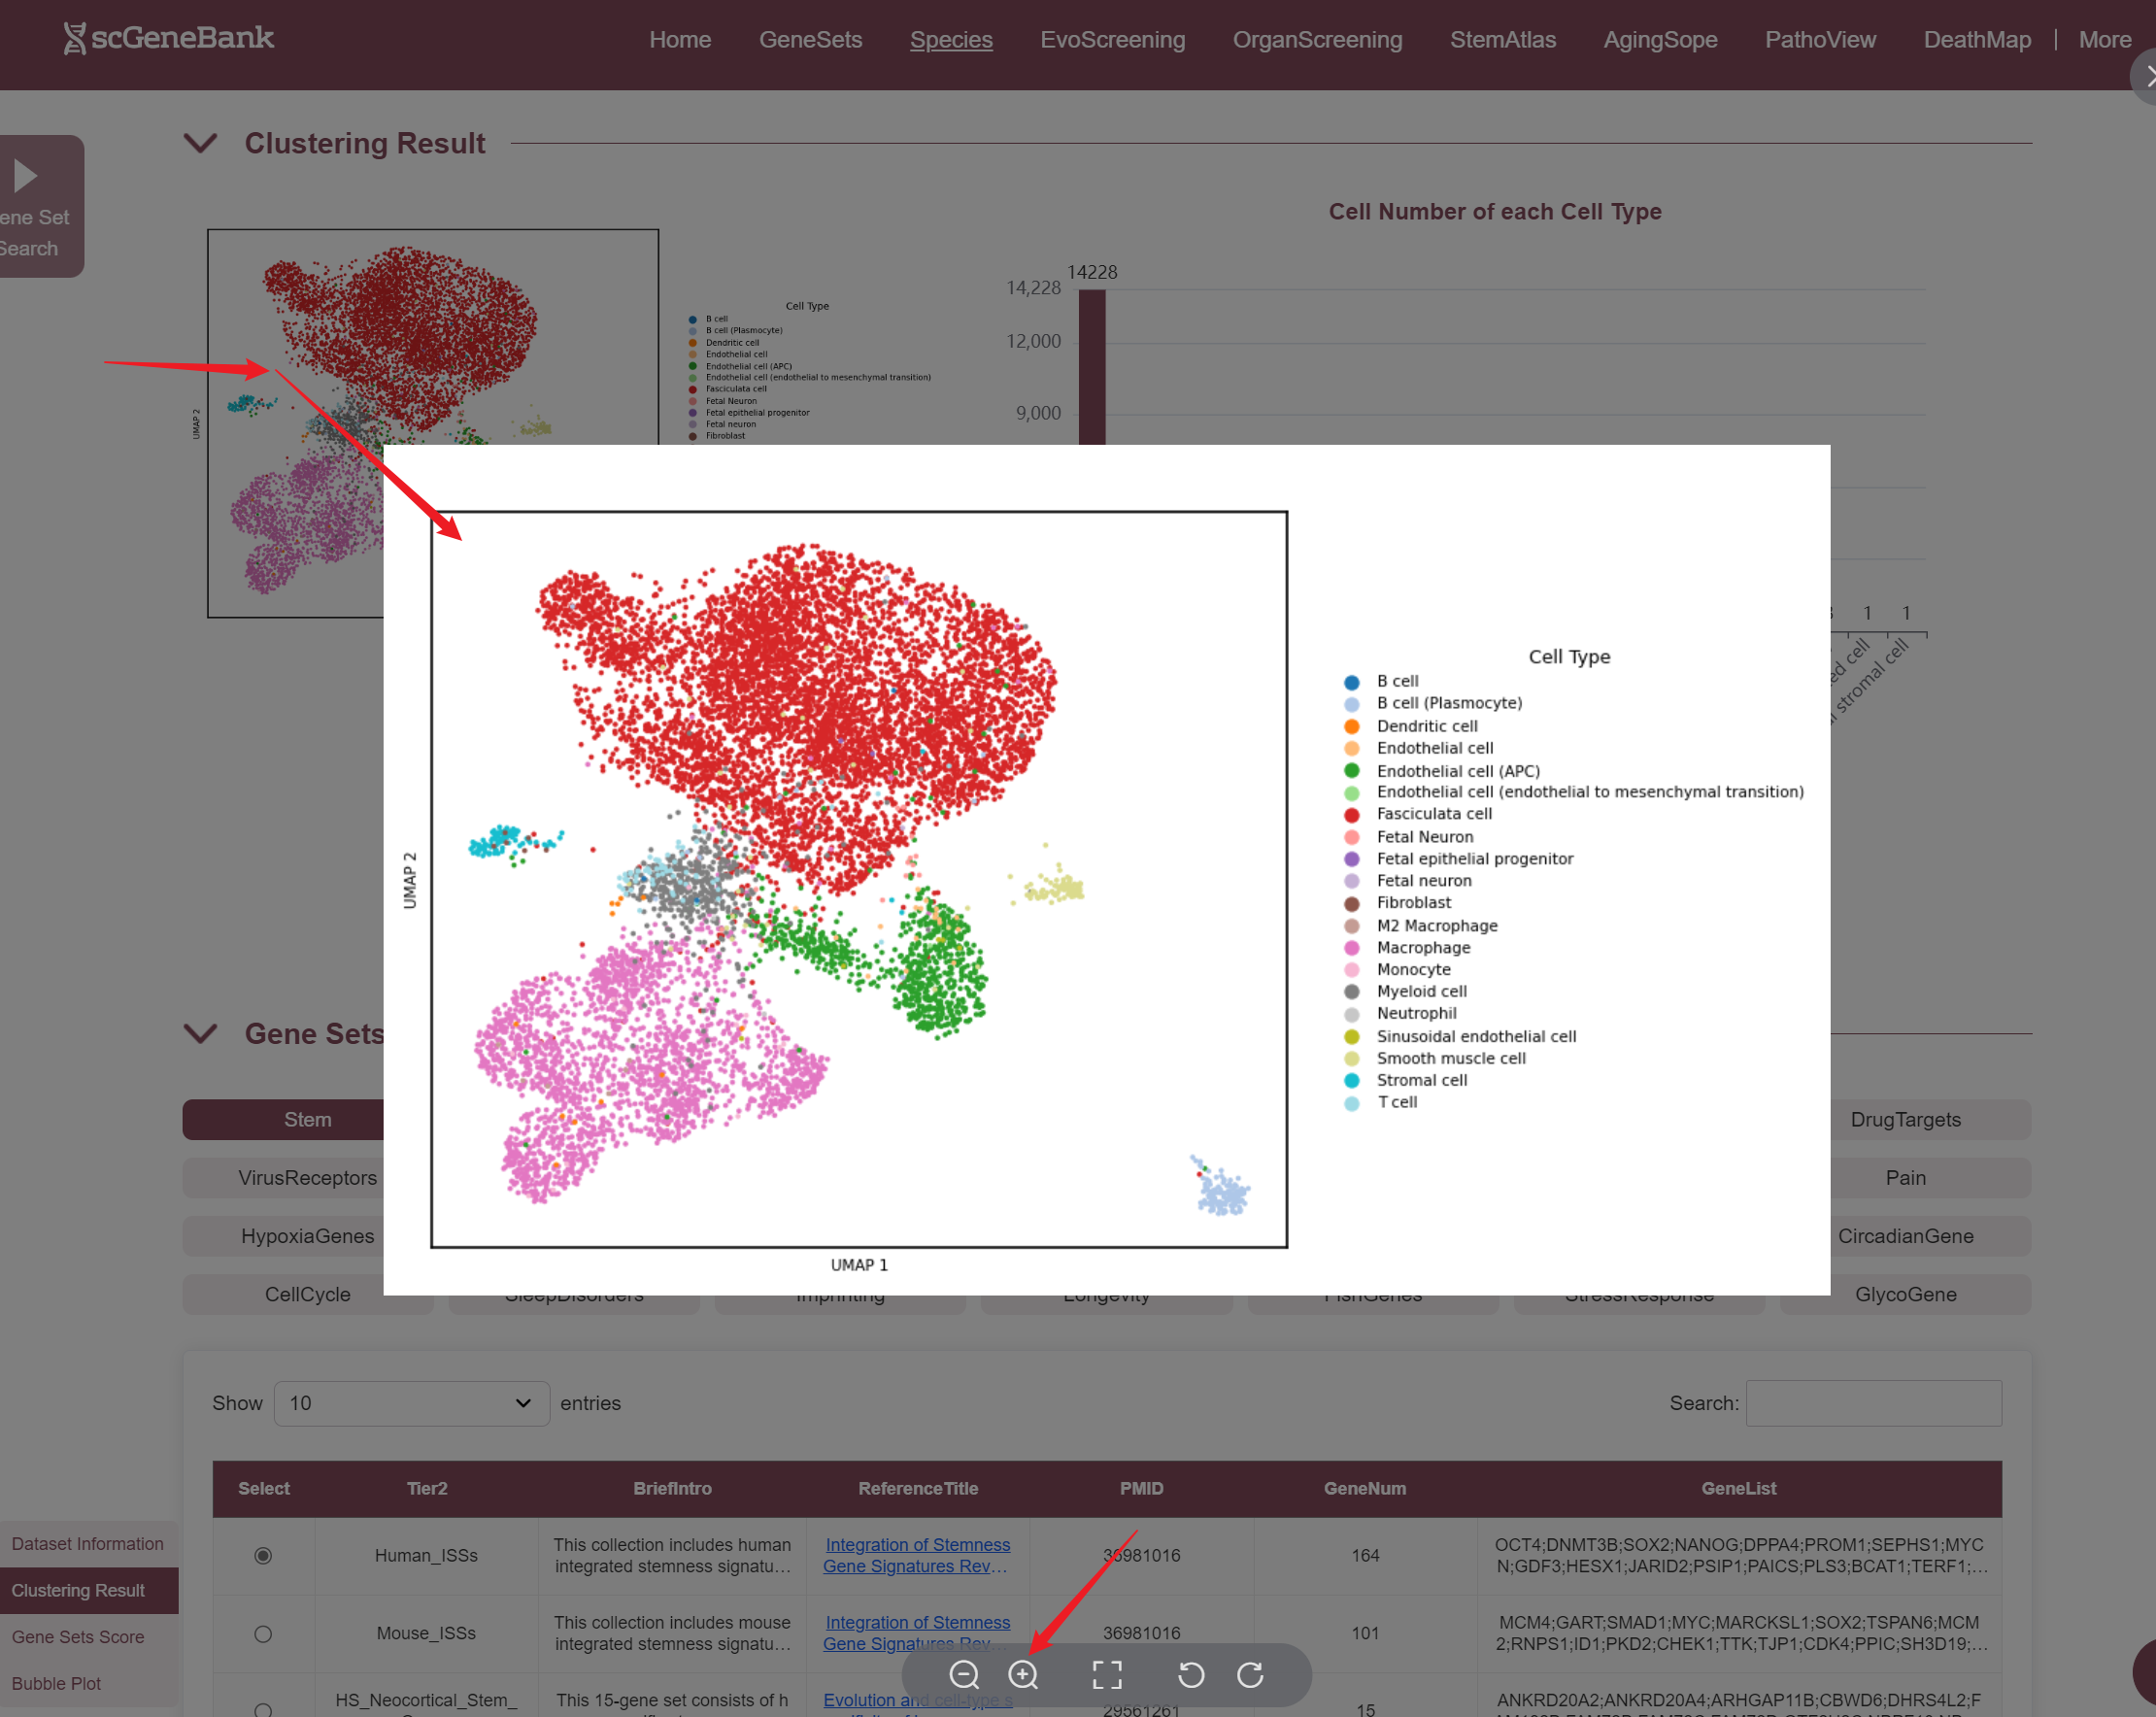
The second section of the ViewData page presents the dataset's clustering results and offers an overview of cell type composition. On the left, a UMAP Plot displays a two-dimensional embedding of cells based on their transcriptomic profiles, with each dot representing a single cell and colors indicating assigned cell types or clusters. On the right, it shows the number of cells per identified cell type, allowing users to quickly assess population abundance and diversity. Both the cell count plot and the result table can be downloaded. Also, the plot can be enlarged by clicking.
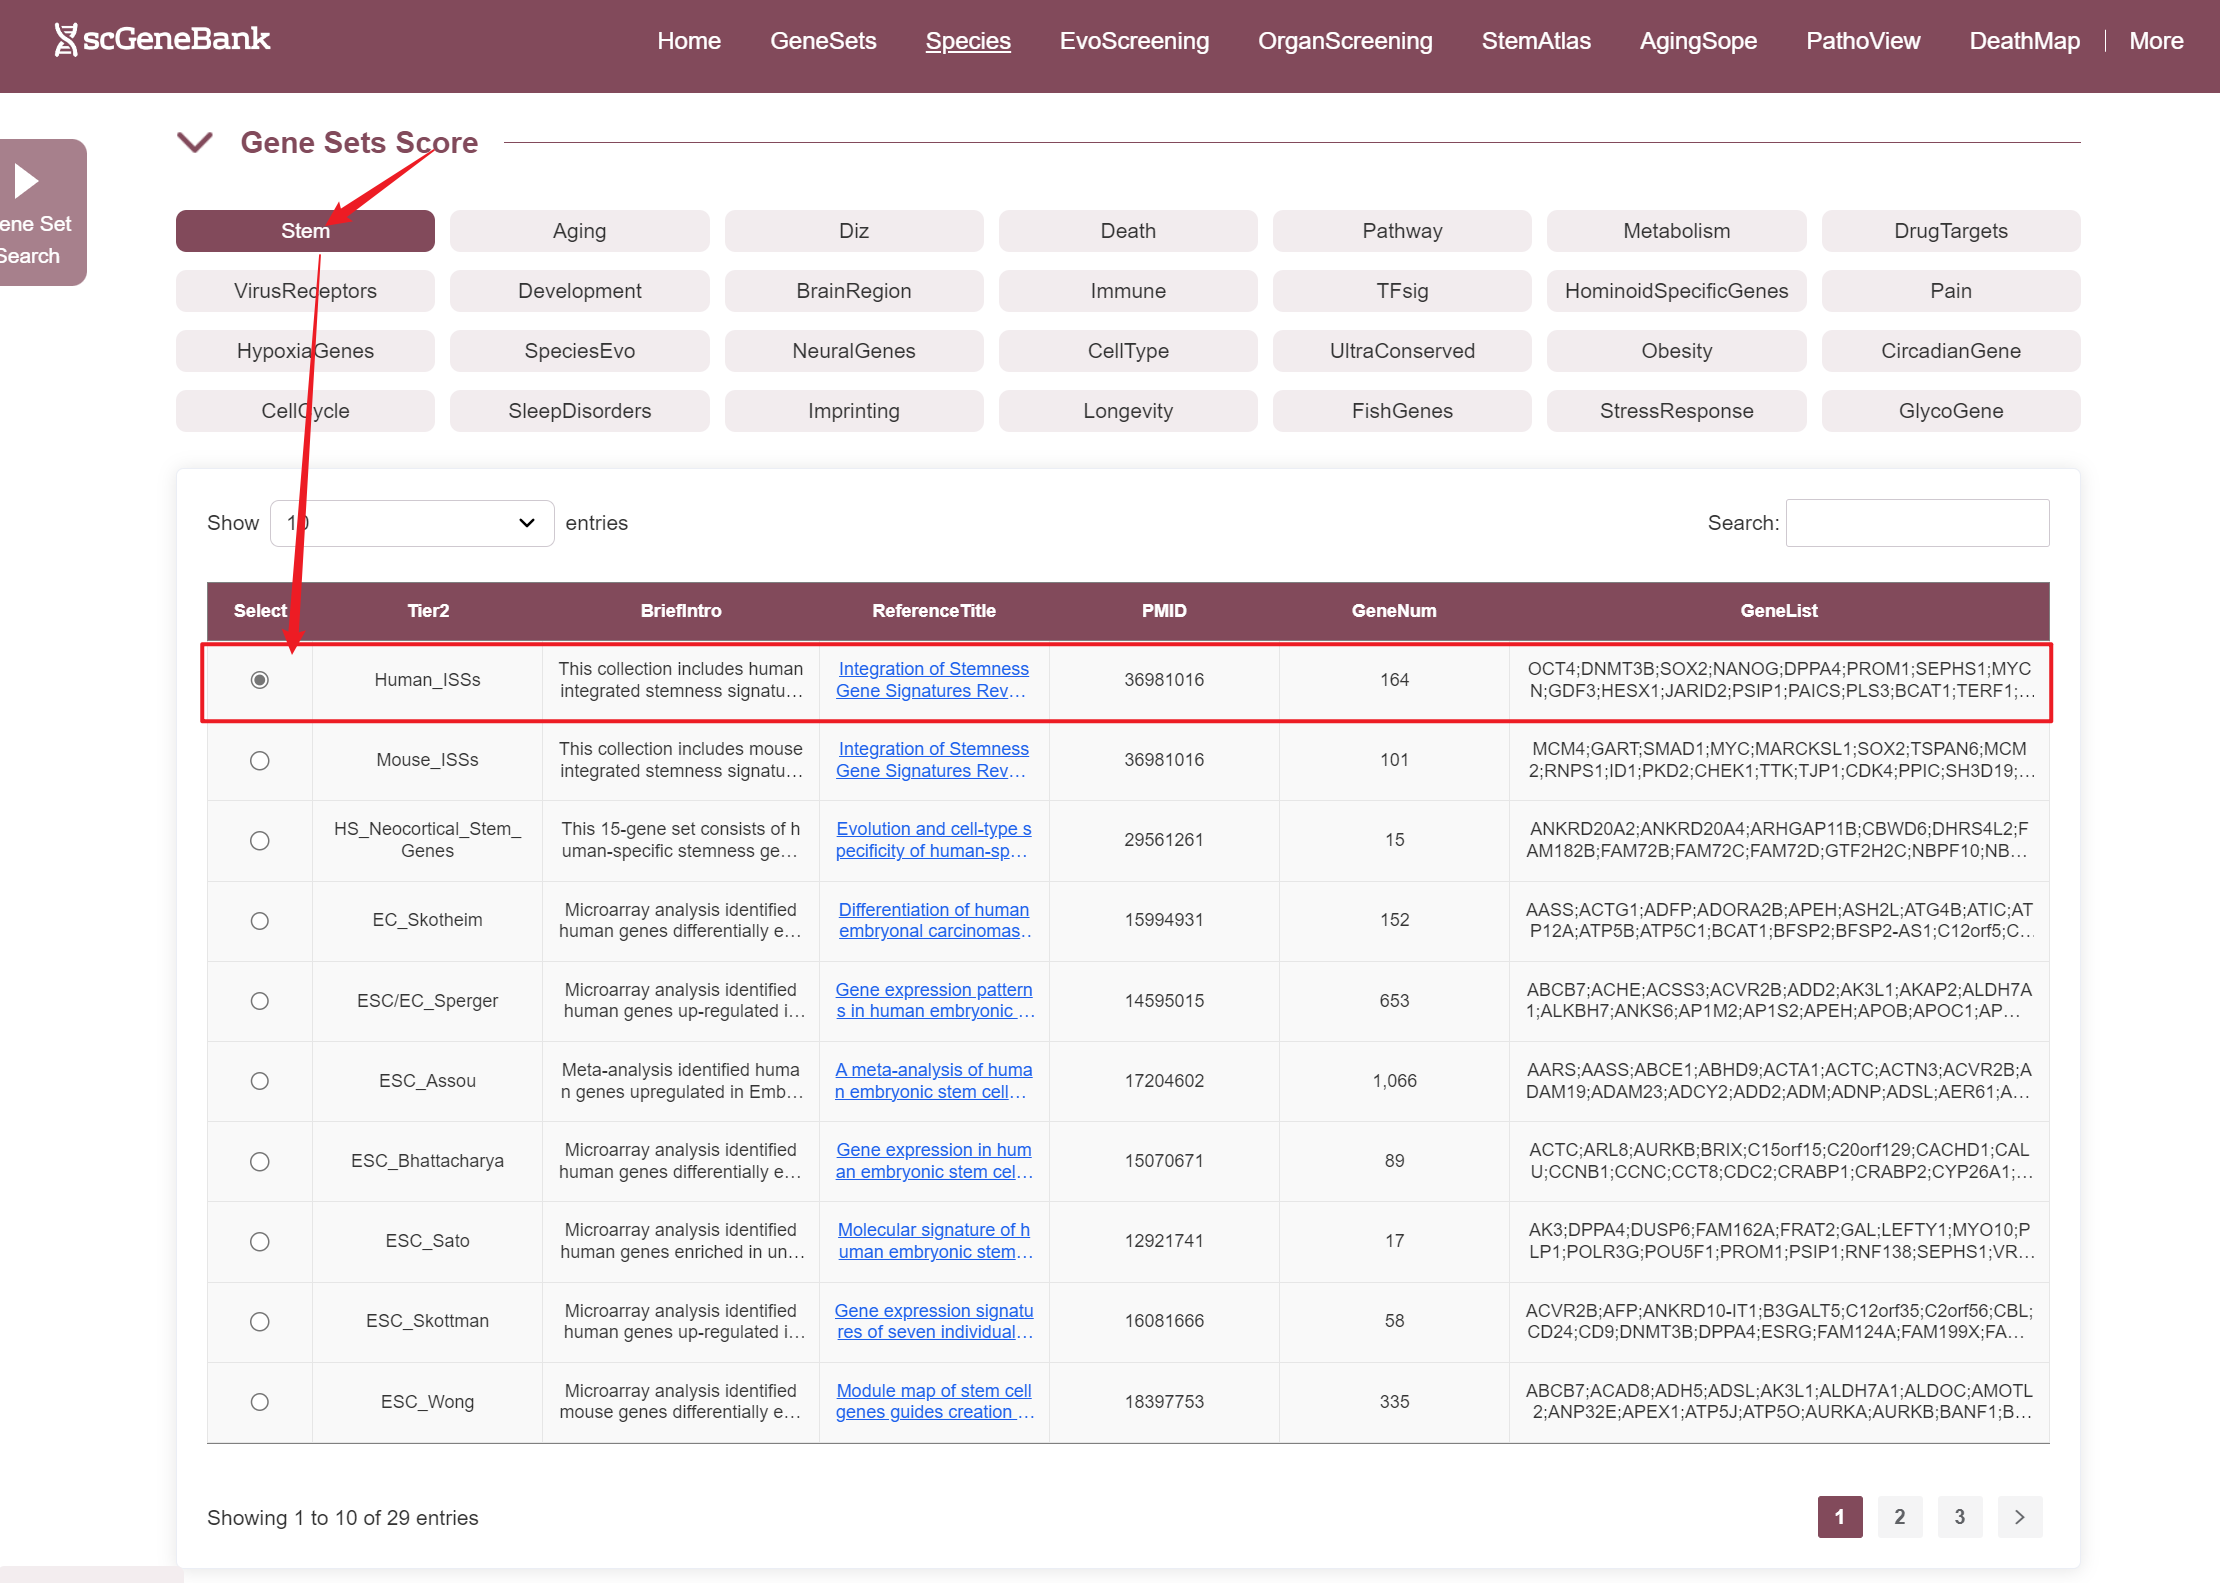
The third section of the ViewData page allows users to explore the expression patterns of specific gene sets within the selected dataset.
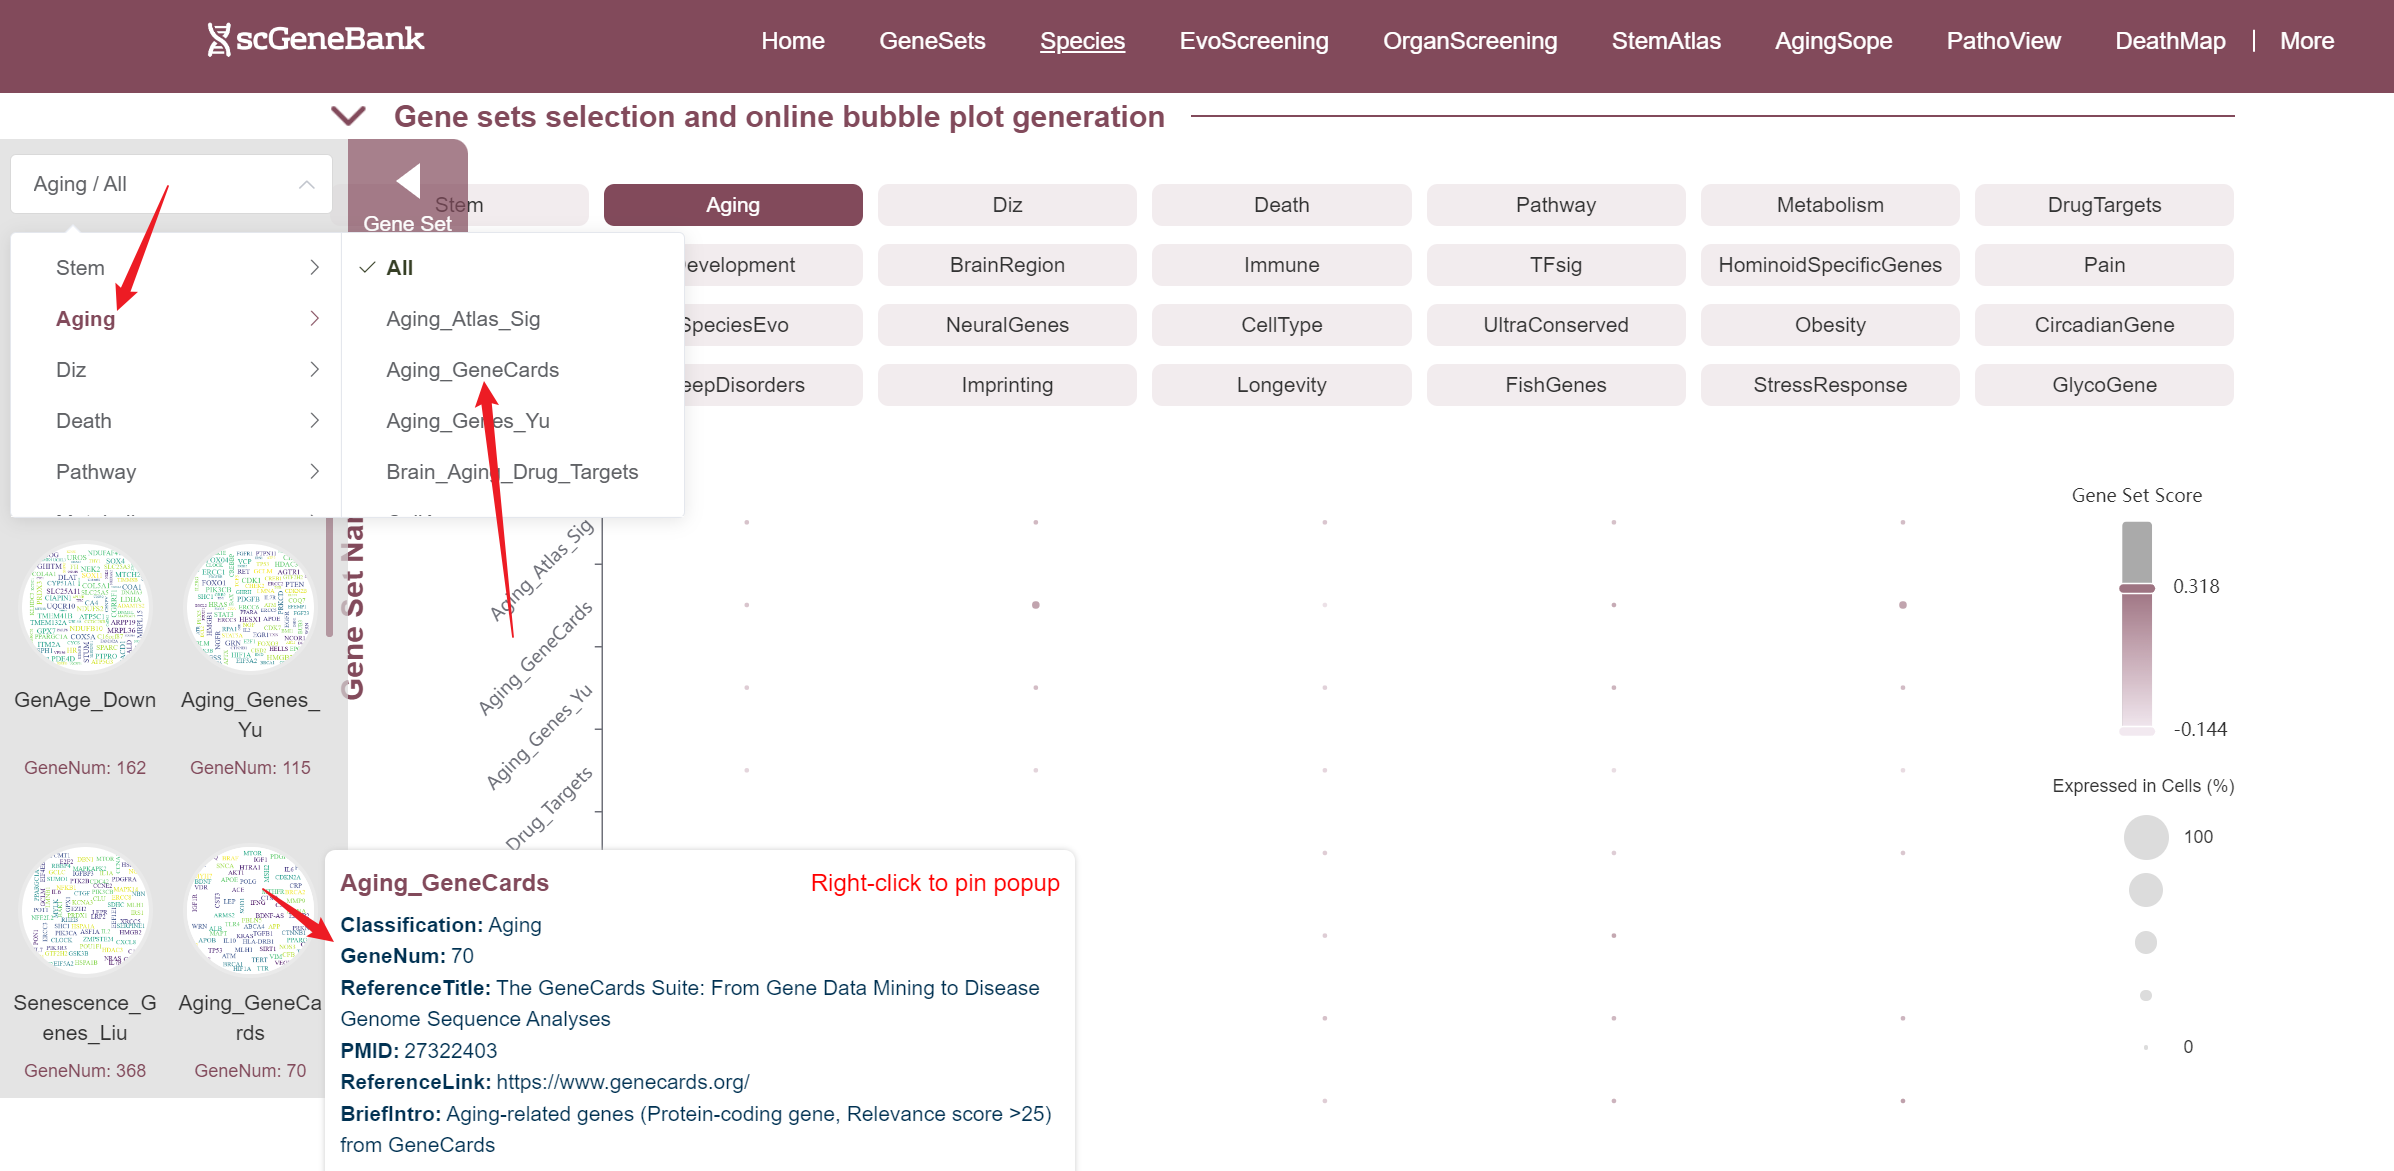
To begin, users select a biological category (e.g., Stem, Aging, Immune) to view all associated gene sets. From the resulting table, a specific gene set can be chosen—each entry includes the gene set name, a brief description, reference information, gene count, and a preview of included genes.
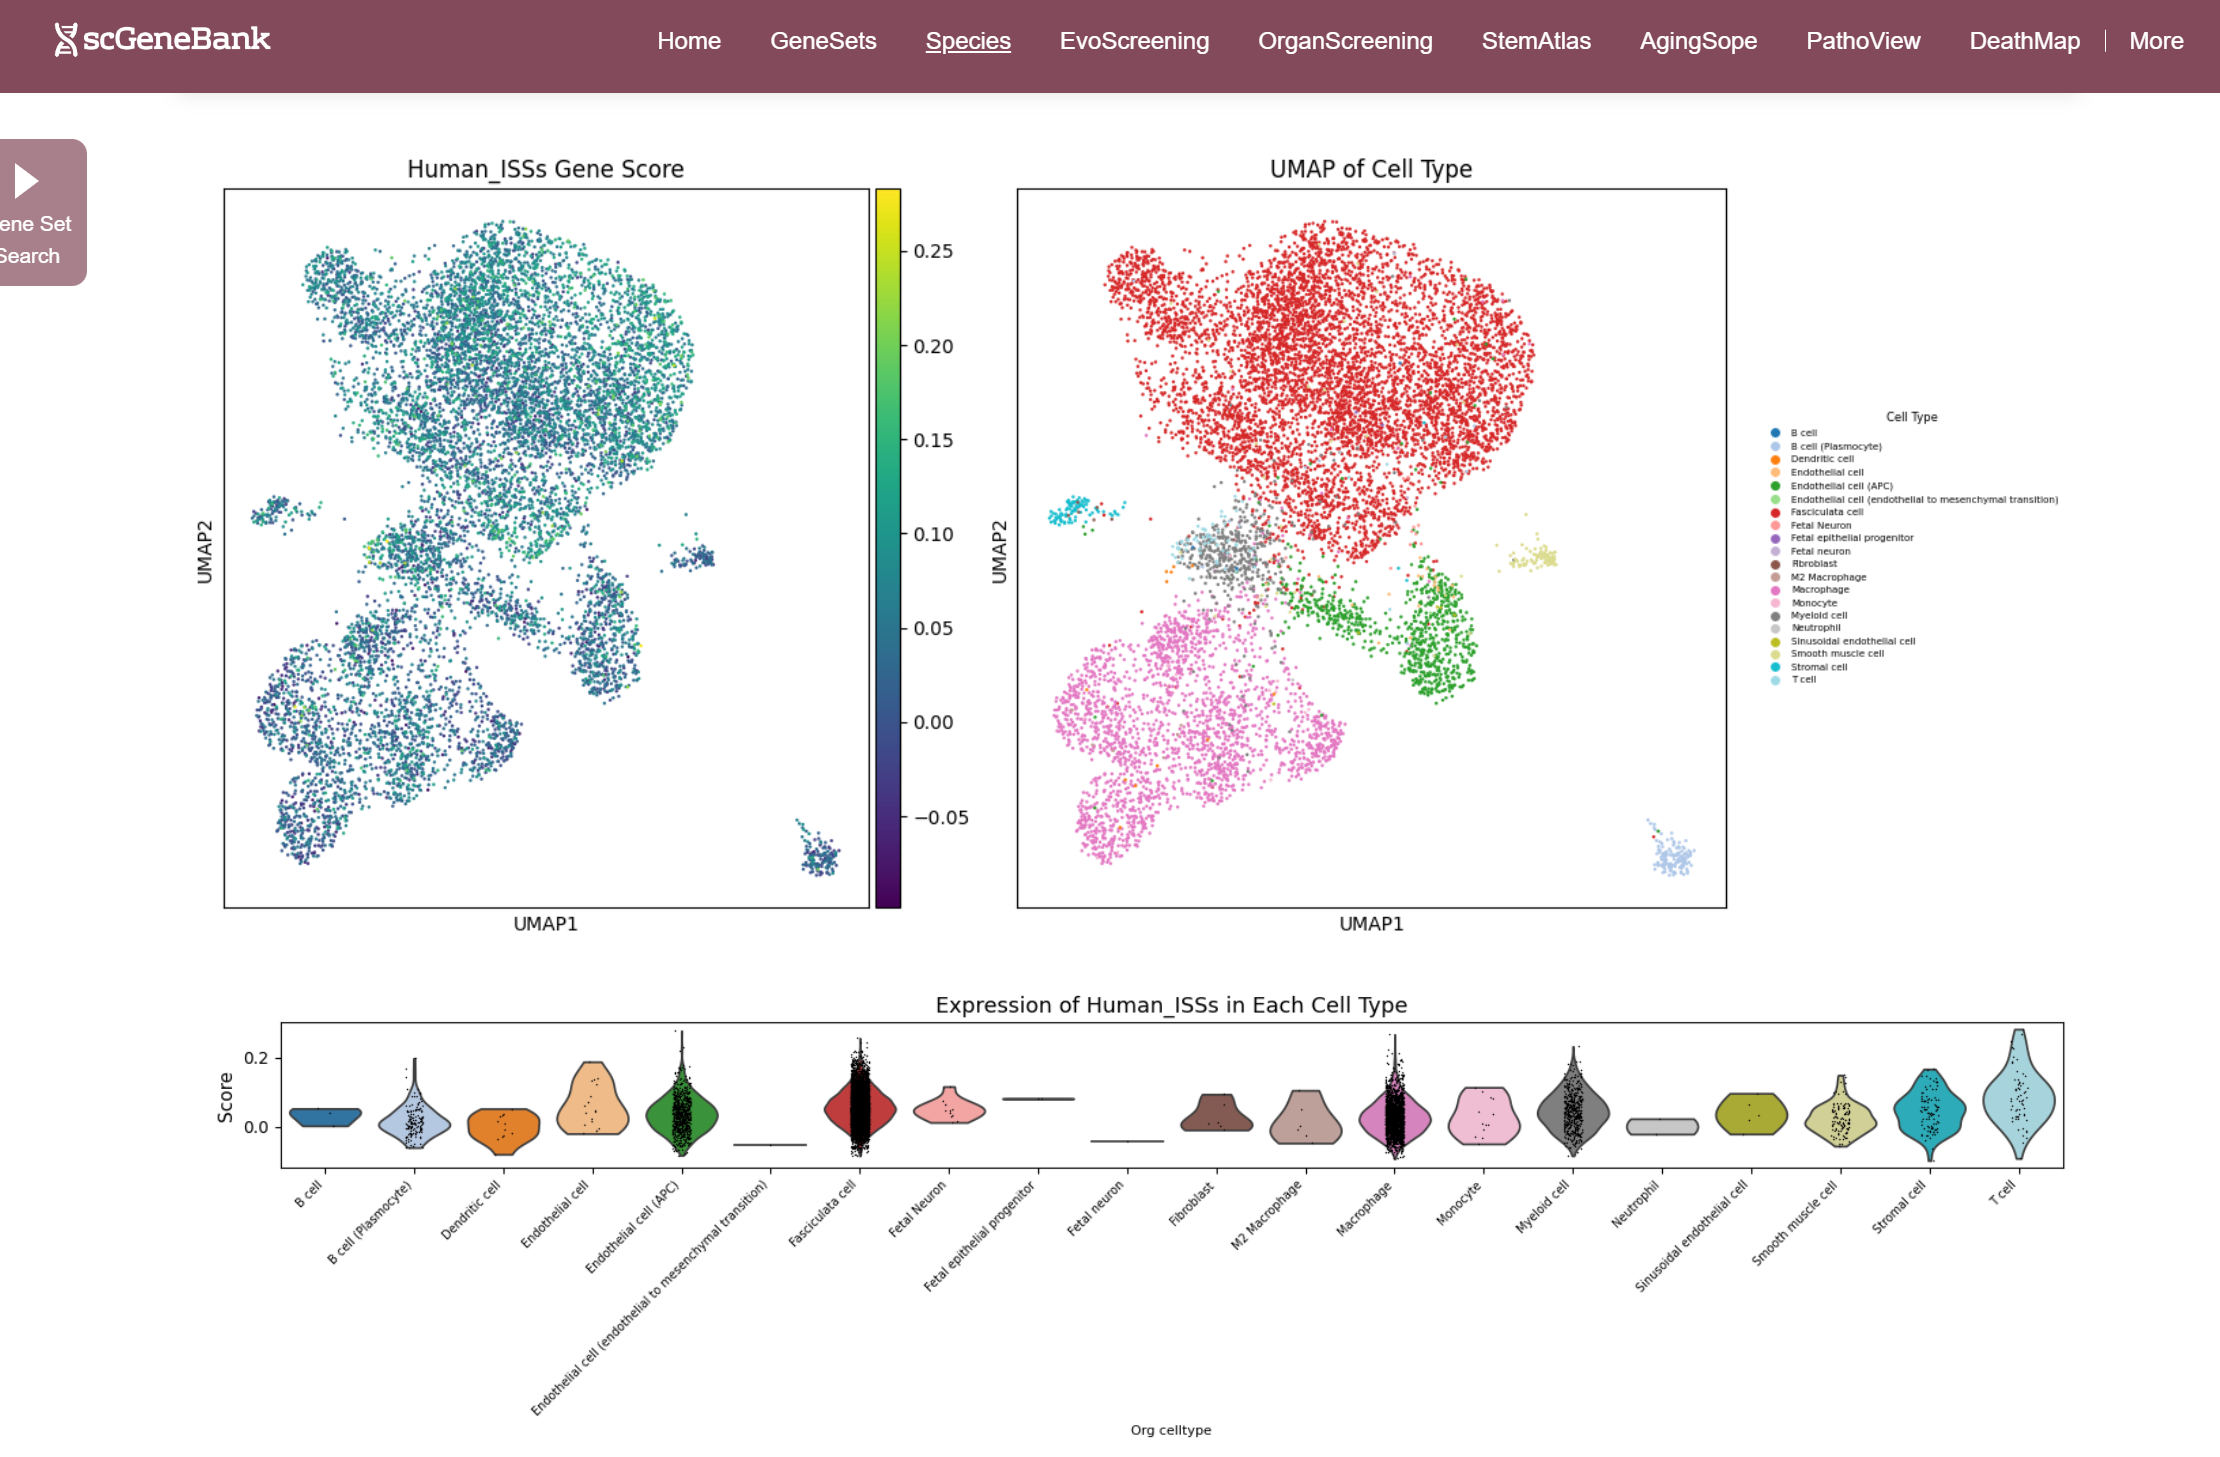
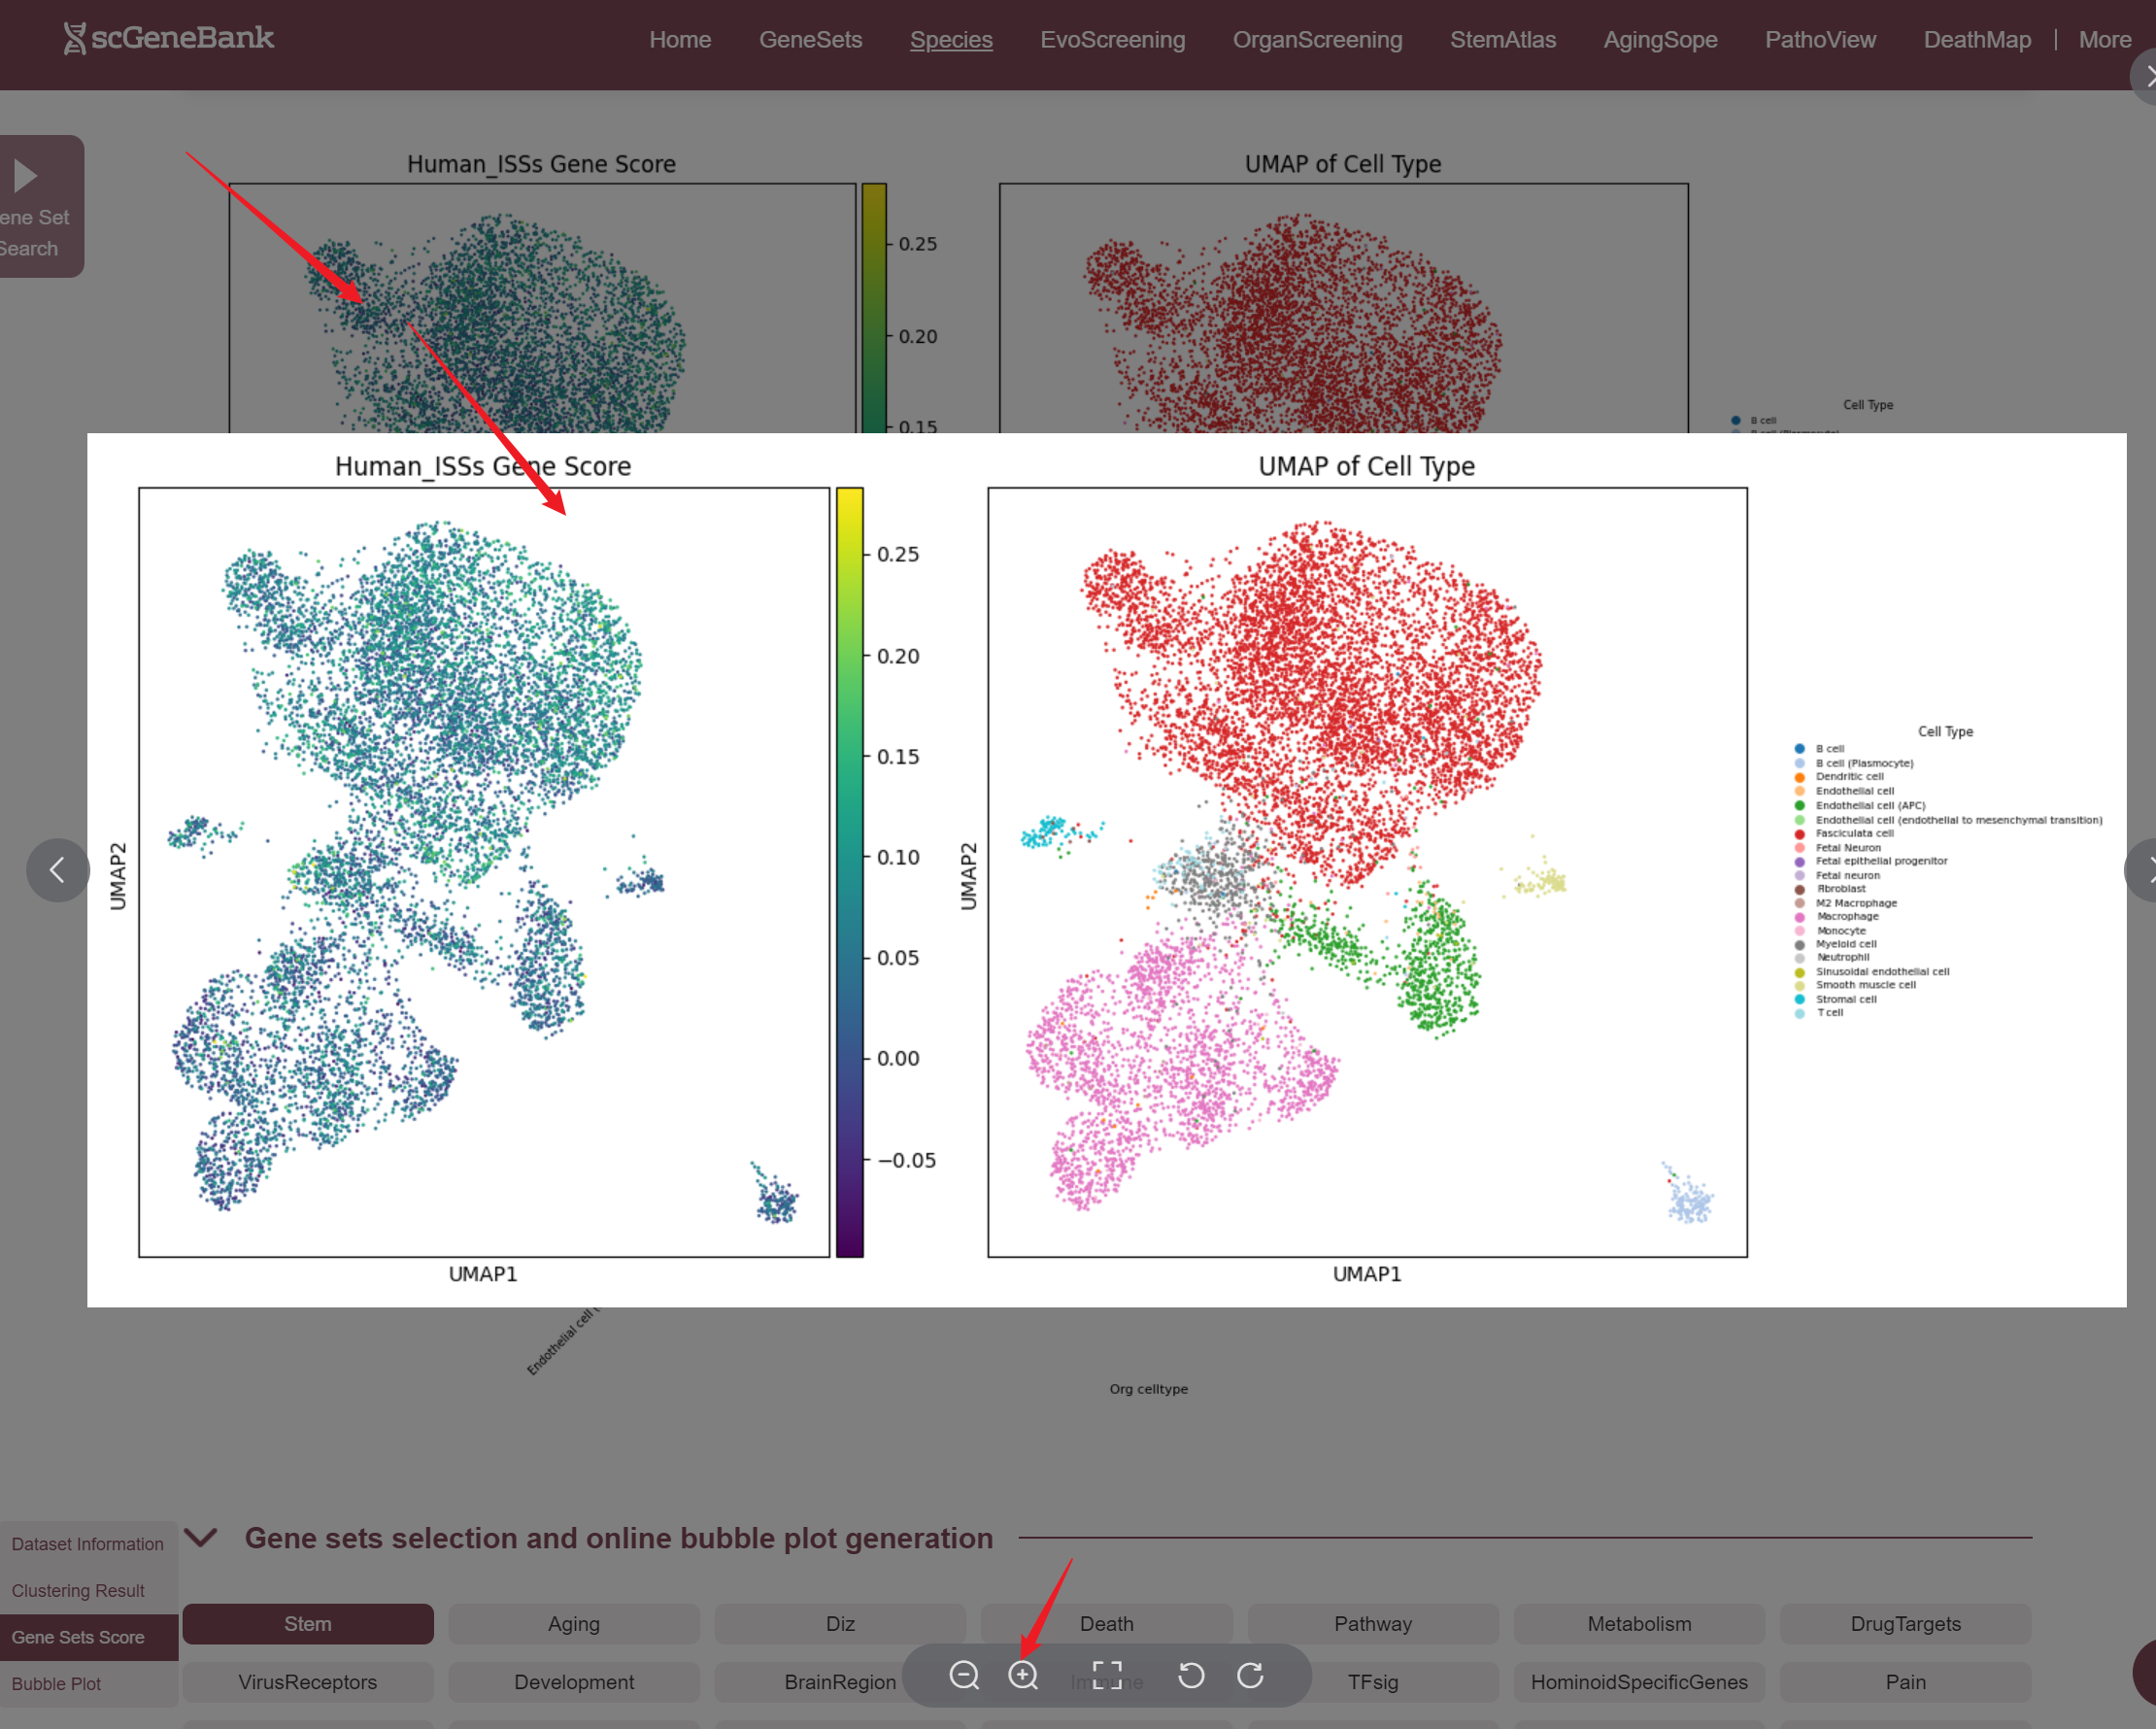
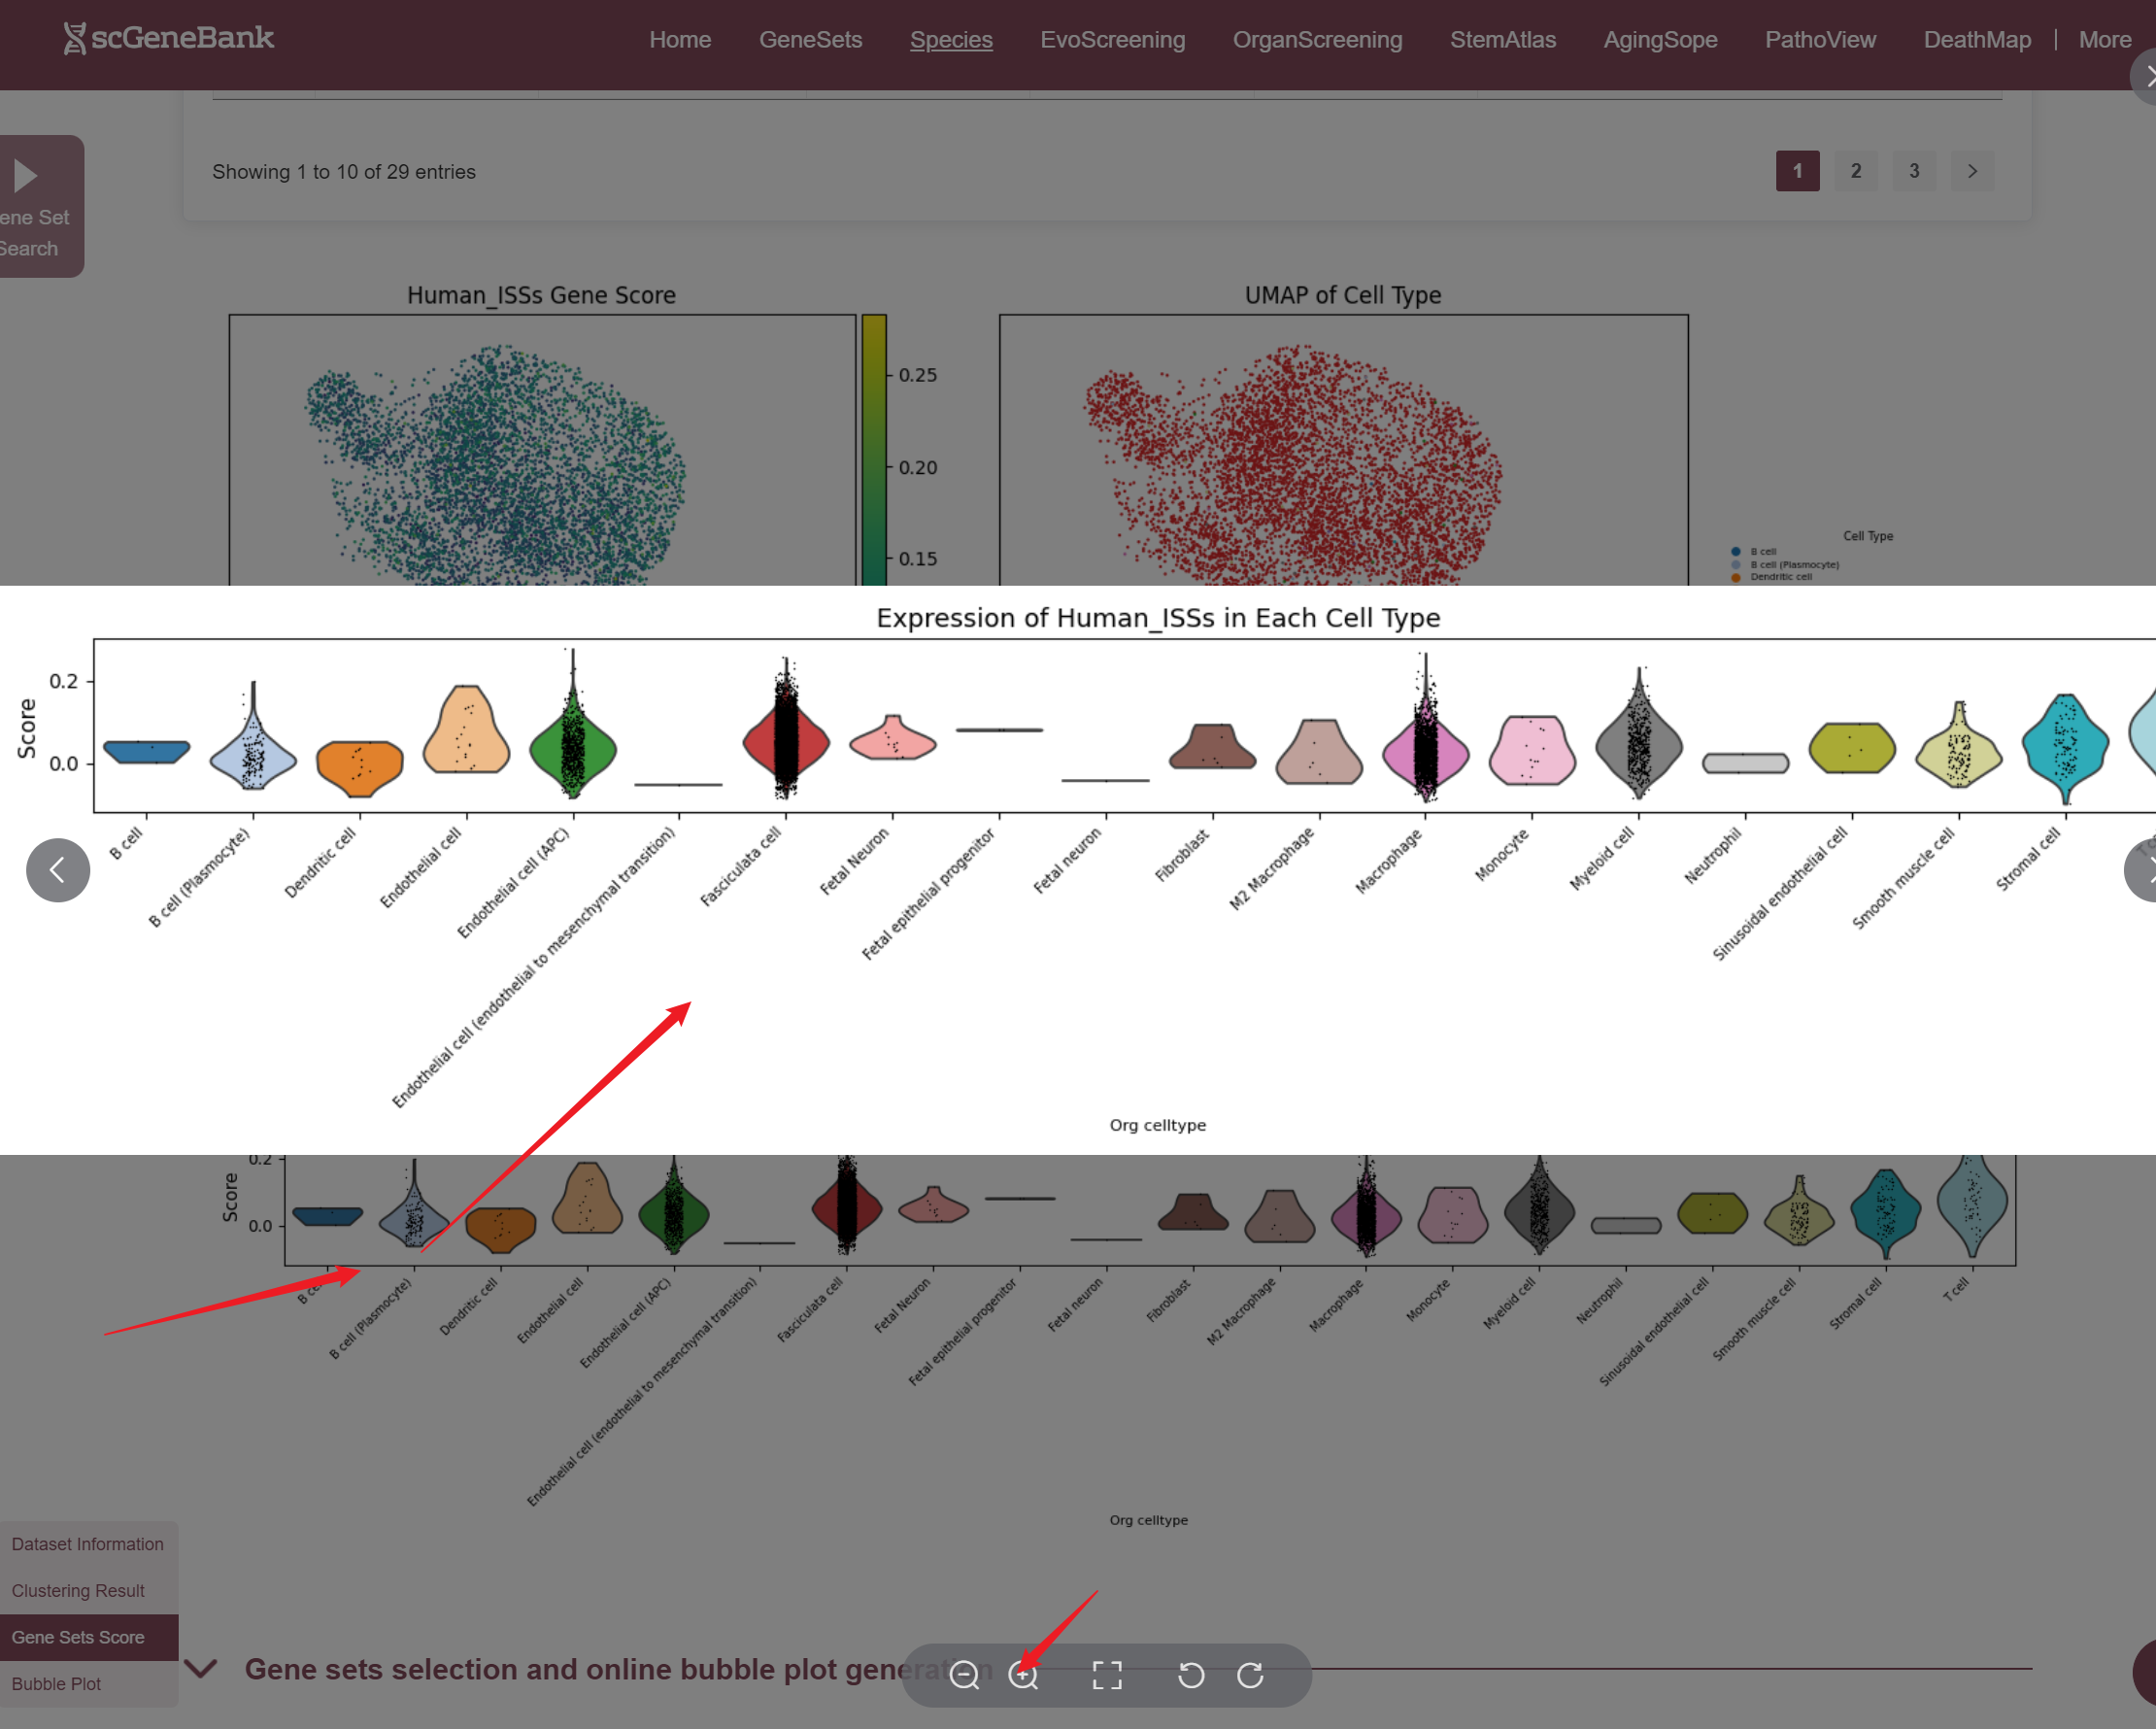
Once selected, three visualizations are generated: a UMAP plot showing gene set activity across all cells (colored by score), a UMAP plot indicating cell type assignments, and a violin plot displaying the distribution of gene set activity across cell types. Those plots can be enlarged by clicking.
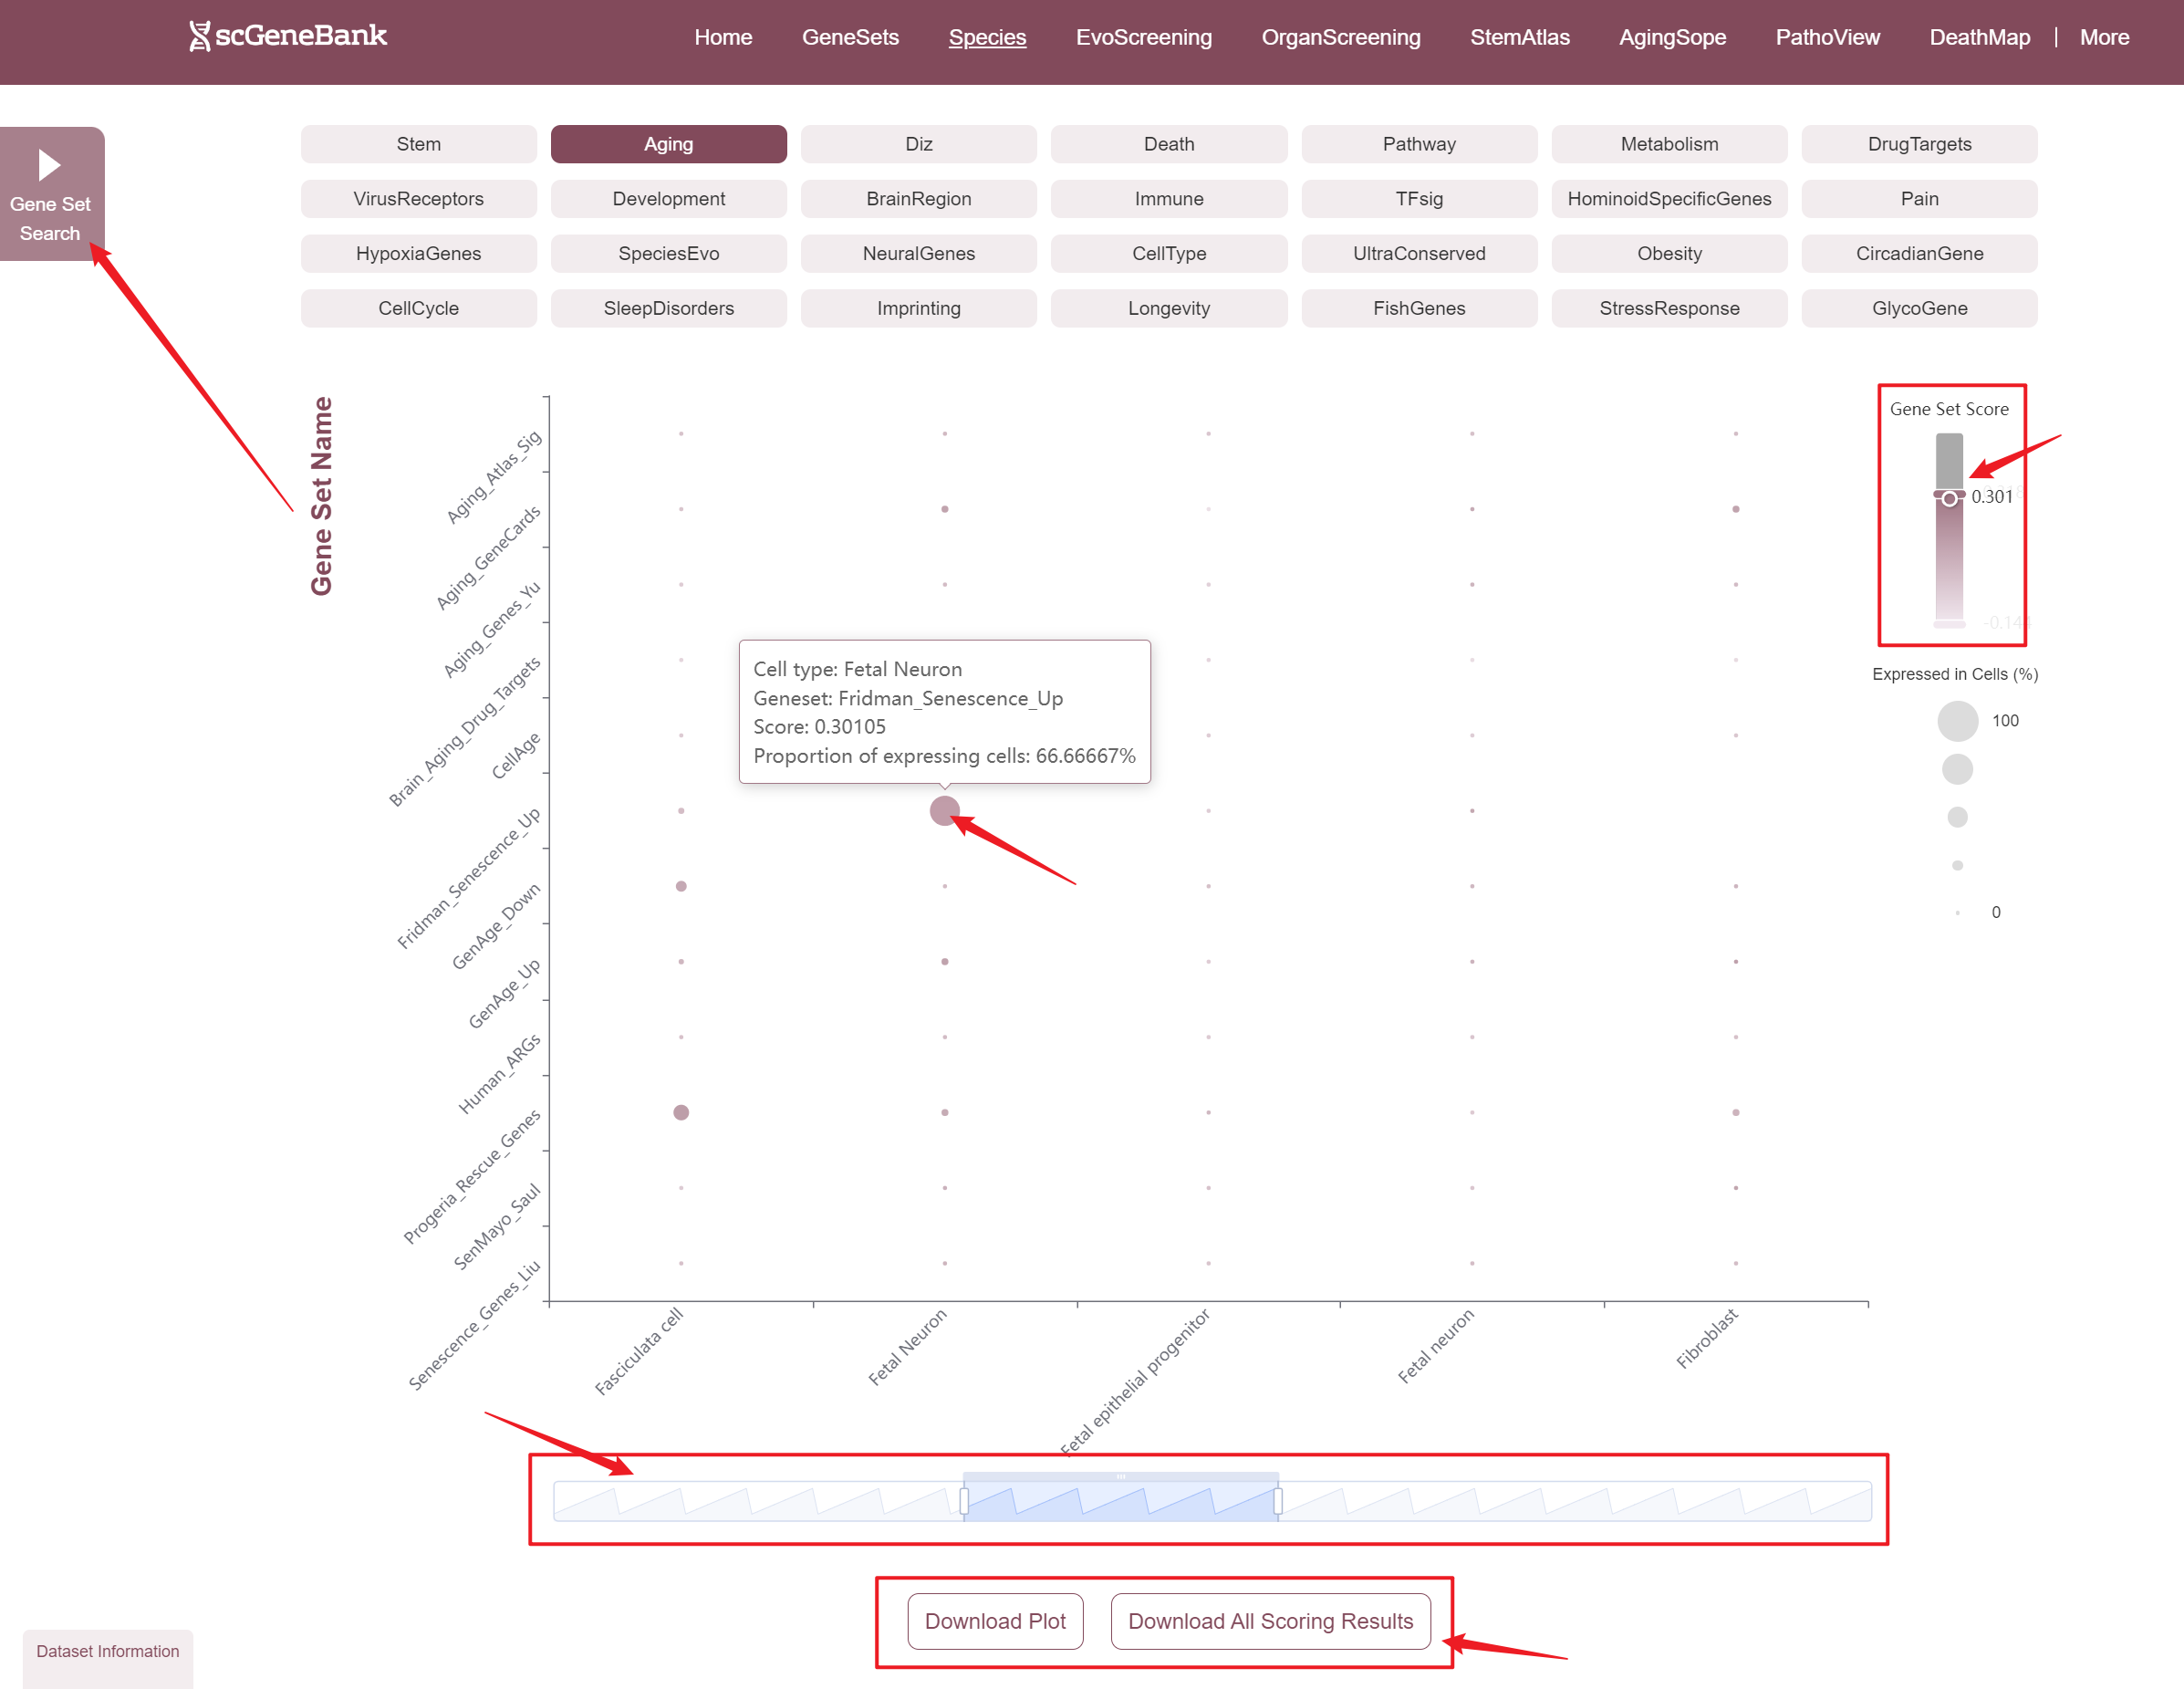
The fourth section allows users to explore and compare the expression of multiple gene sets across different cell types using a bubble plot visualization. Users can select a functional gene category to generate a bubble plot where the color intensity of each bubble represents the average gene set score in each cell type, and the bubble size reflects the proportion of cells expressing the gene set.
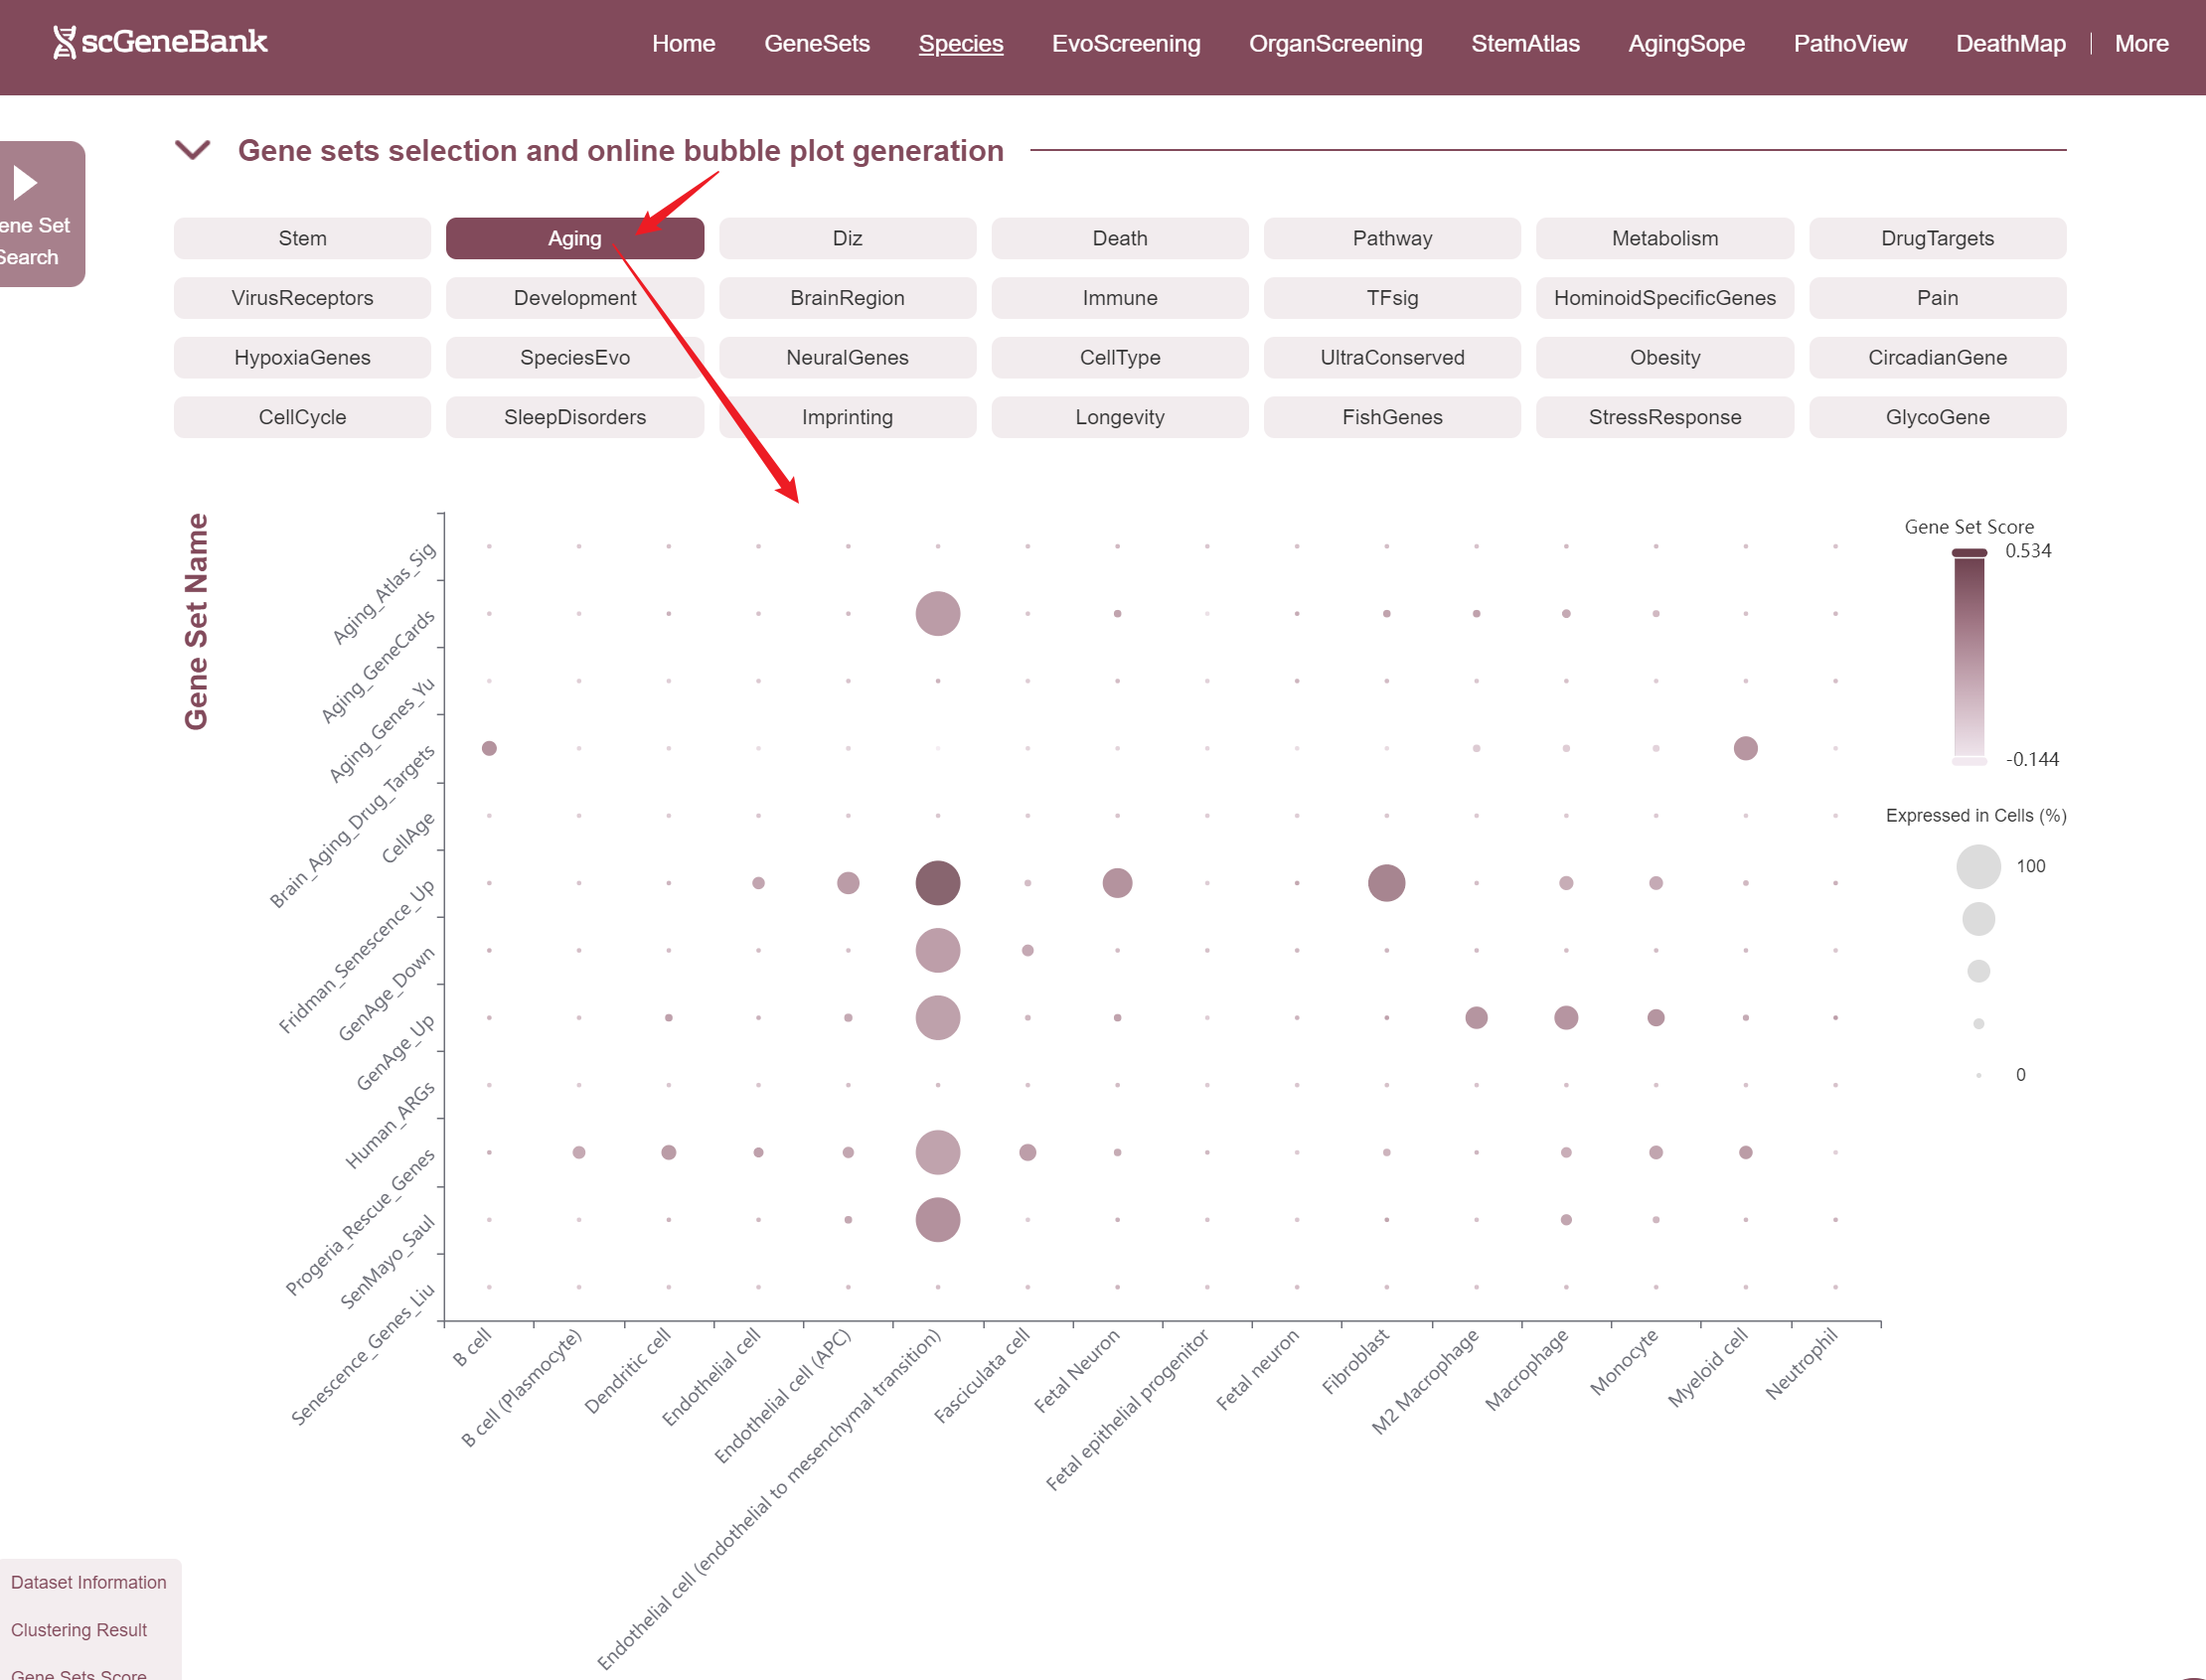
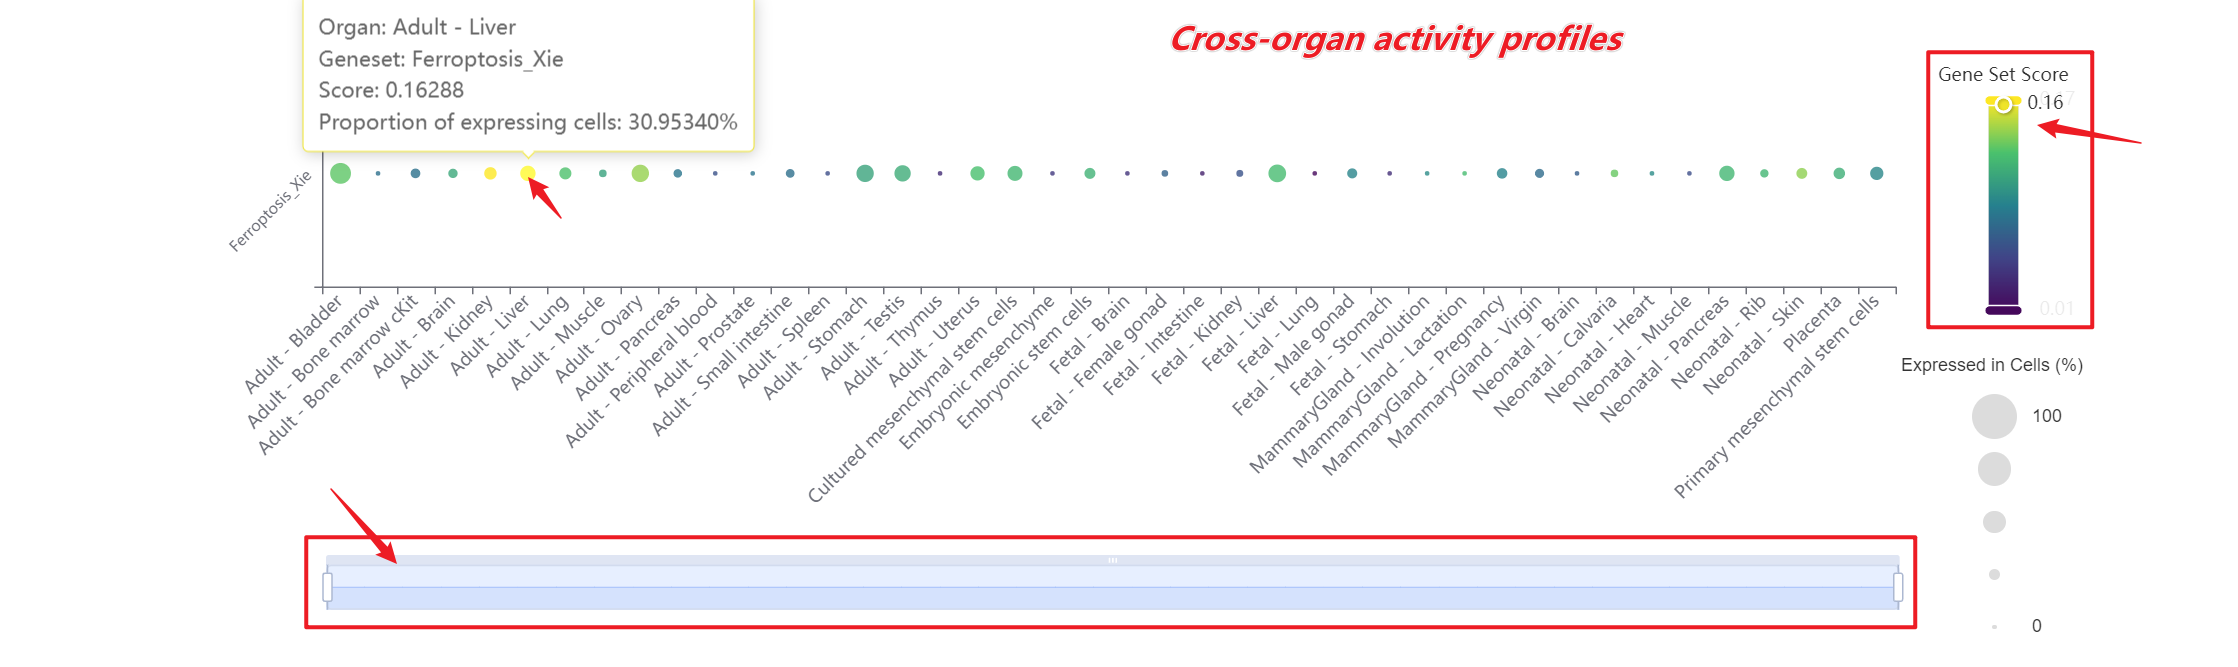
Users can drag the "Gene Set Score" color bar to filter values by gene activity or adjust the horizontal axis width below to refine cells of interest. Hovering over bubbles reveals detailed information, while clicking "Gene Set Search" (top-left) allows querying specific gene sets for comprehensive data. Both the score table and bubble plot can be downloaded for further analysis or presentation.
-
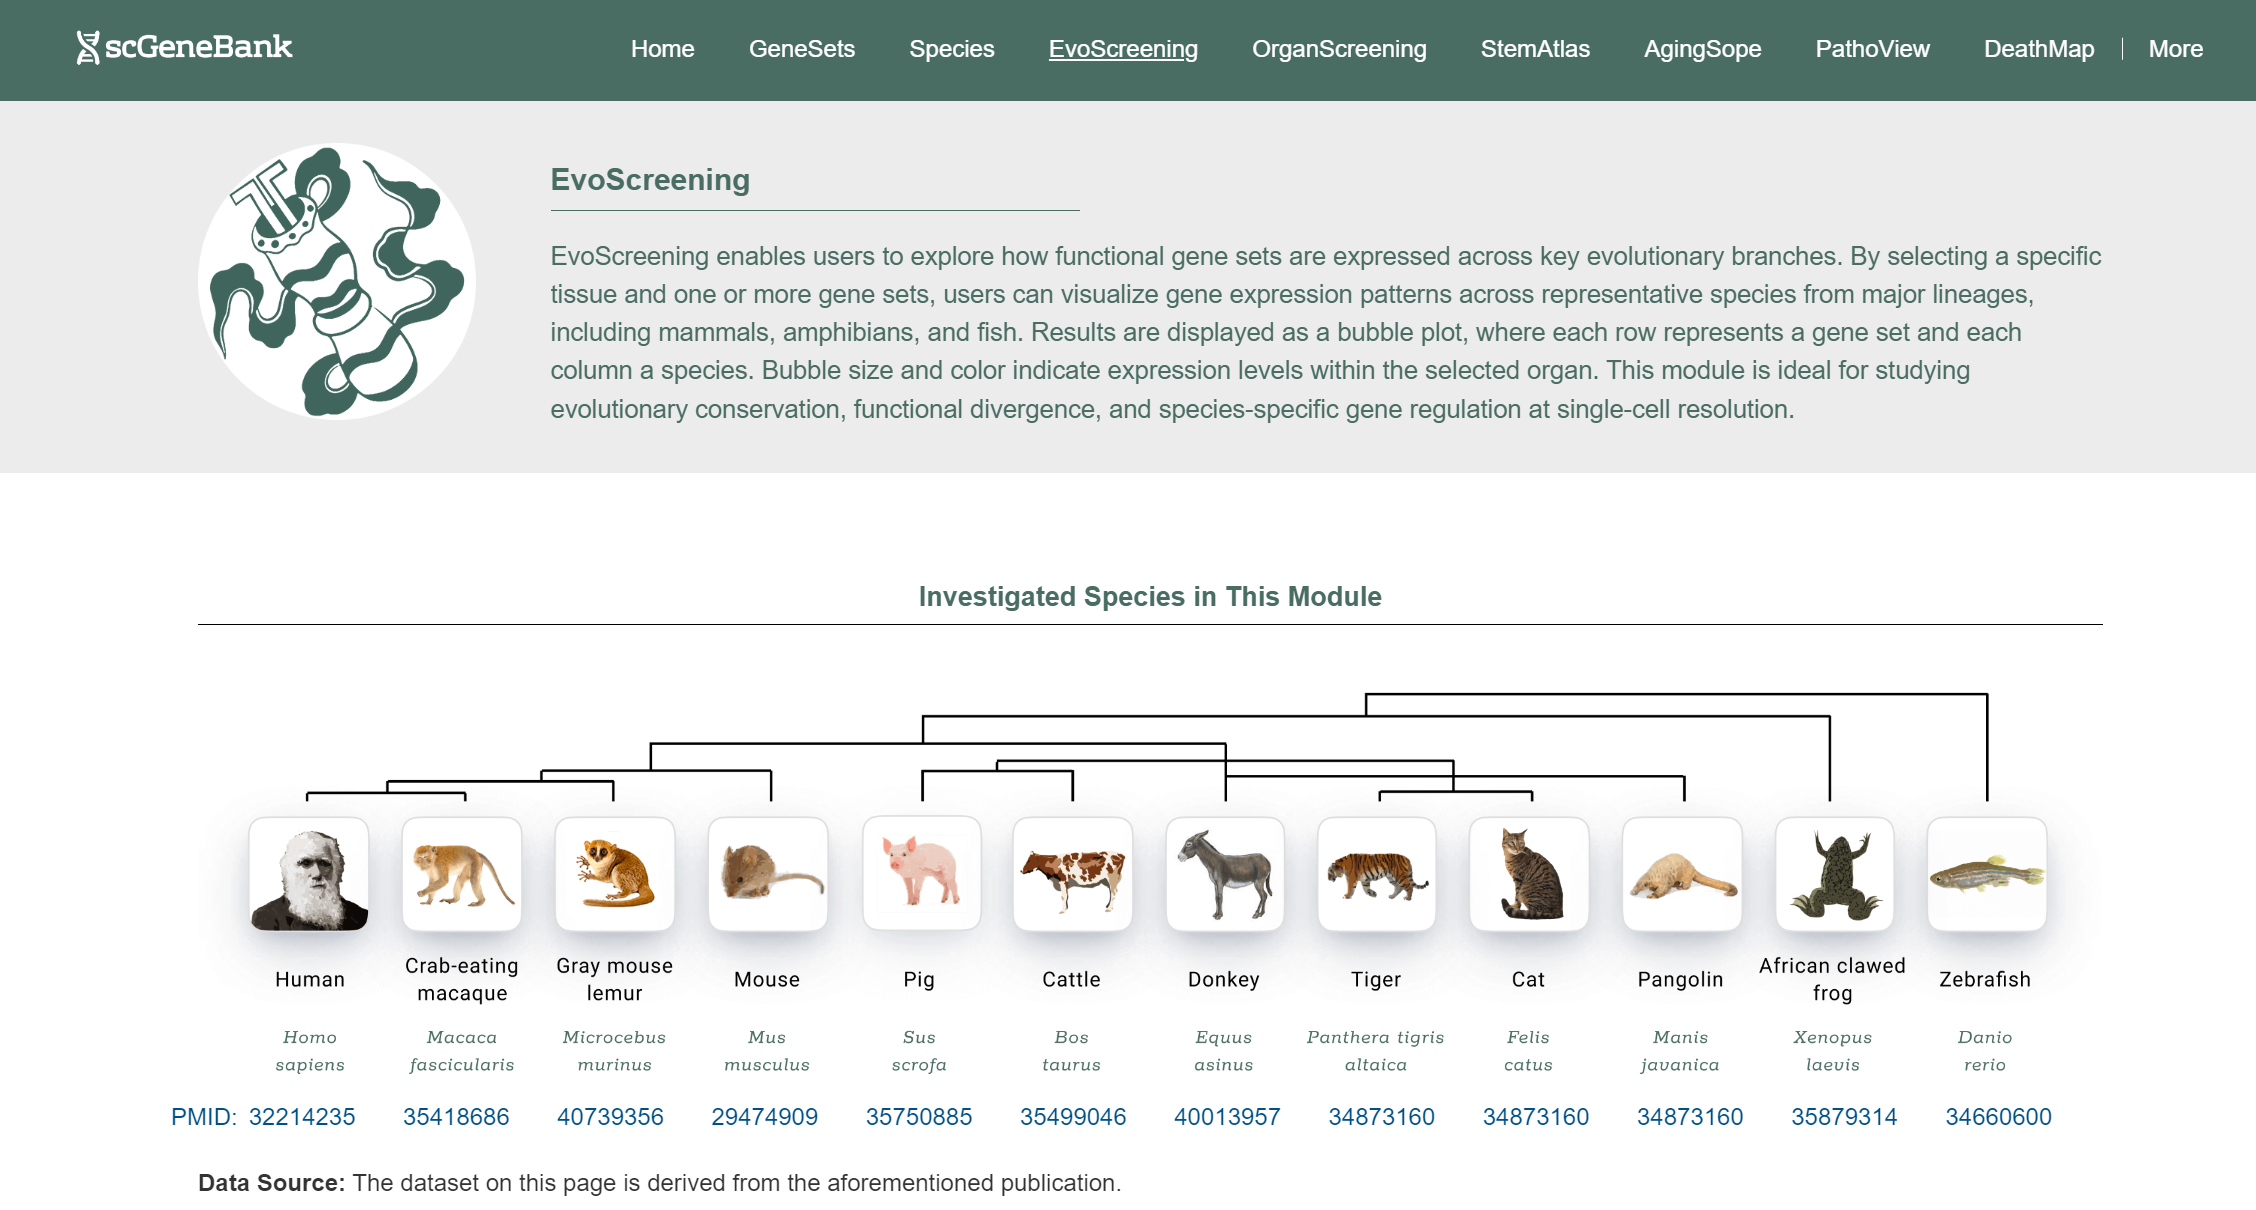
Tutorial of EvoScreening
EvoScreening enables users to explore how functional gene sets are expressed across key evolutionary branches within a selected organ type. The module includes whole-body atlas from 12 species: human, crab-eating macaque, mouse lemur, mouse, pig, cattle, donkey, tiger, domestic cat, pangolin, African clawed frog, and zebrafish.
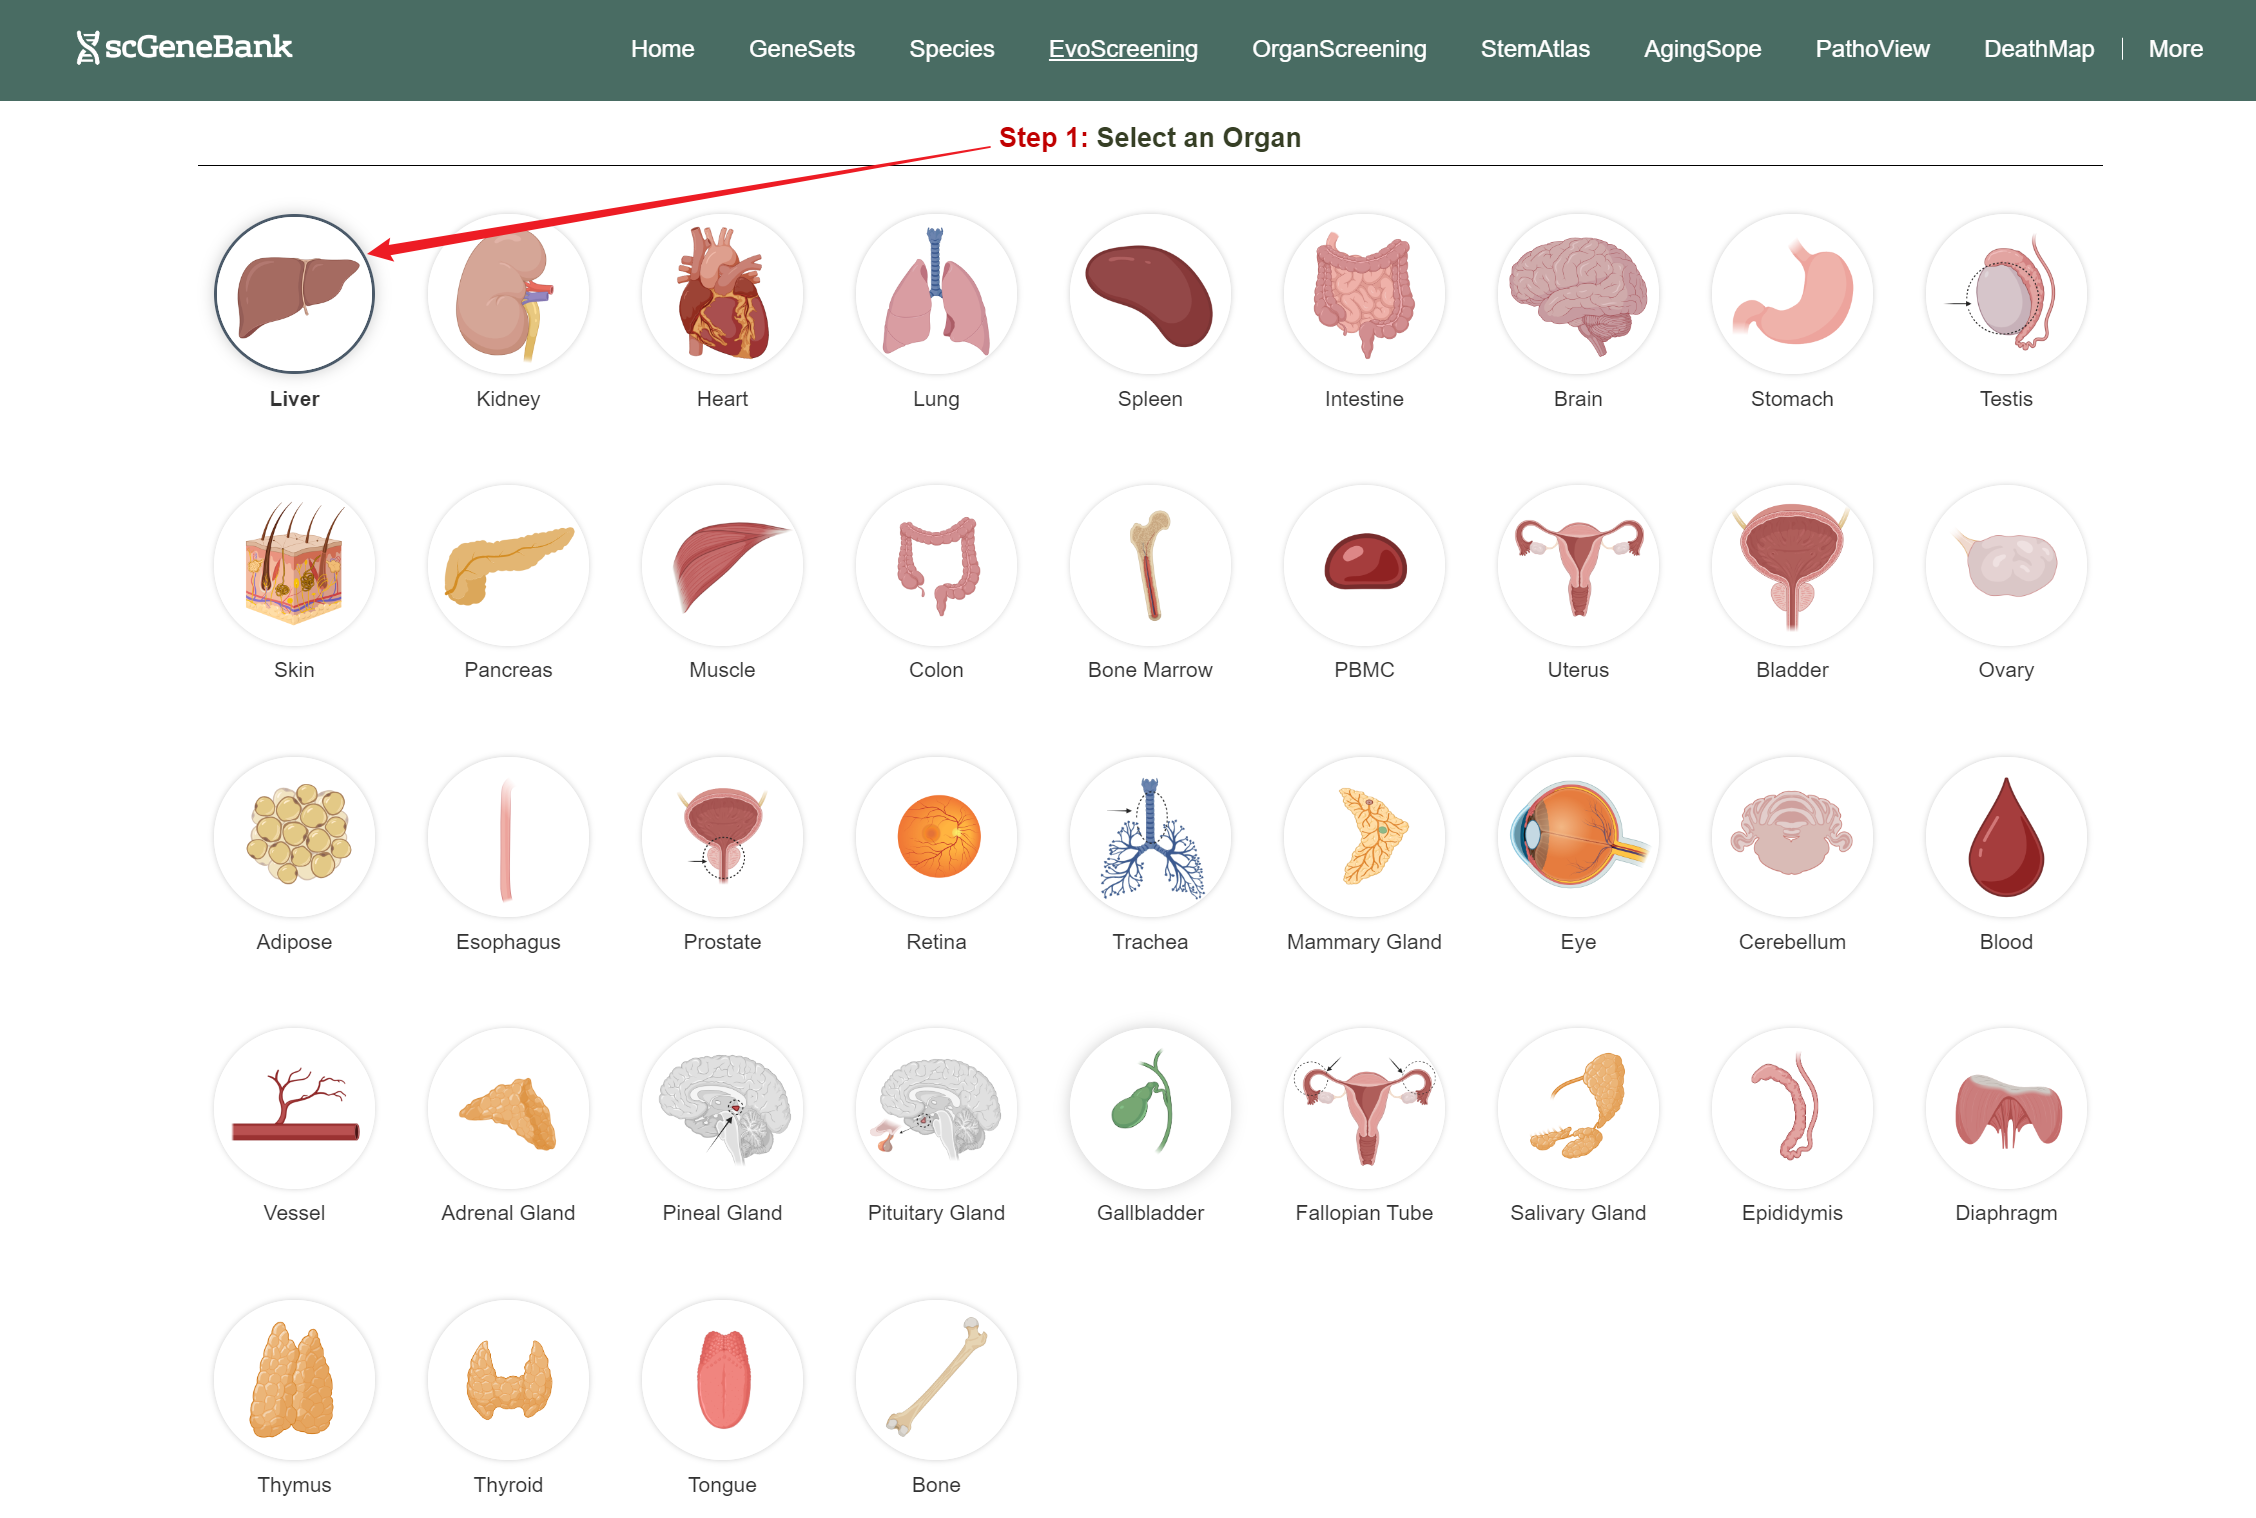
To begin, click on an organ antomical icon in the Step 1 panel.
Step 1
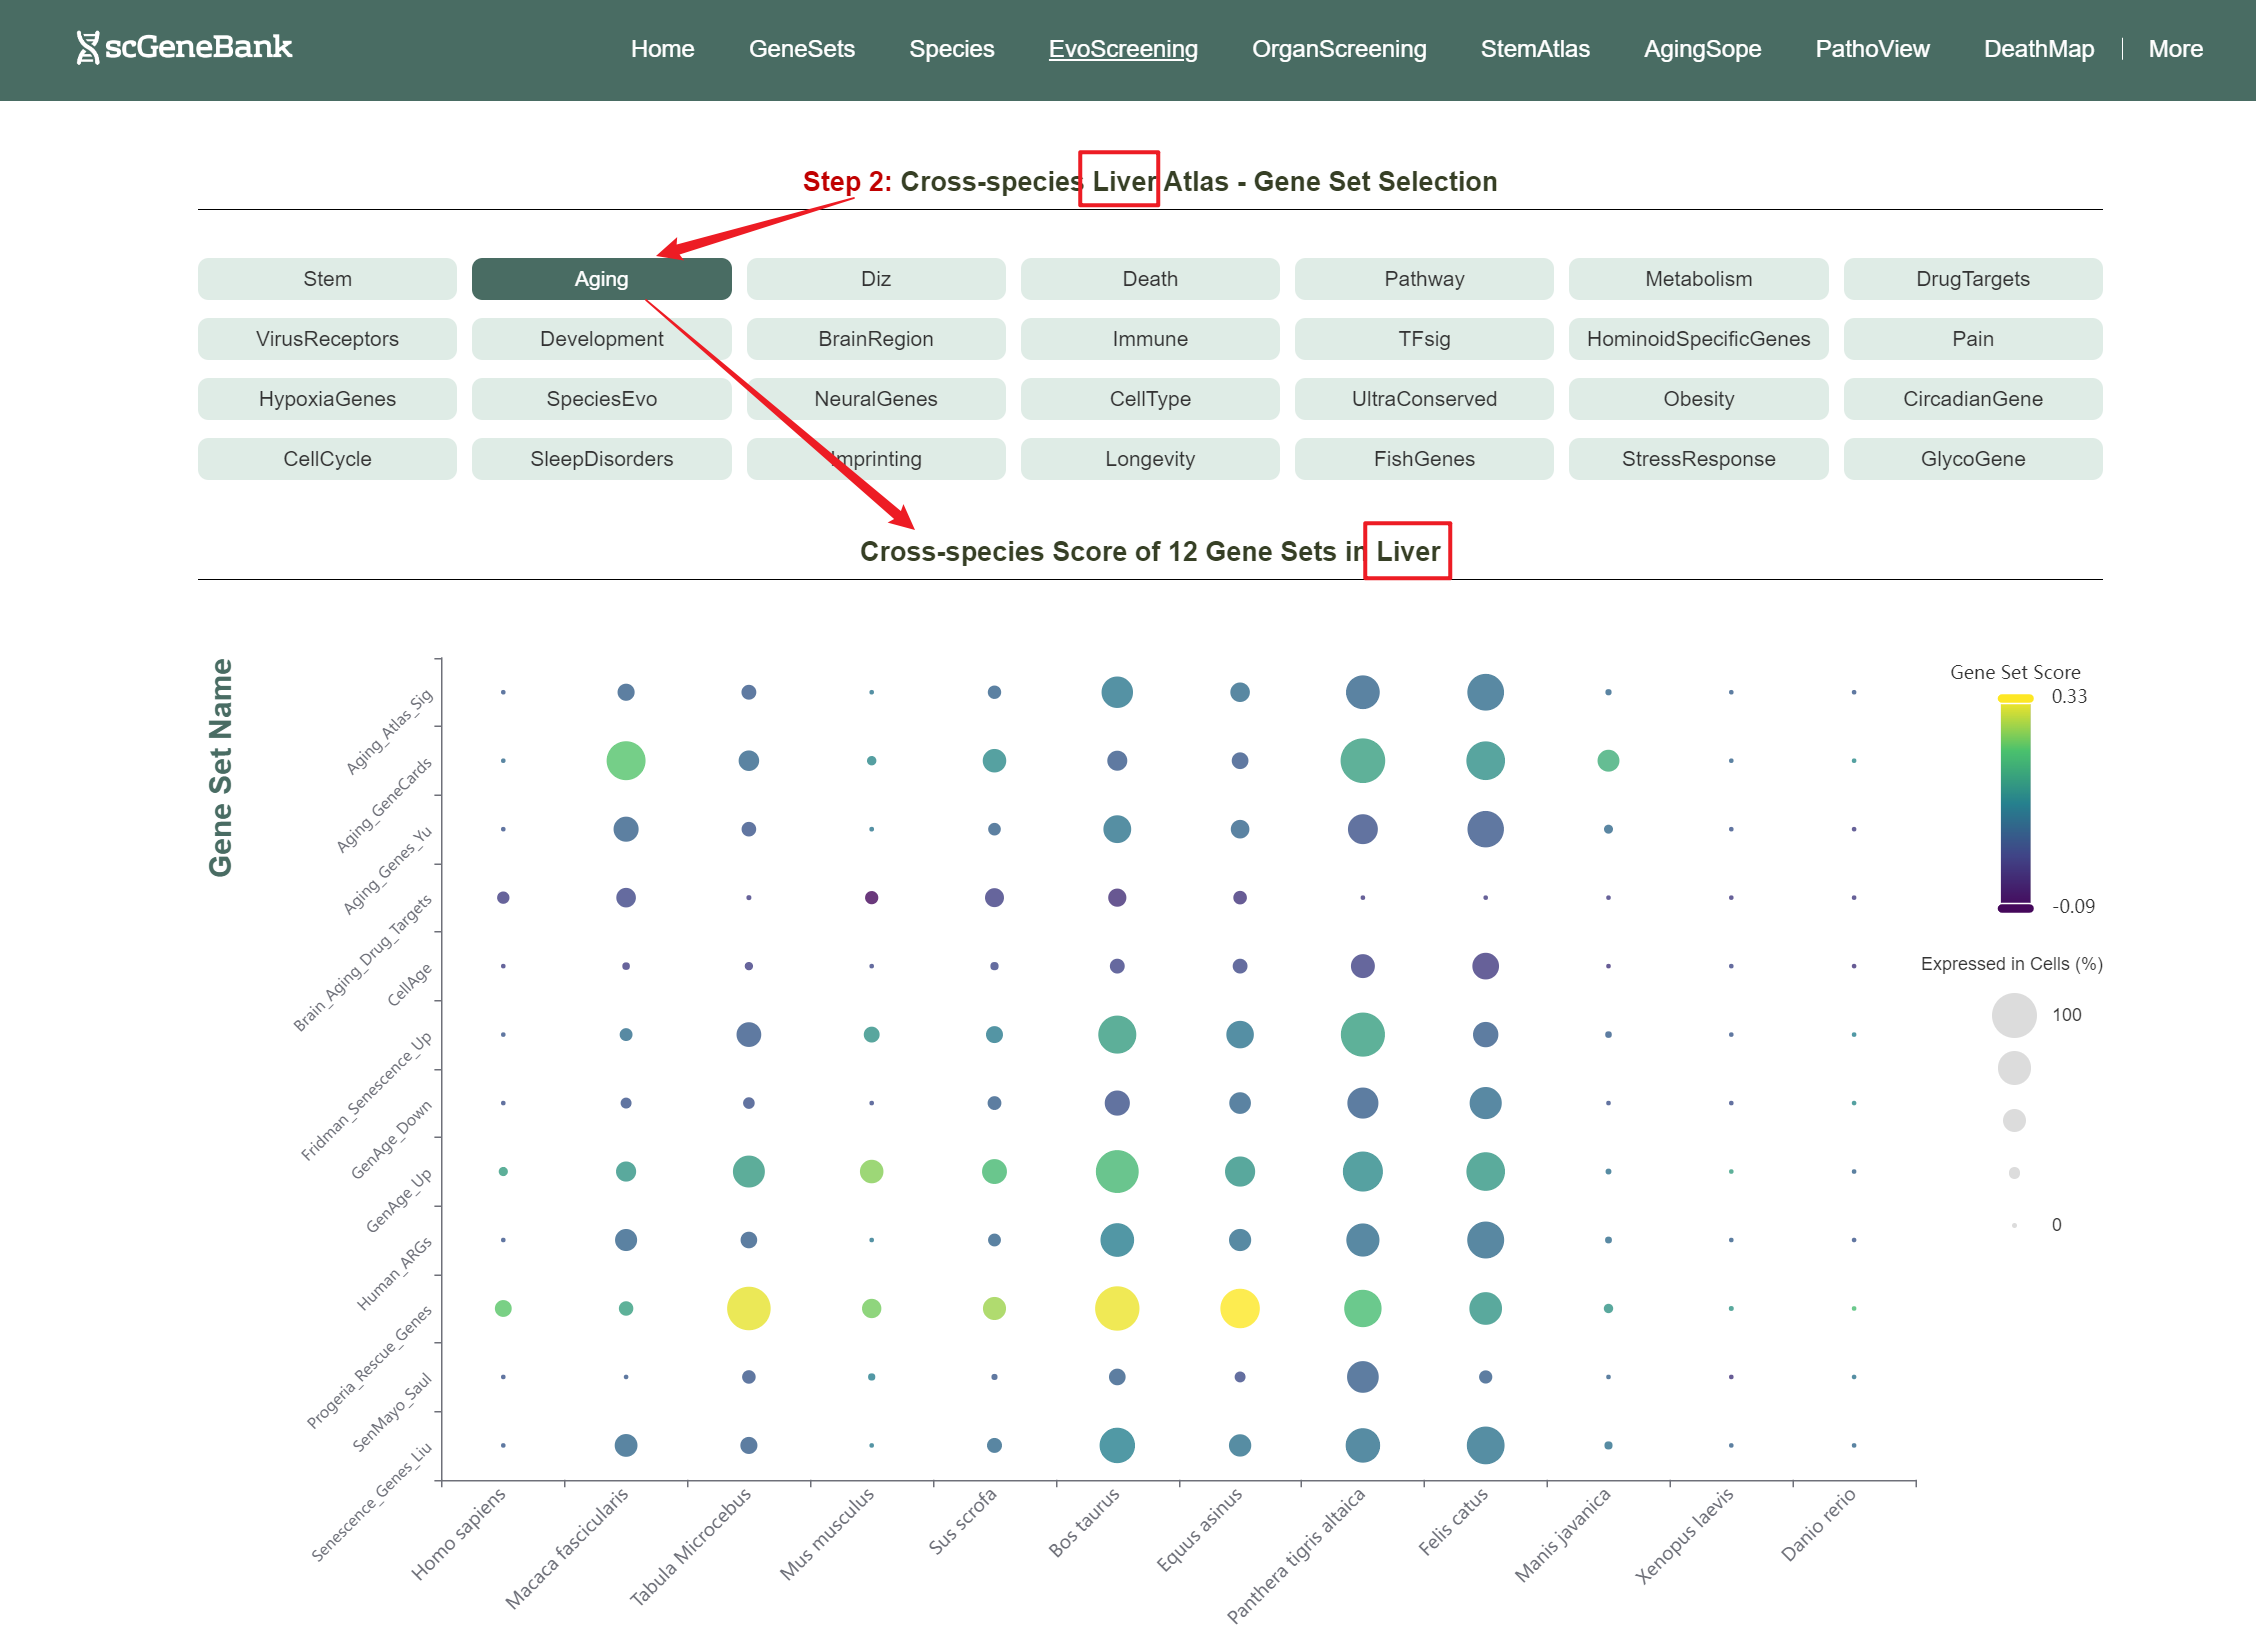
Then, choose a functional gene category (e.g., Aging) to generate a bubble plot showing gene set activity within selected organ across species. The color intensity of each bubble reflects the mean gene set score, while the bubble size indicates the proportion of cells expressing the gene set within a selected organ.
Step 2
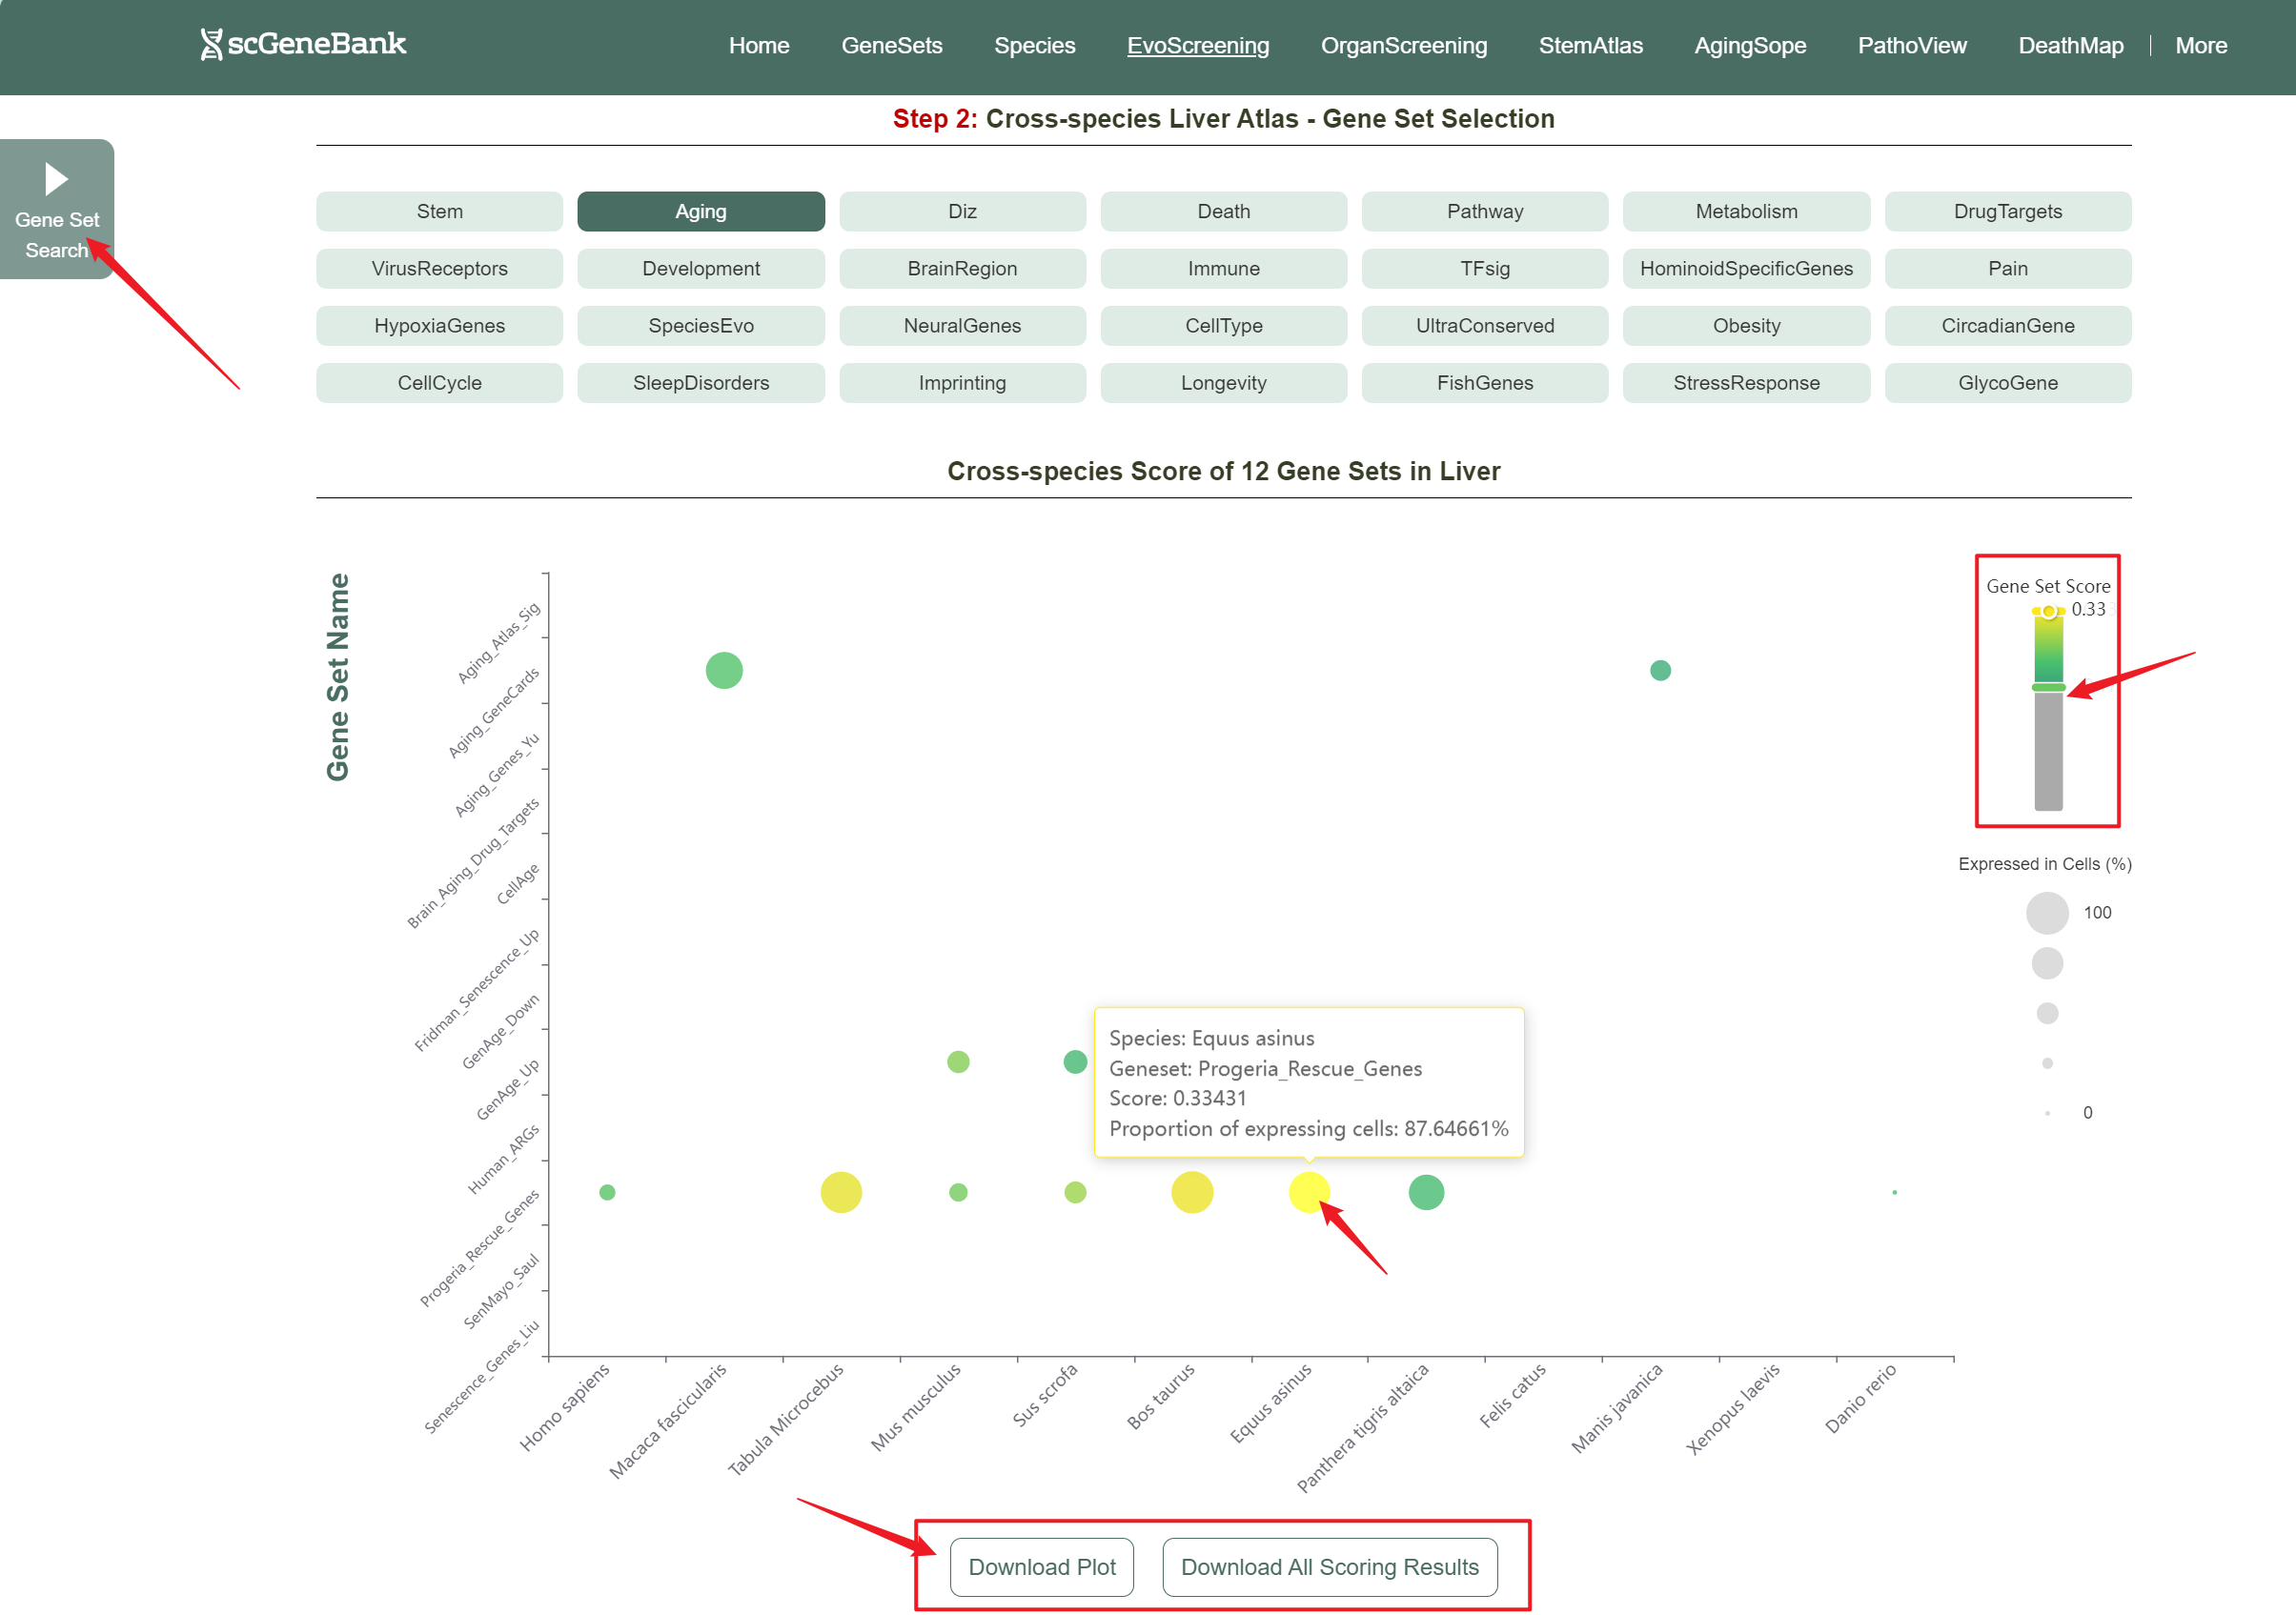
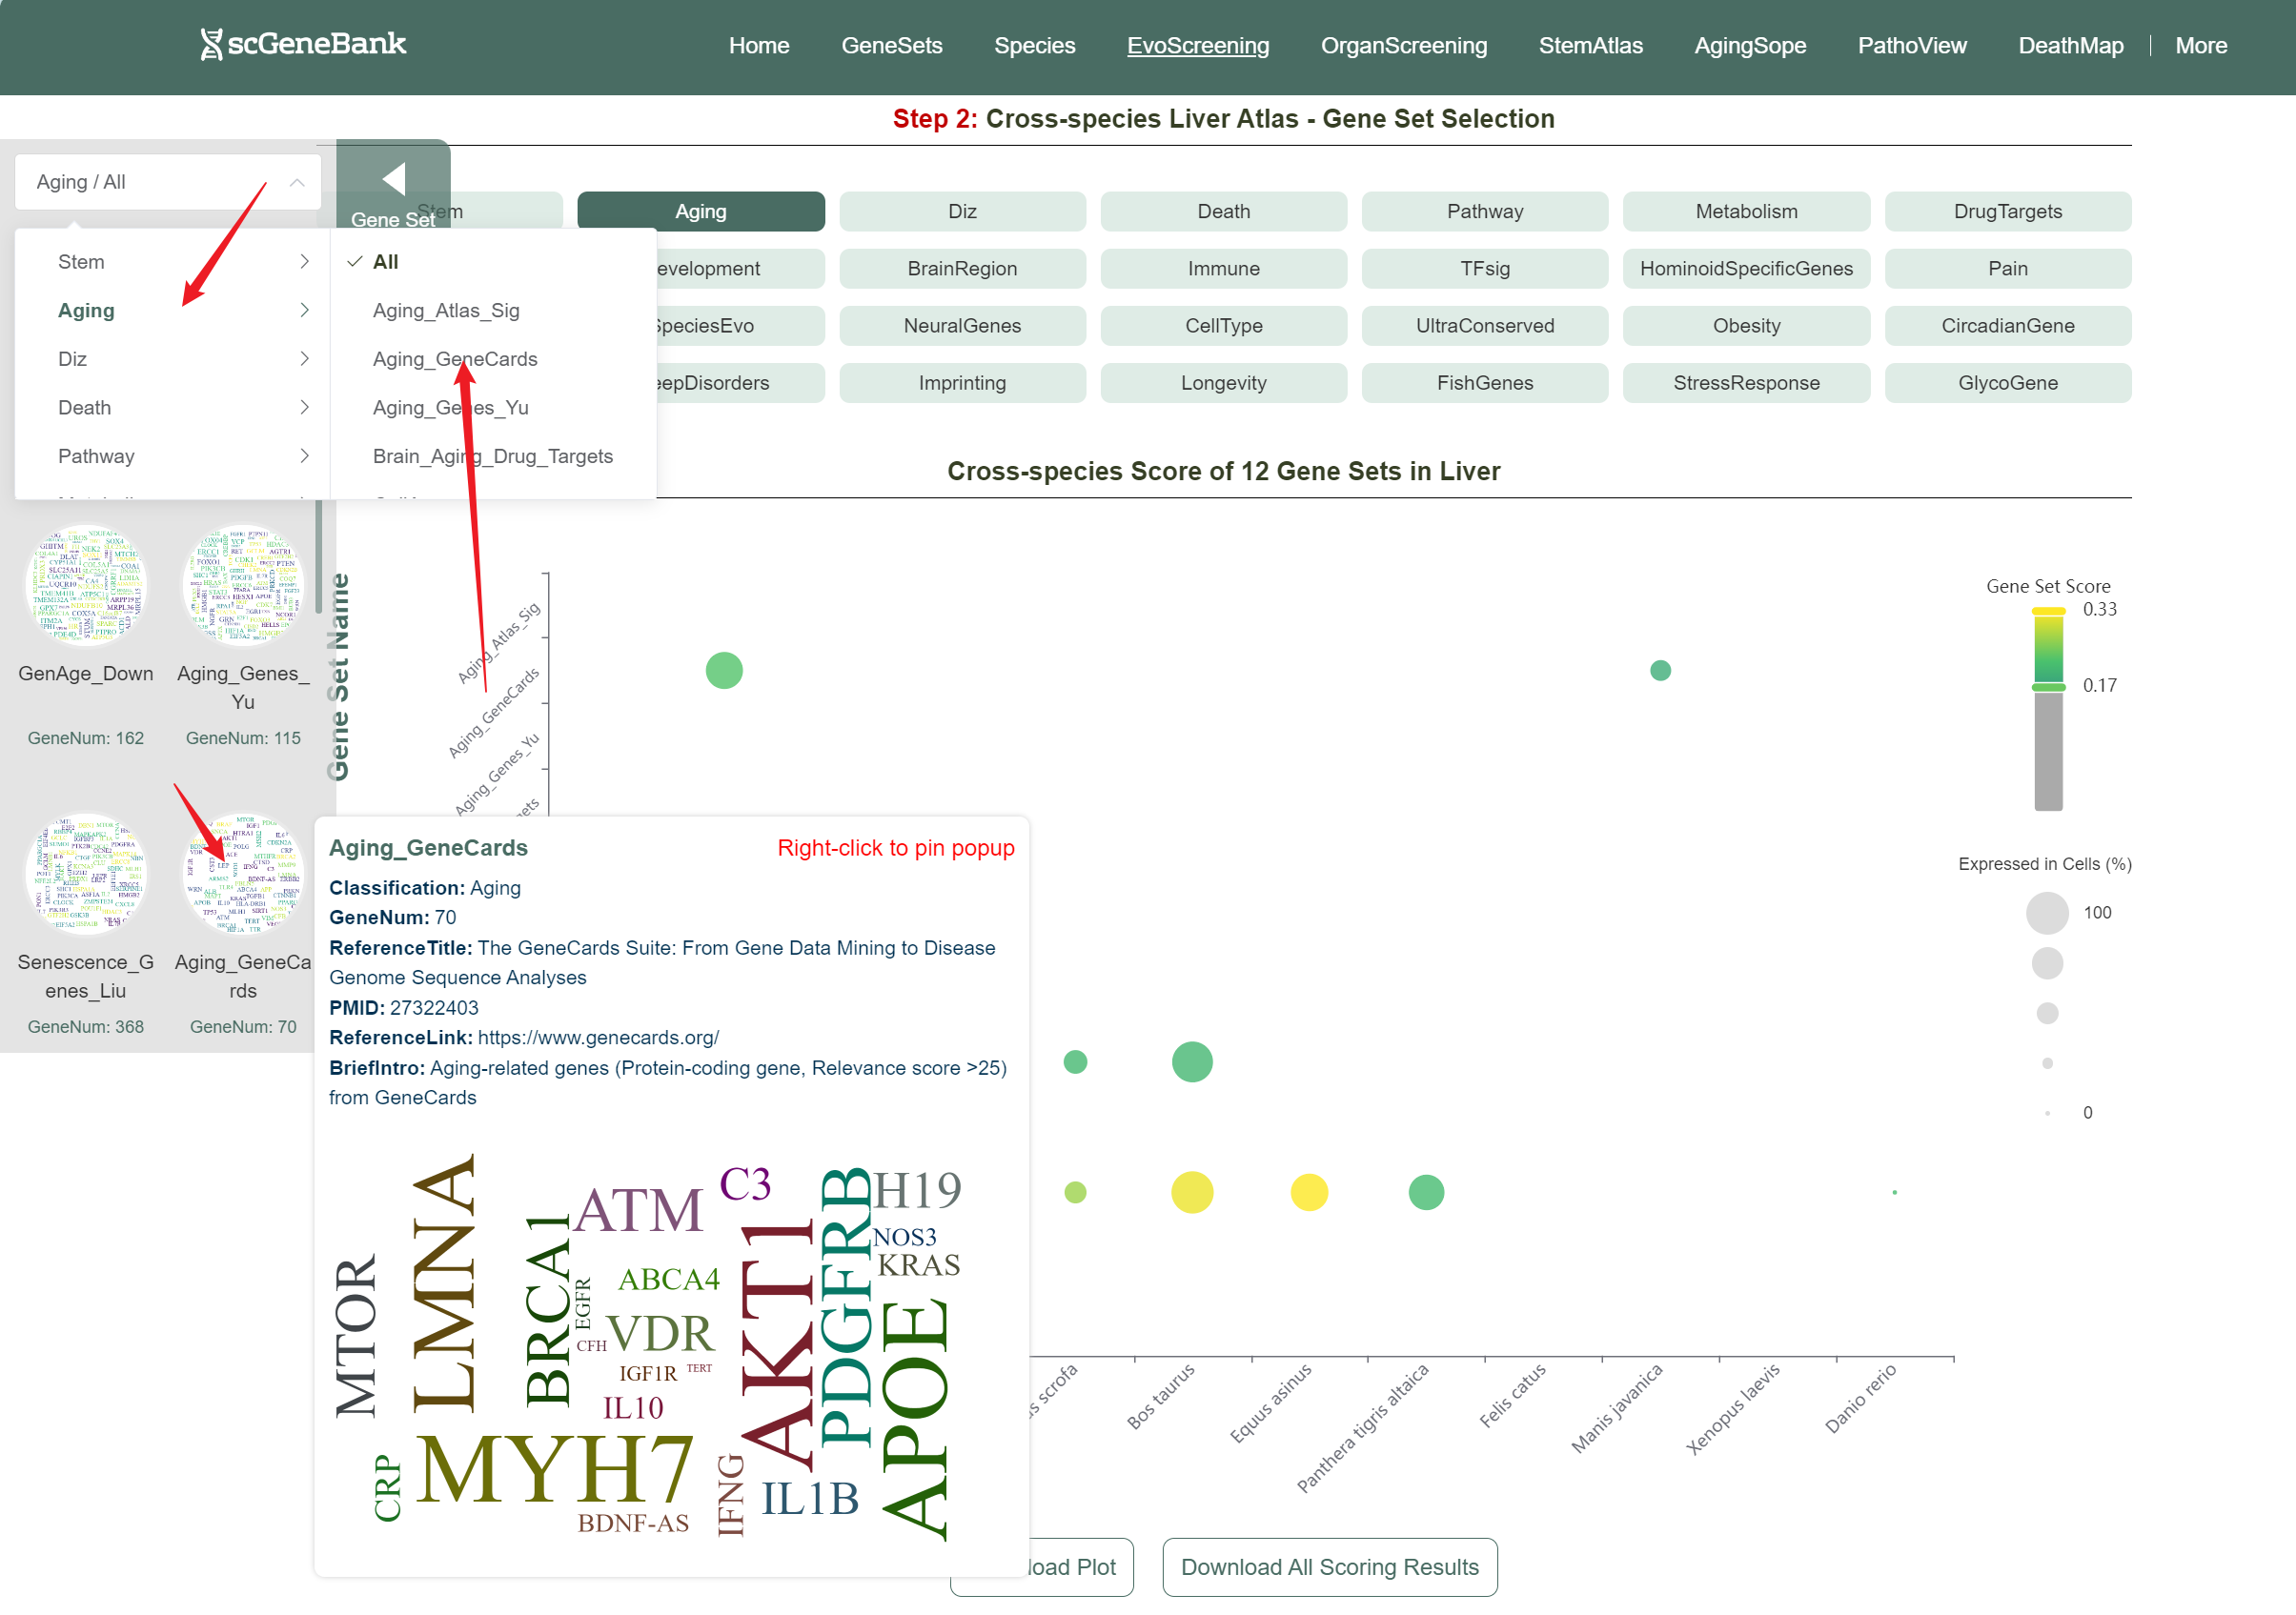
Users can drag the "Gene Set Score" color bar to filter values by gene activity. Hovering over bubbles reveals detailed information, while clicking "Gene Set Search" (top-left) allows querying specific gene sets for comprehensive data. Both the score table and bubble plot can be downloaded for further analysis or presentation.
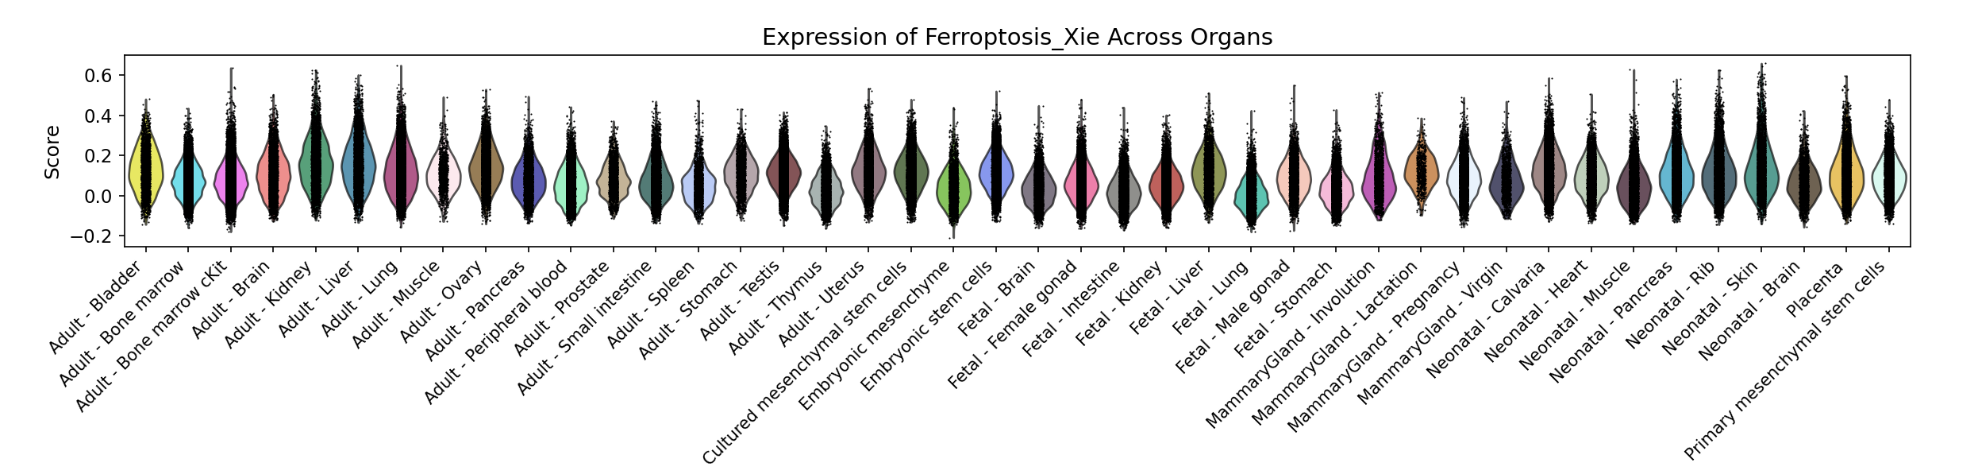
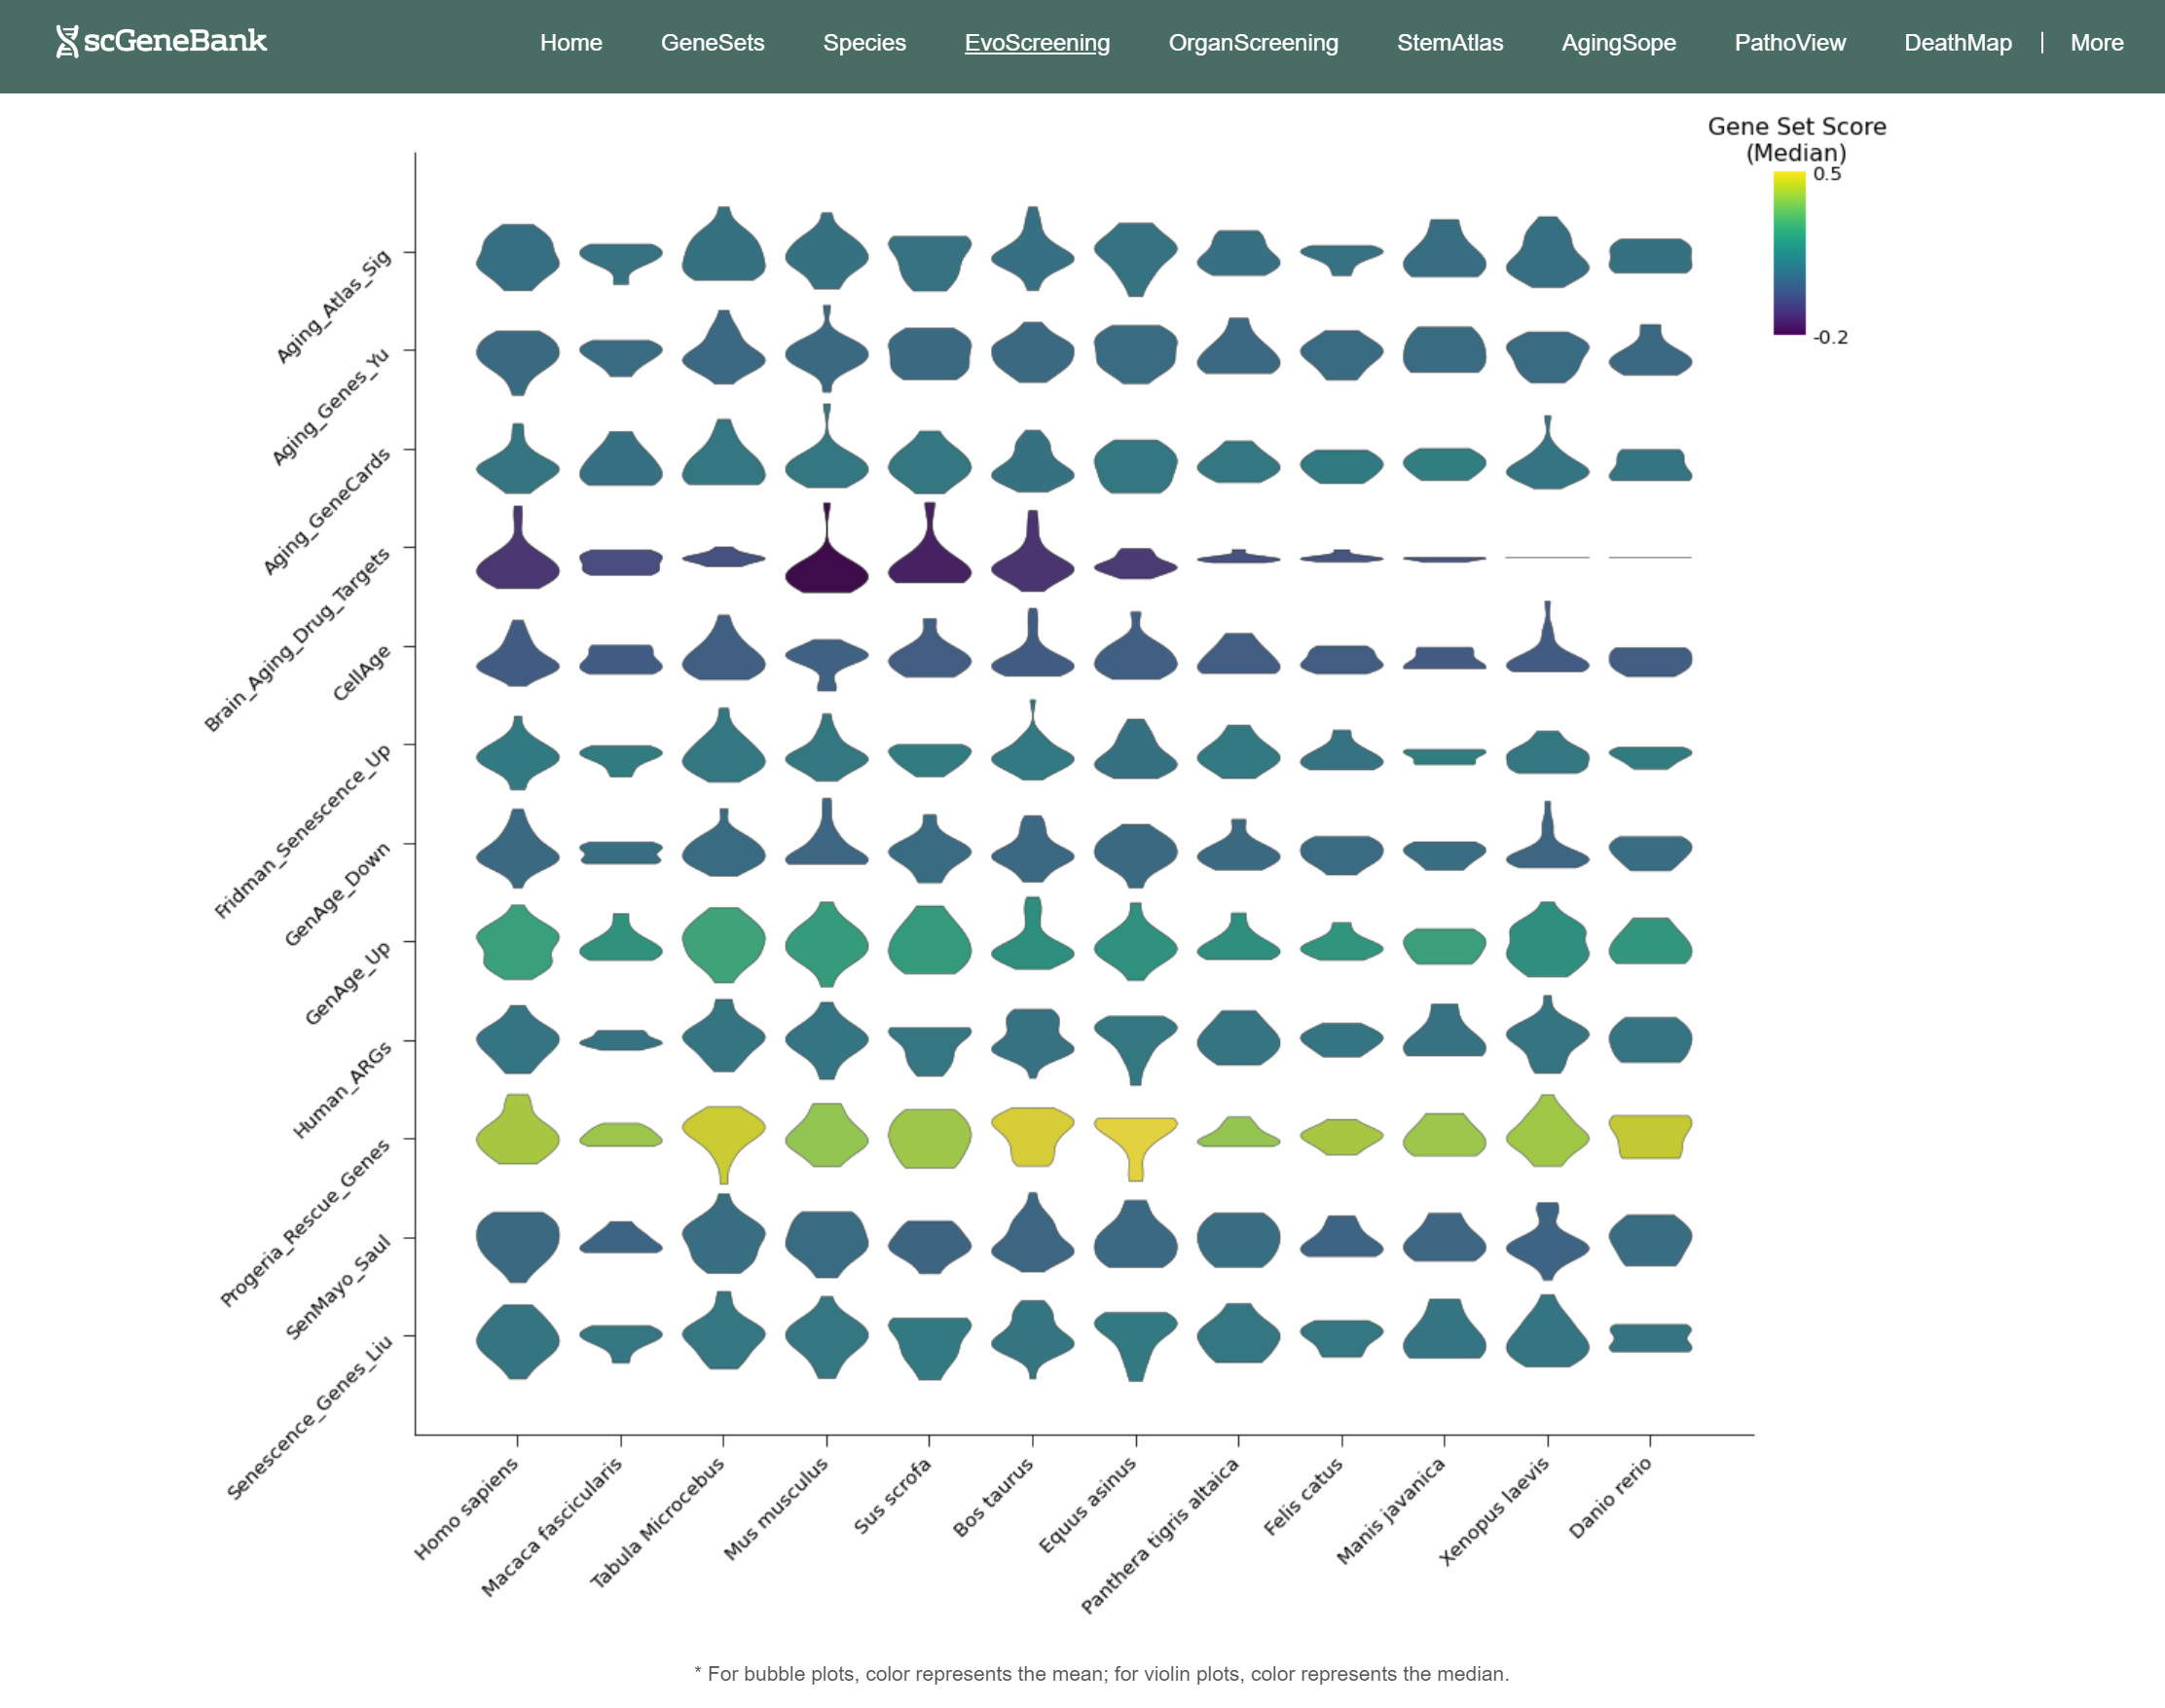
In addition, the webpage also displays a violin plot at the end for further analysis by users. The color of the violin plot represents the median gene set score.
-
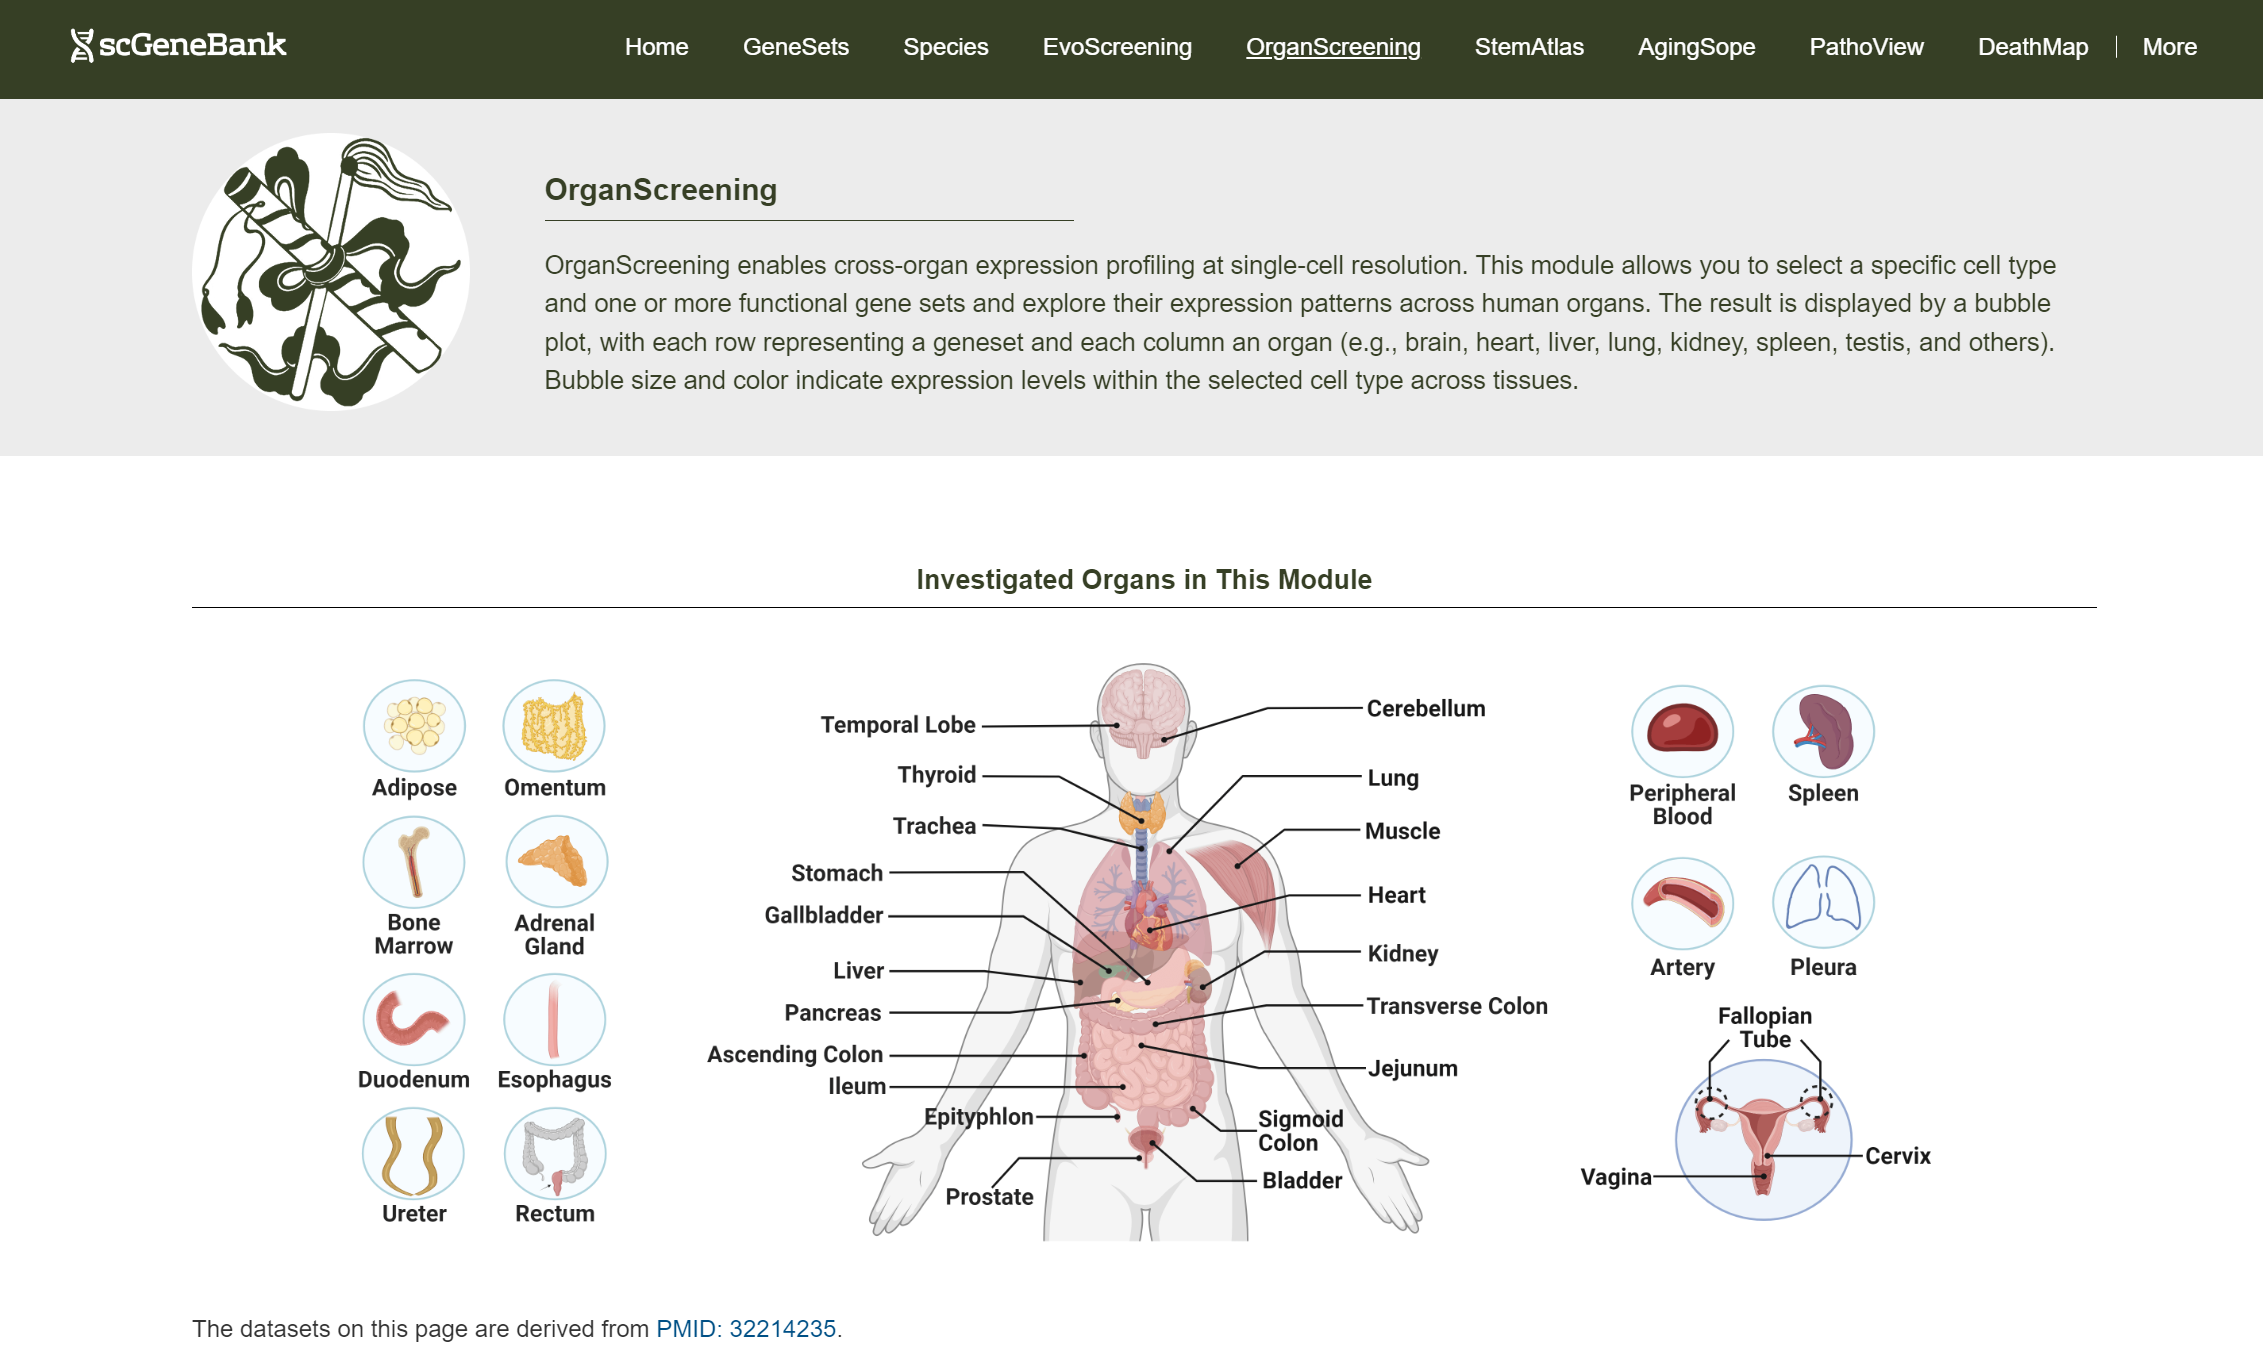
Tutorial of OrganScreening
OrganScreening allows users to explore gene set expression across 35 human organs at single-cell resolution.
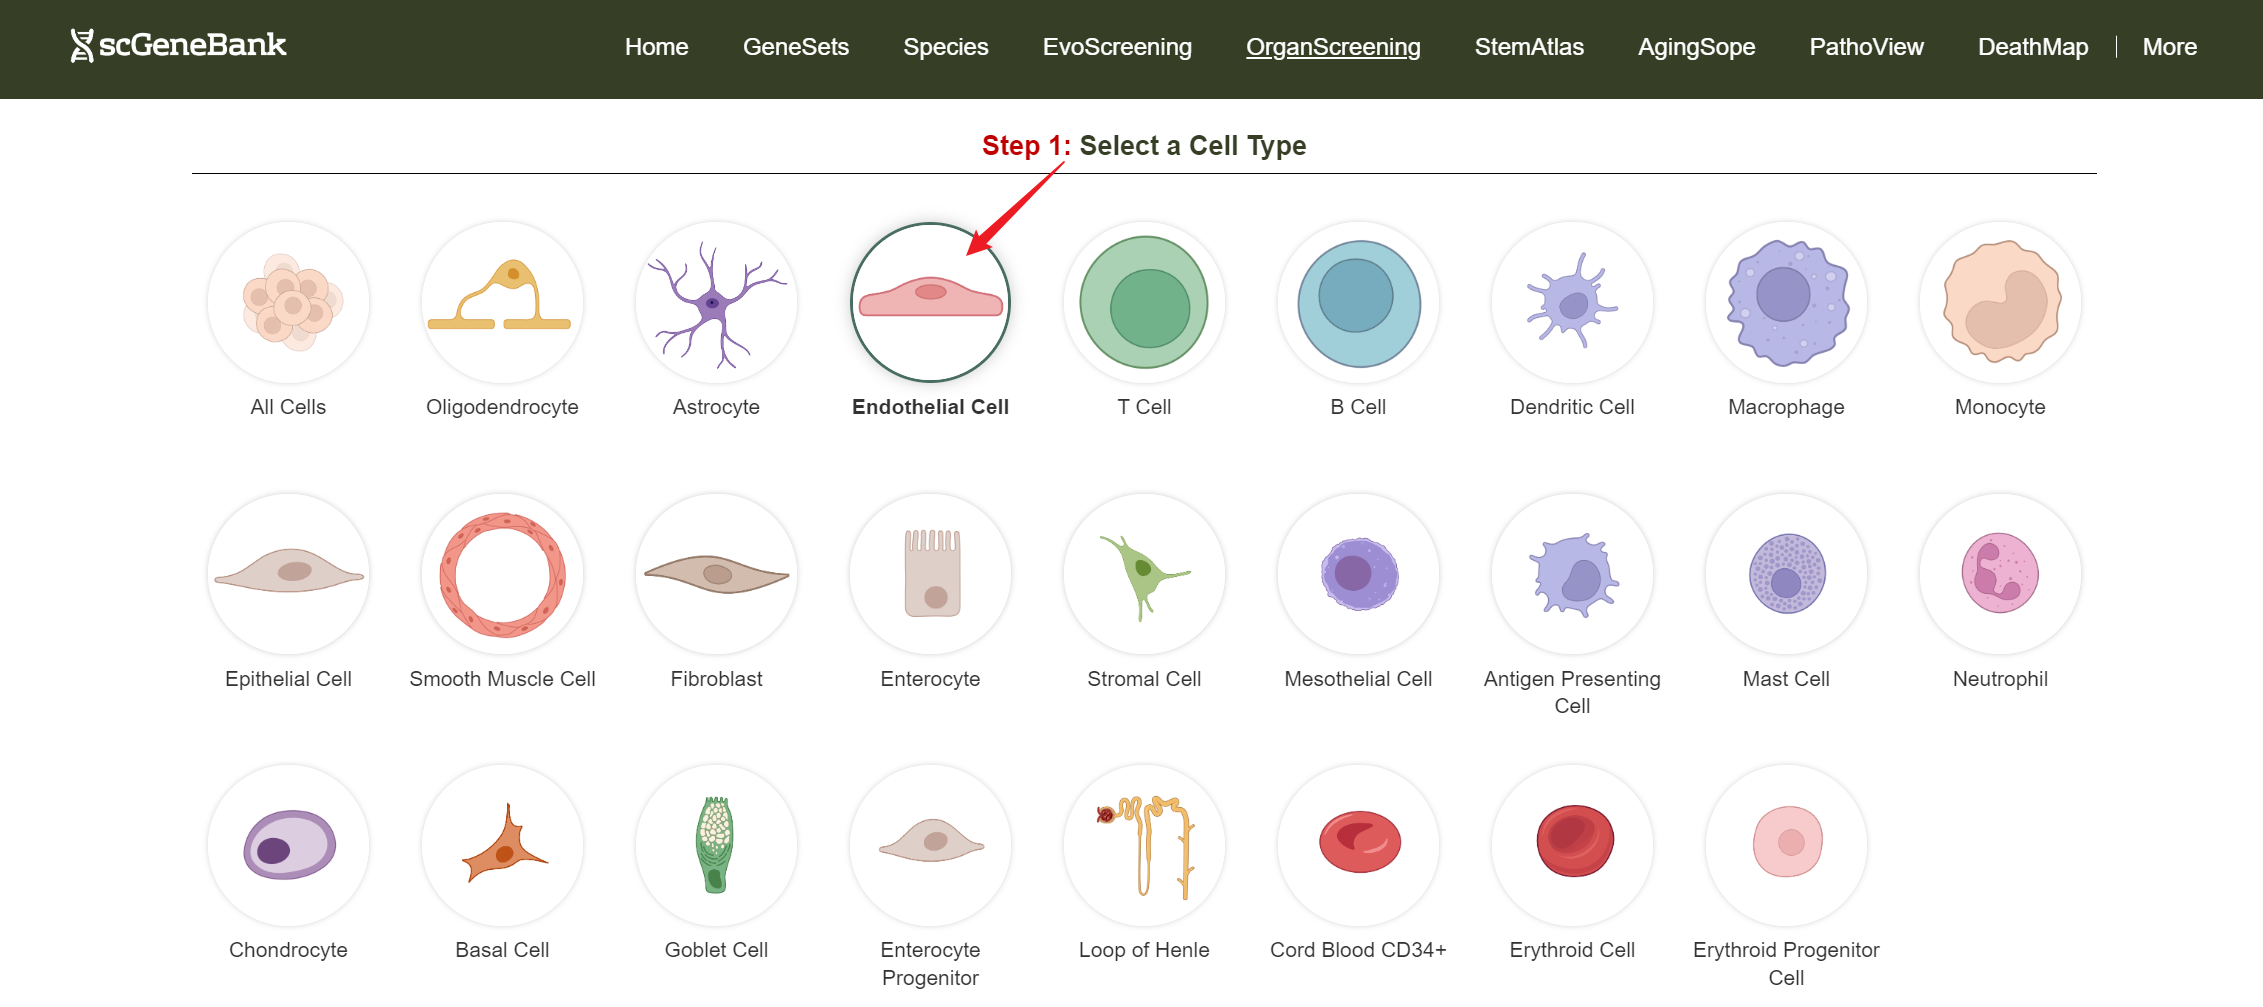
To get started, click on a cell type of interest (e.g., Endothelial cell).
Step 1
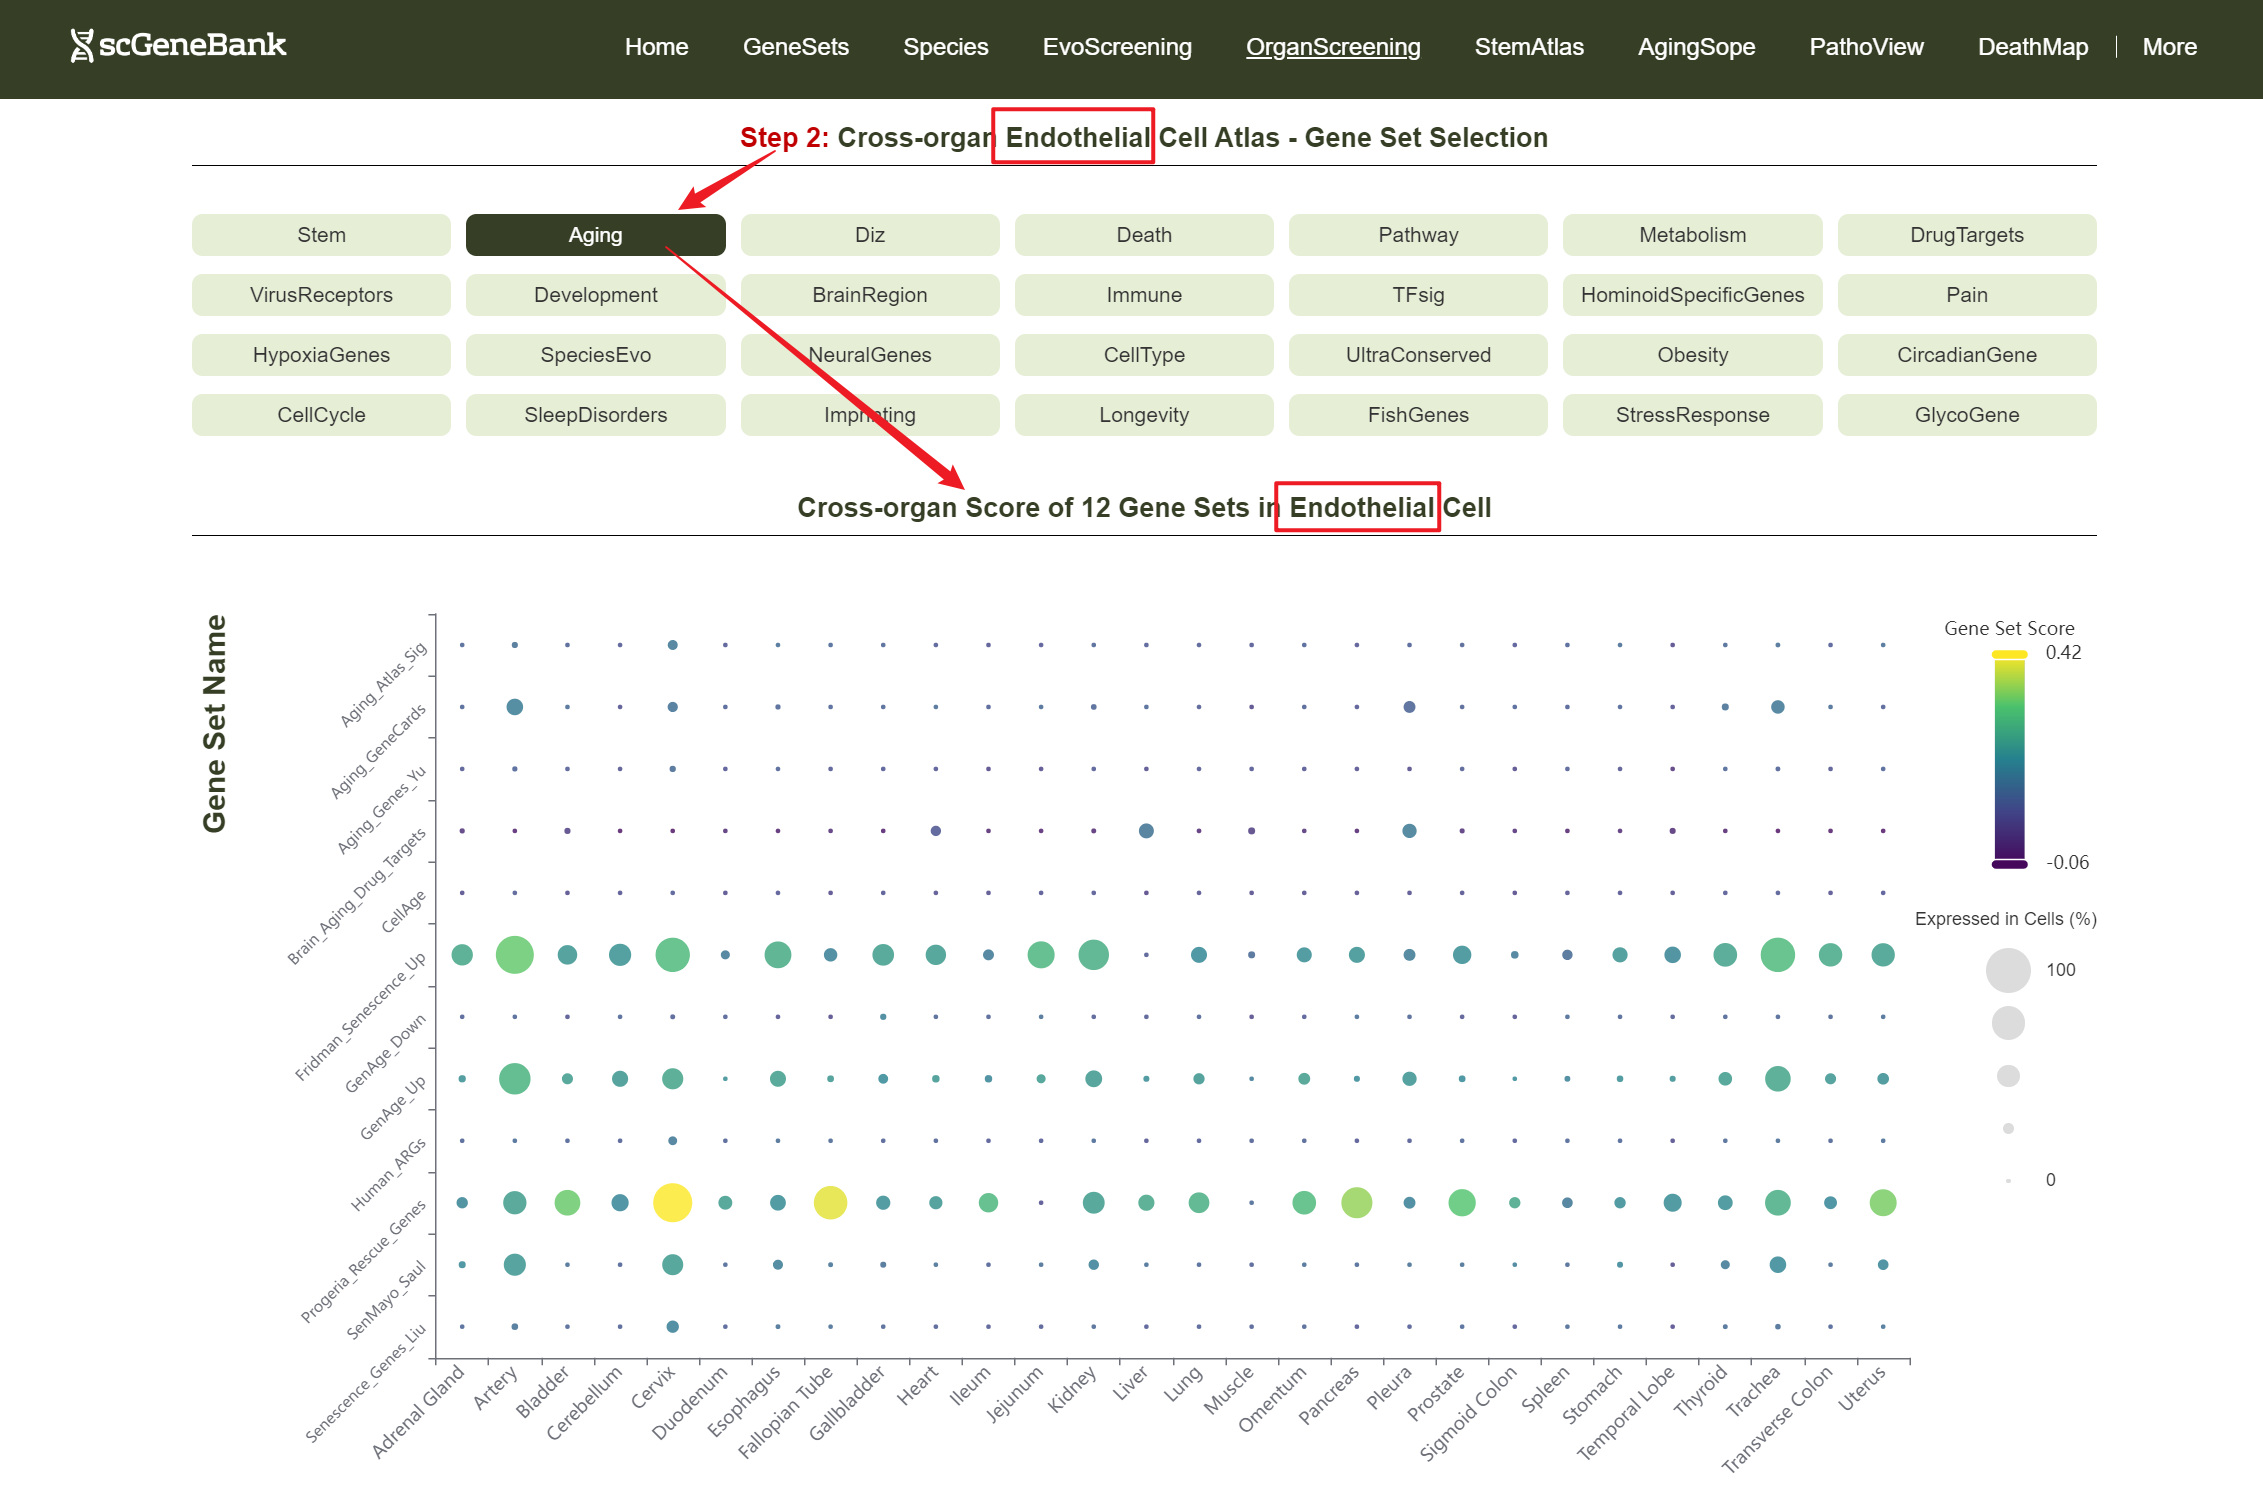
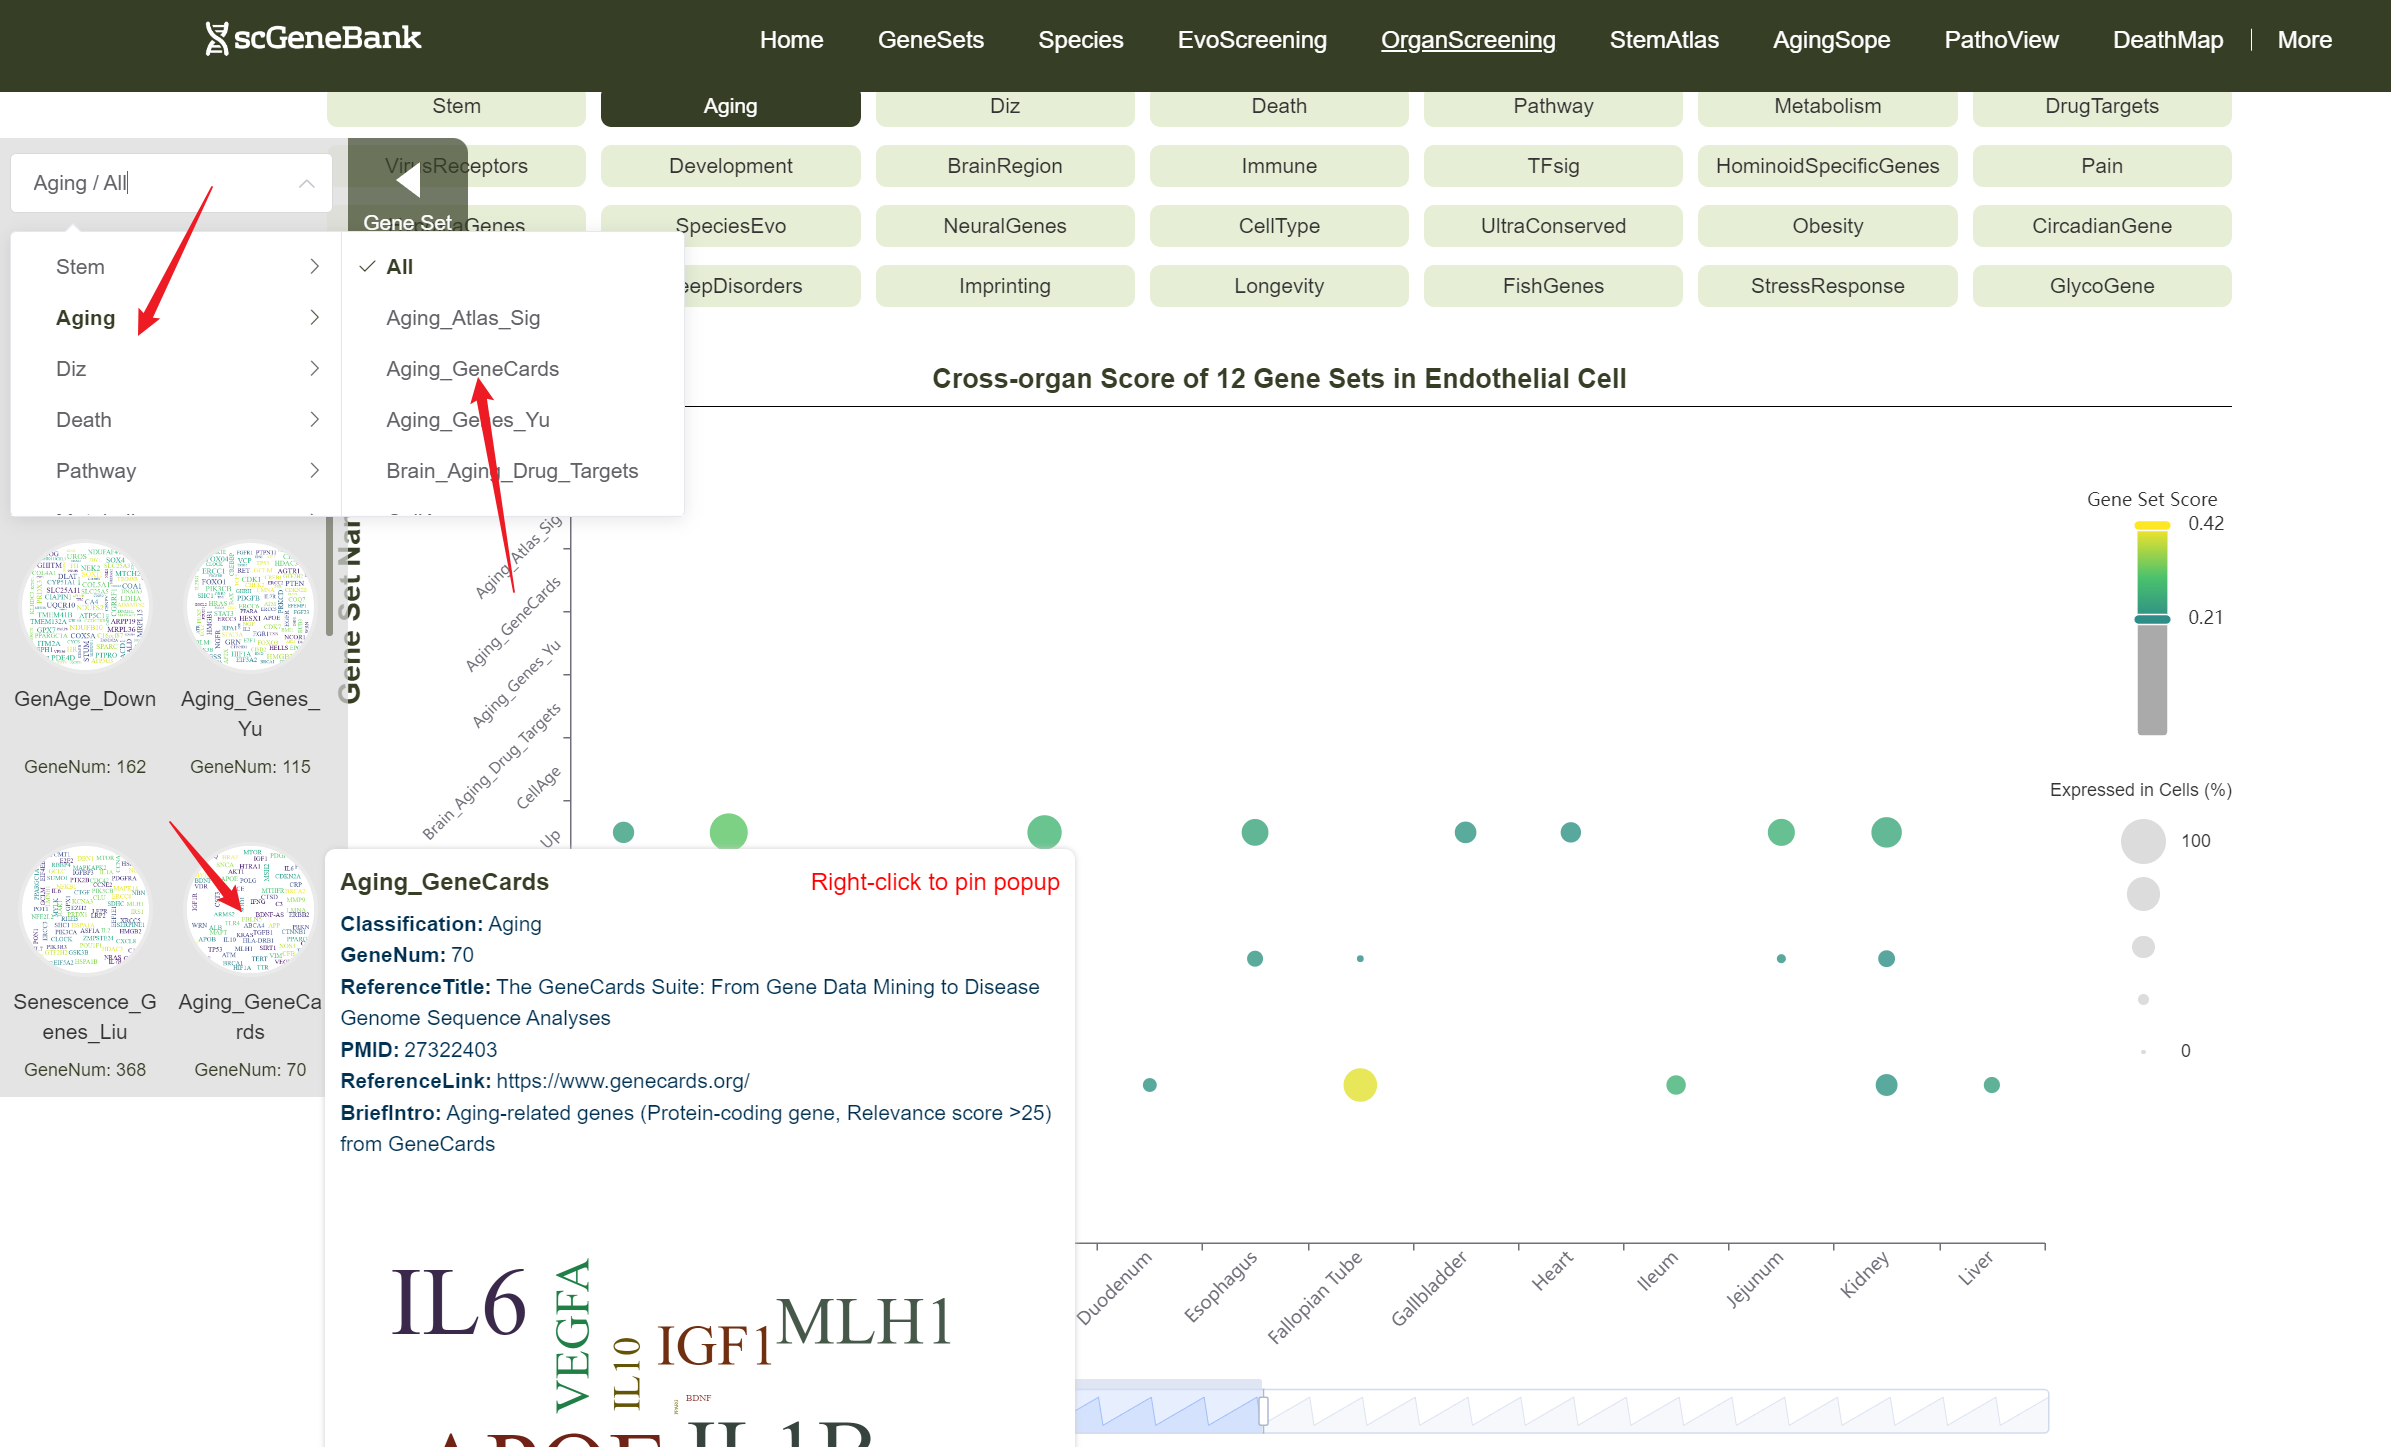
Then, choose a functional gene category (e.g., Aging) to generate a bubble plot showing gene set activity across organs for the selected cell type. The color intensity of each bubble reflects the mean gene set score, while the bubble size indicates the proportion of cells expressing the gene set within a organ cell type.
Step 2
Users can drag the "Gene Set Score" color bar to filter values by gene activity or adjust the horizontal axis width below to refine cells of interest. Hovering over bubbles reveals detailed information, while clicking "Gene Set Search" (top-left) allows querying specific gene sets for comprehensive data. Both the score table and bubble plot can be downloaded for further analysis or presentation.
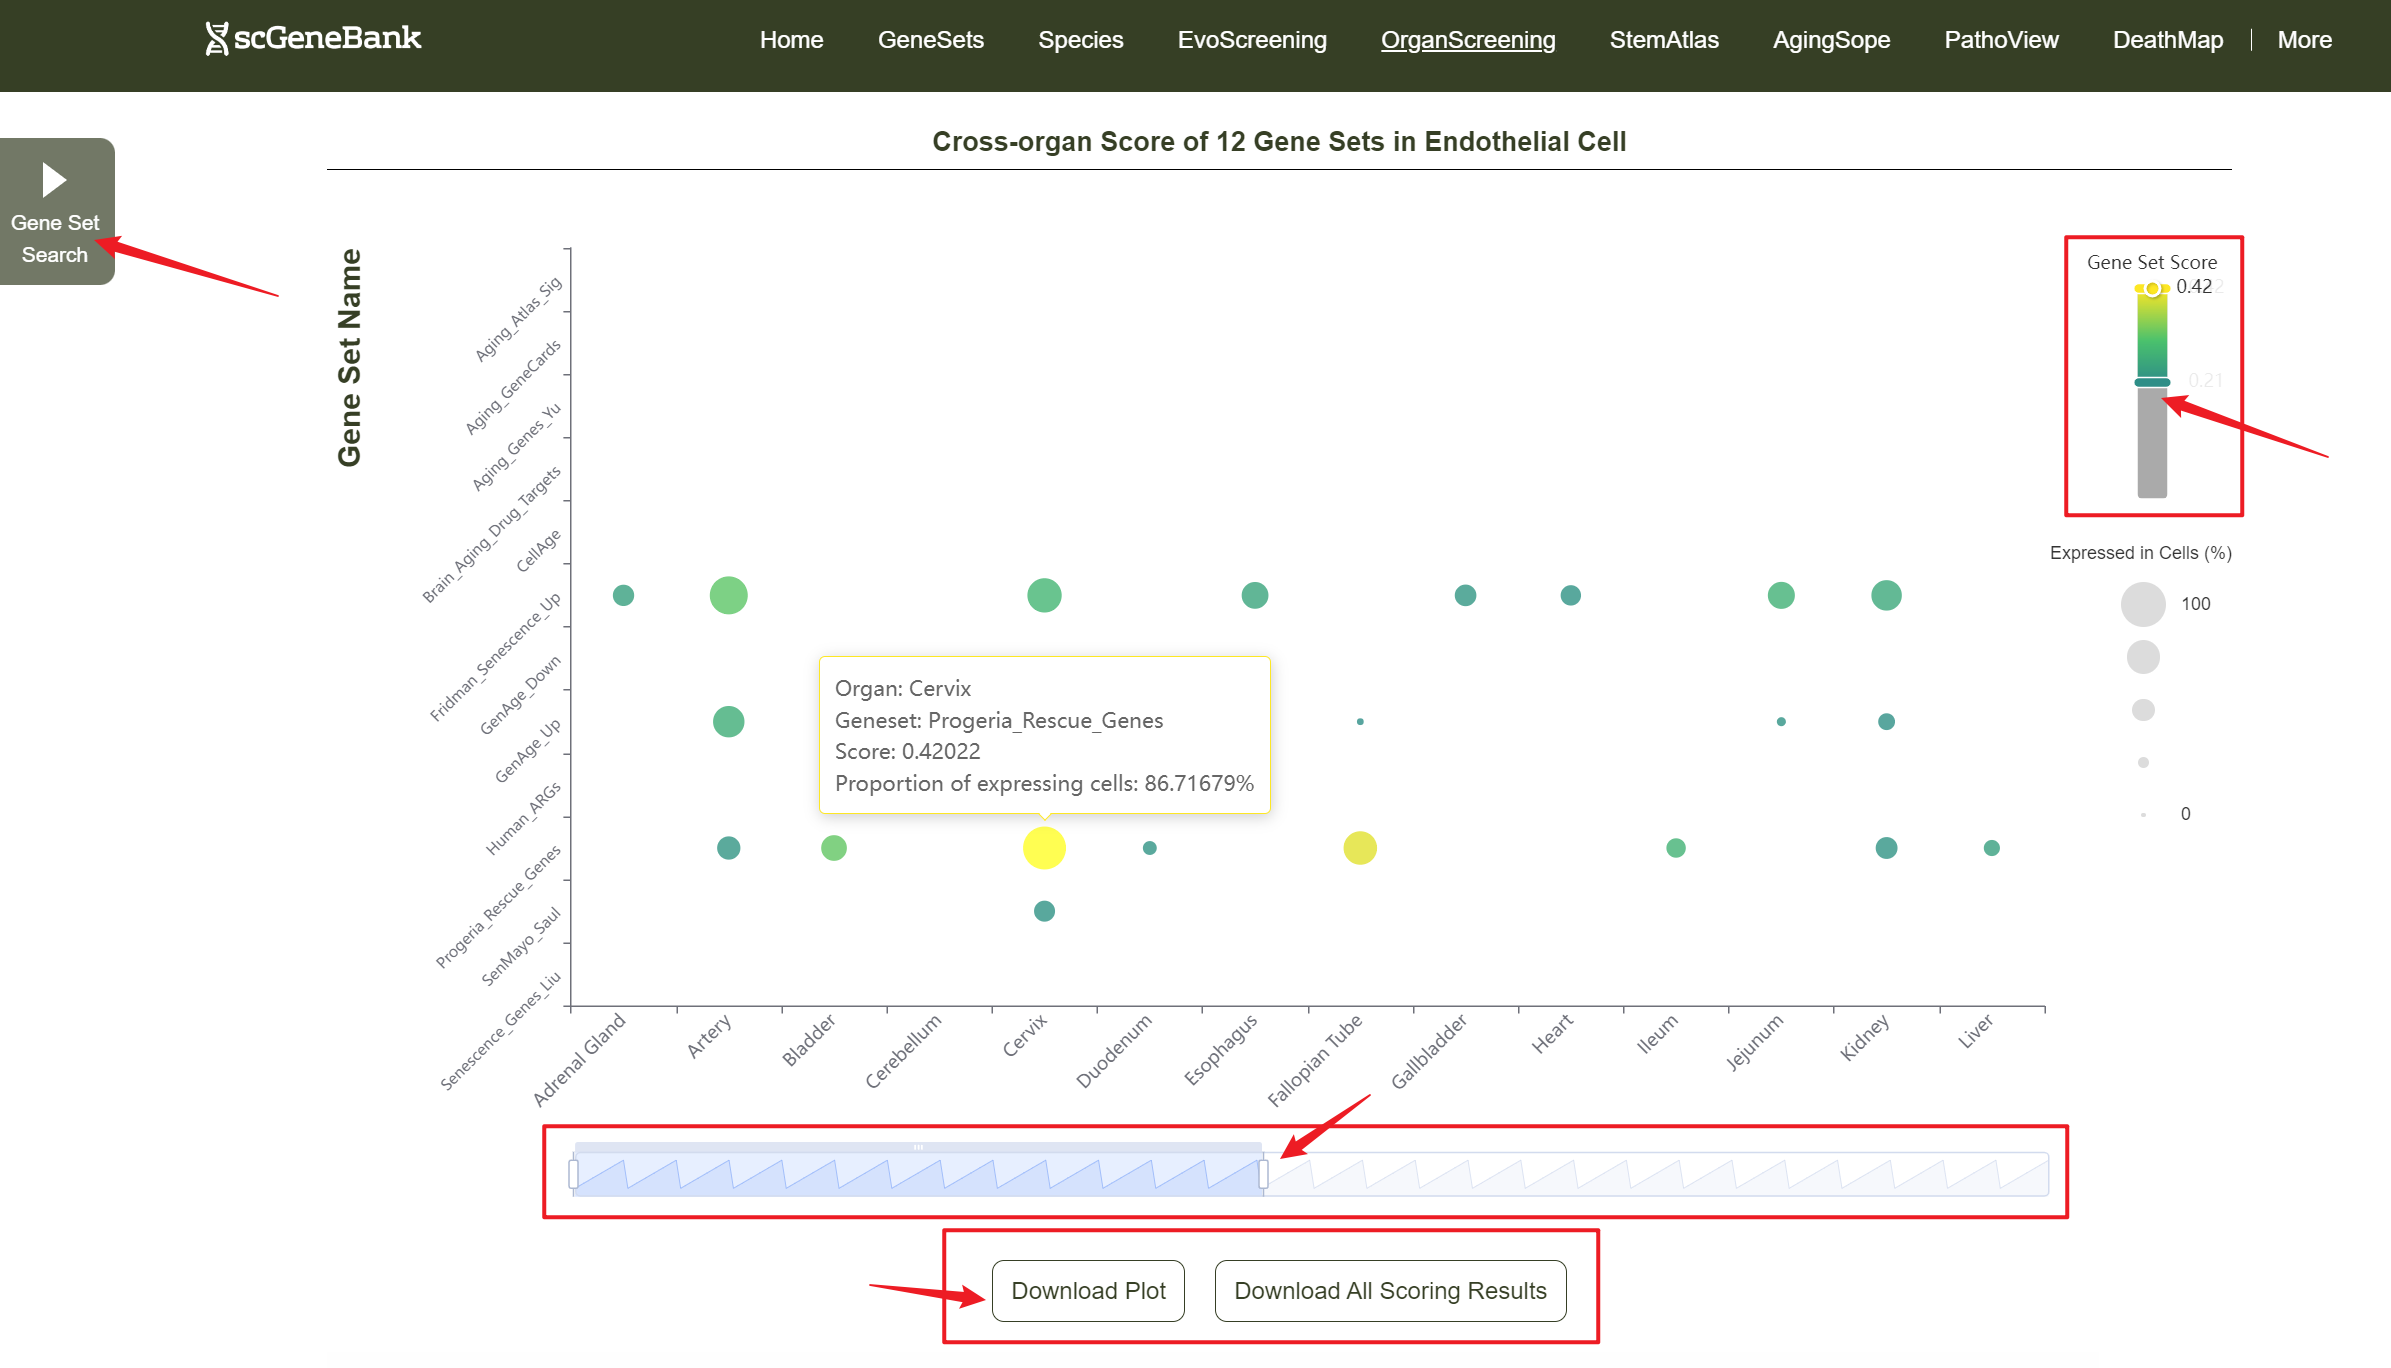
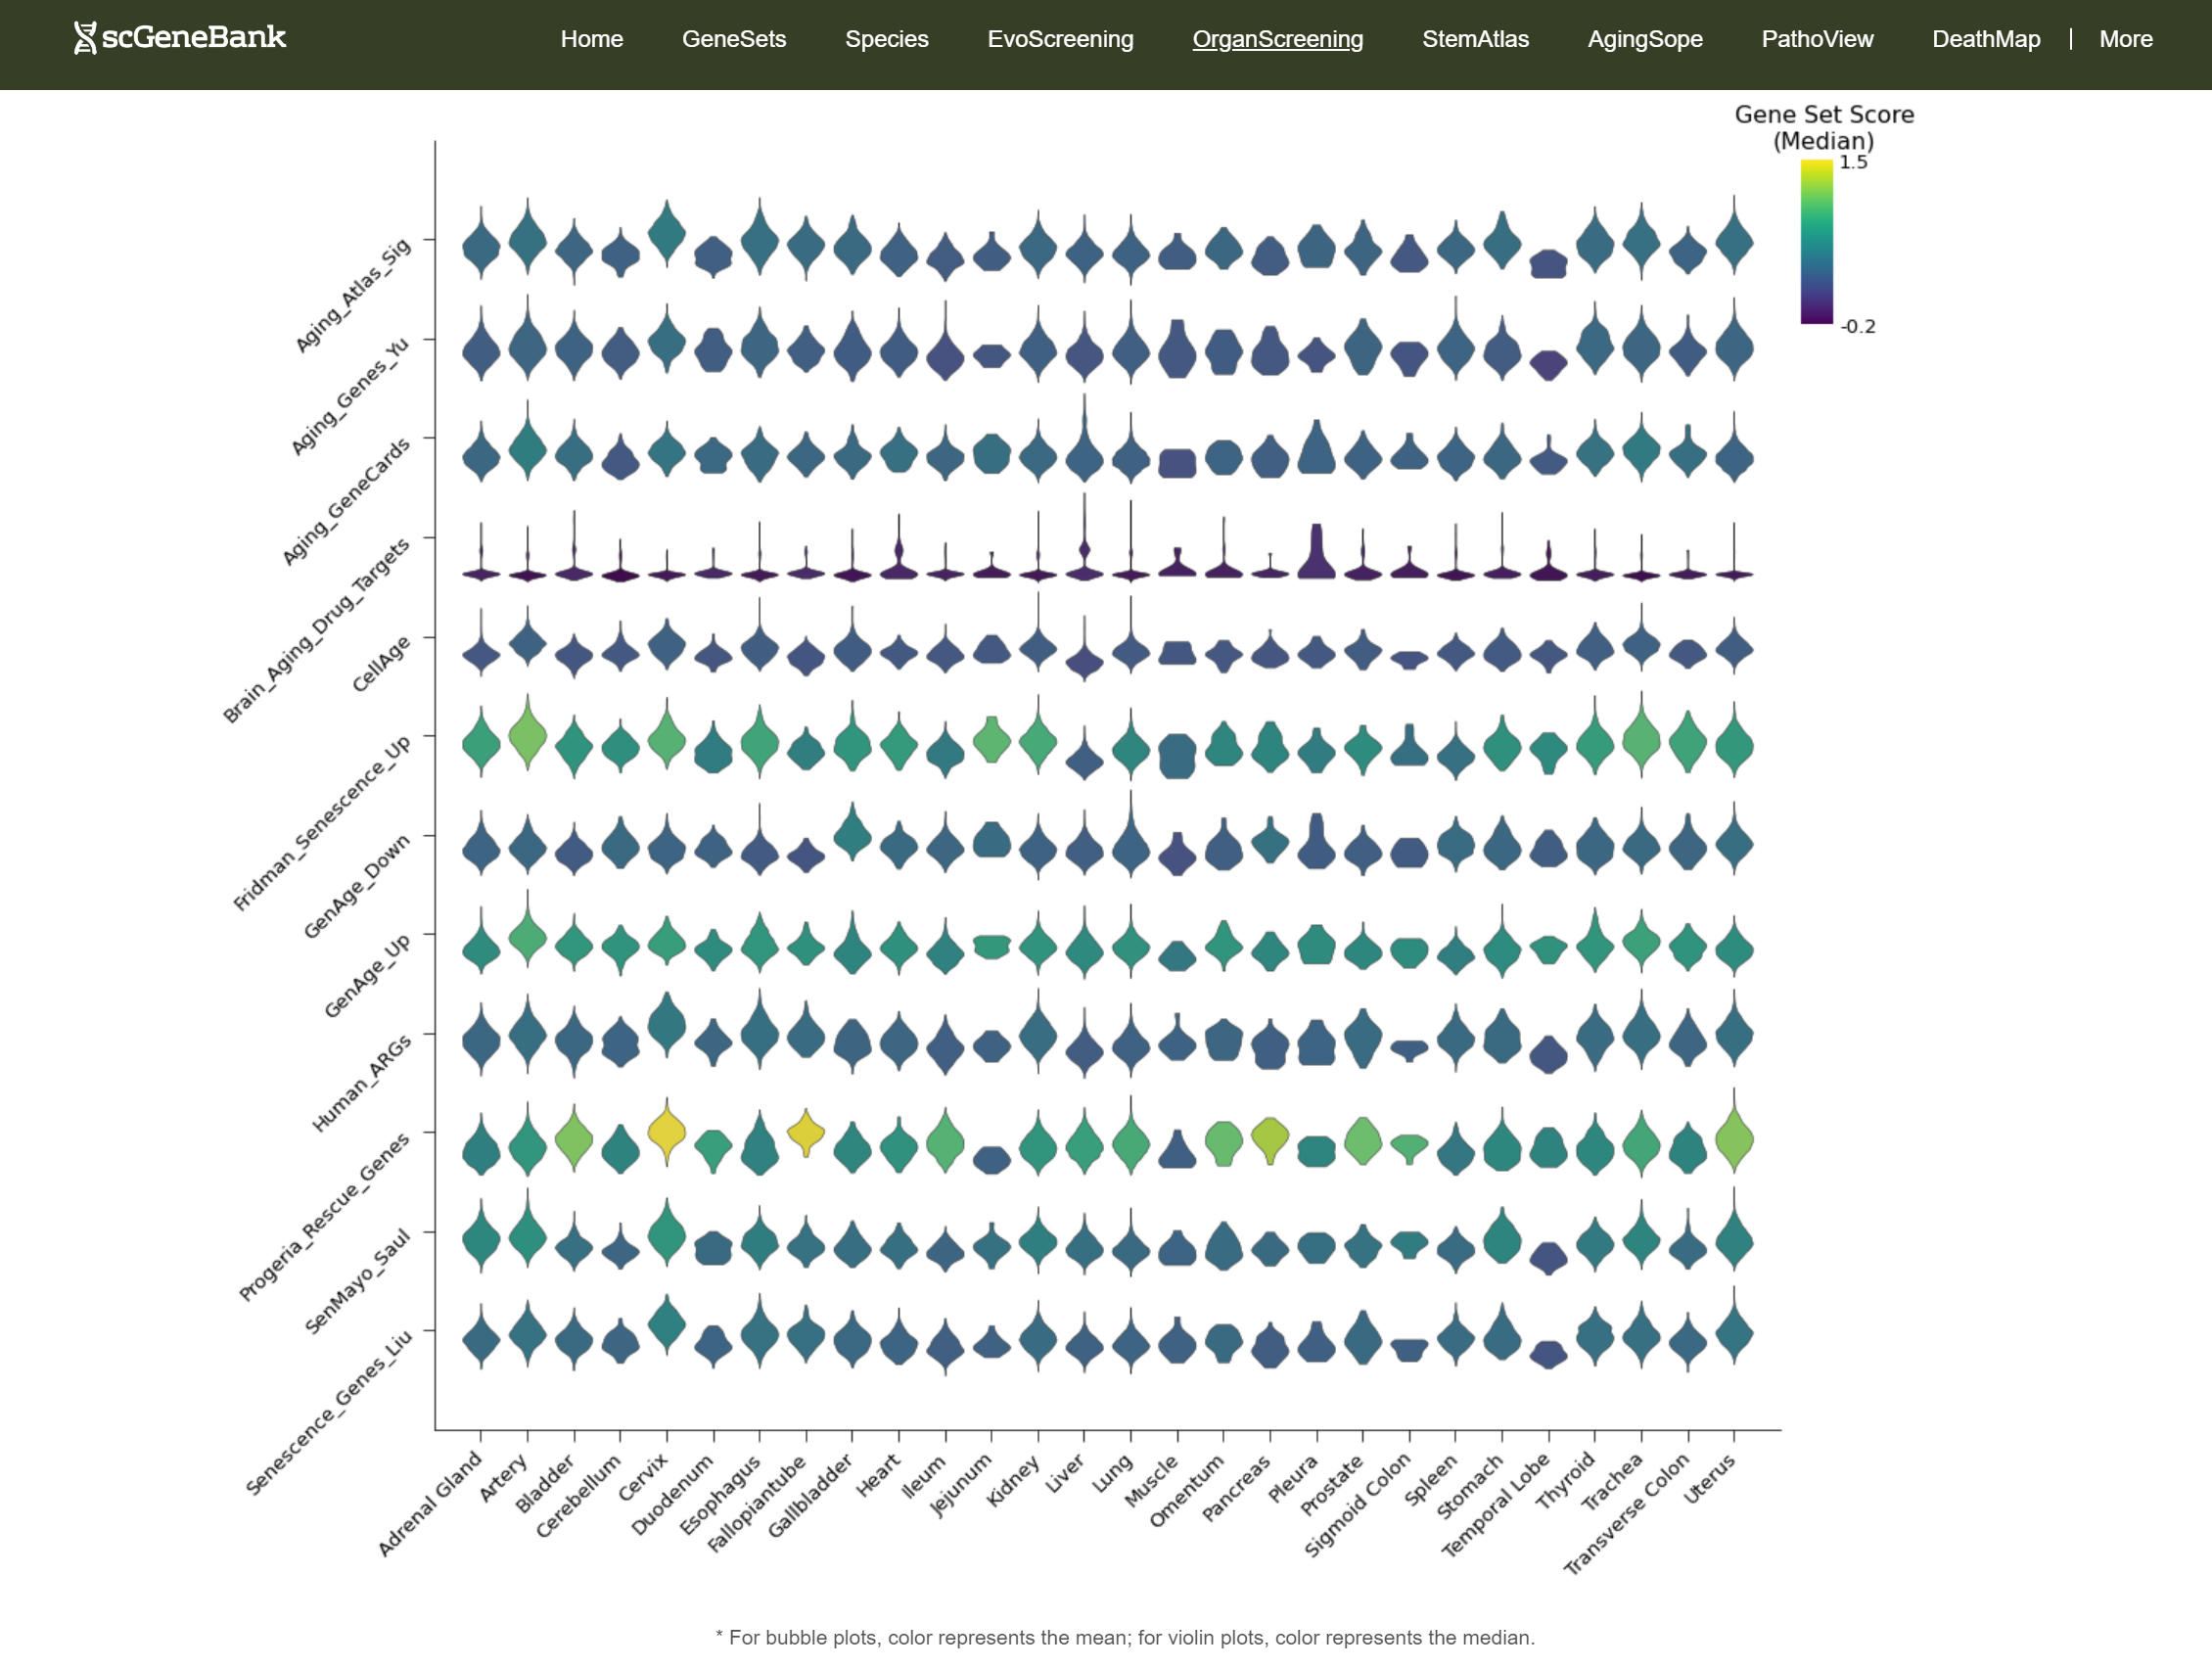
In addition, the webpage also displays a violin plot at the end for further analysis by users. The color of the violin plot represents the median gene set score.
-
Tutorial of StemAtlas
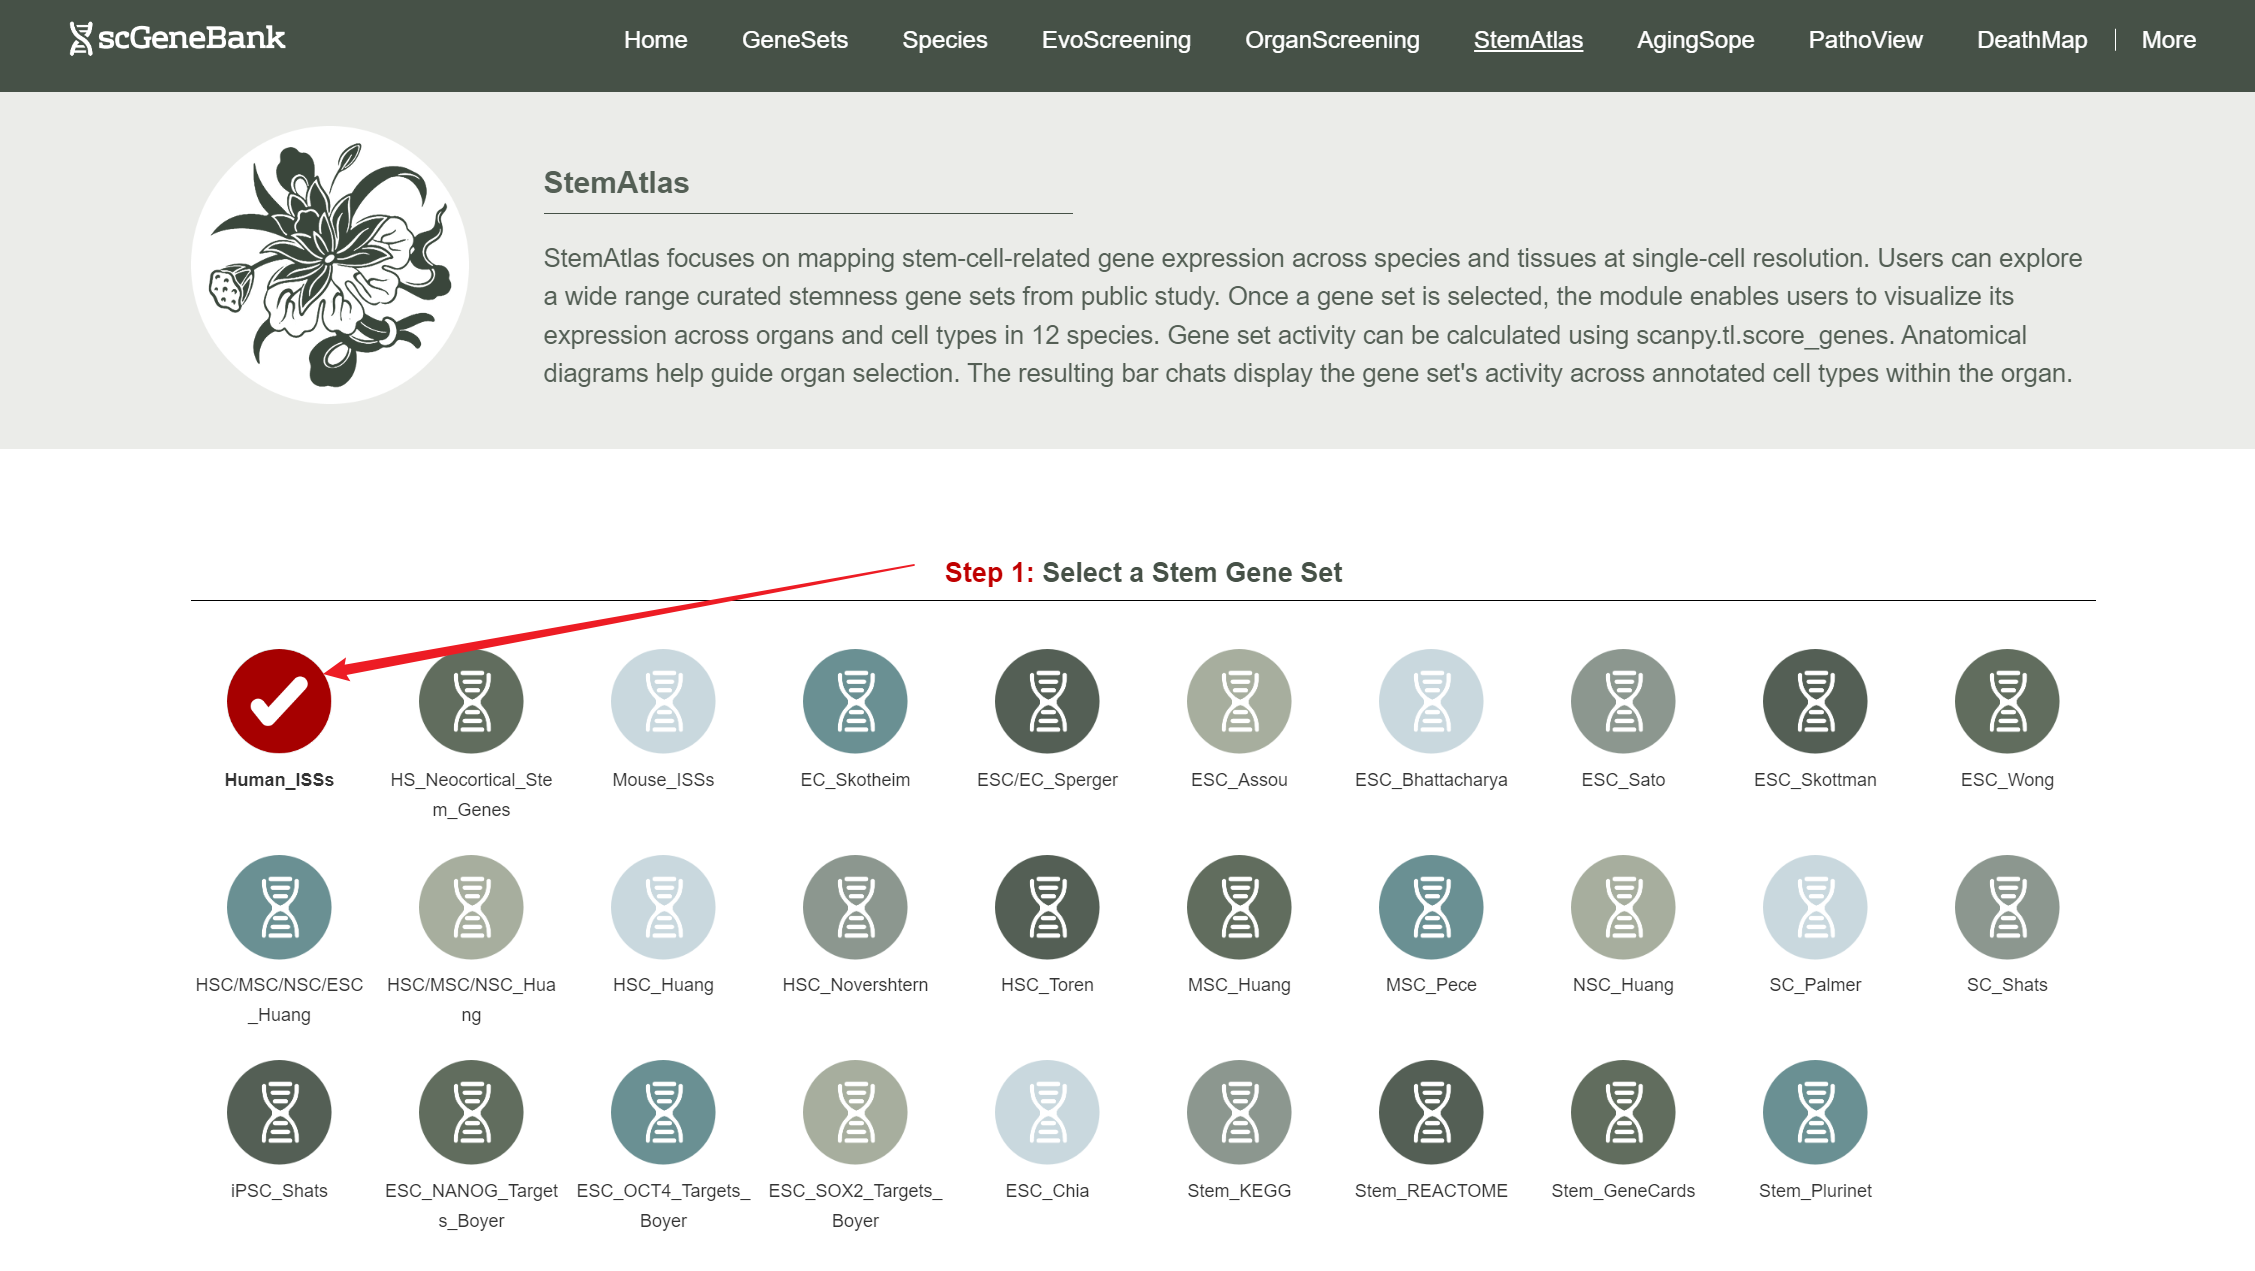
StemAtlas supports gene set scoring for stemness-related signature across whole-body atlas of 12 species at single-cell resolution.
To begin using StemAtlas, first select a stemness-related gene set by clicking on its icon-options.
Step 1
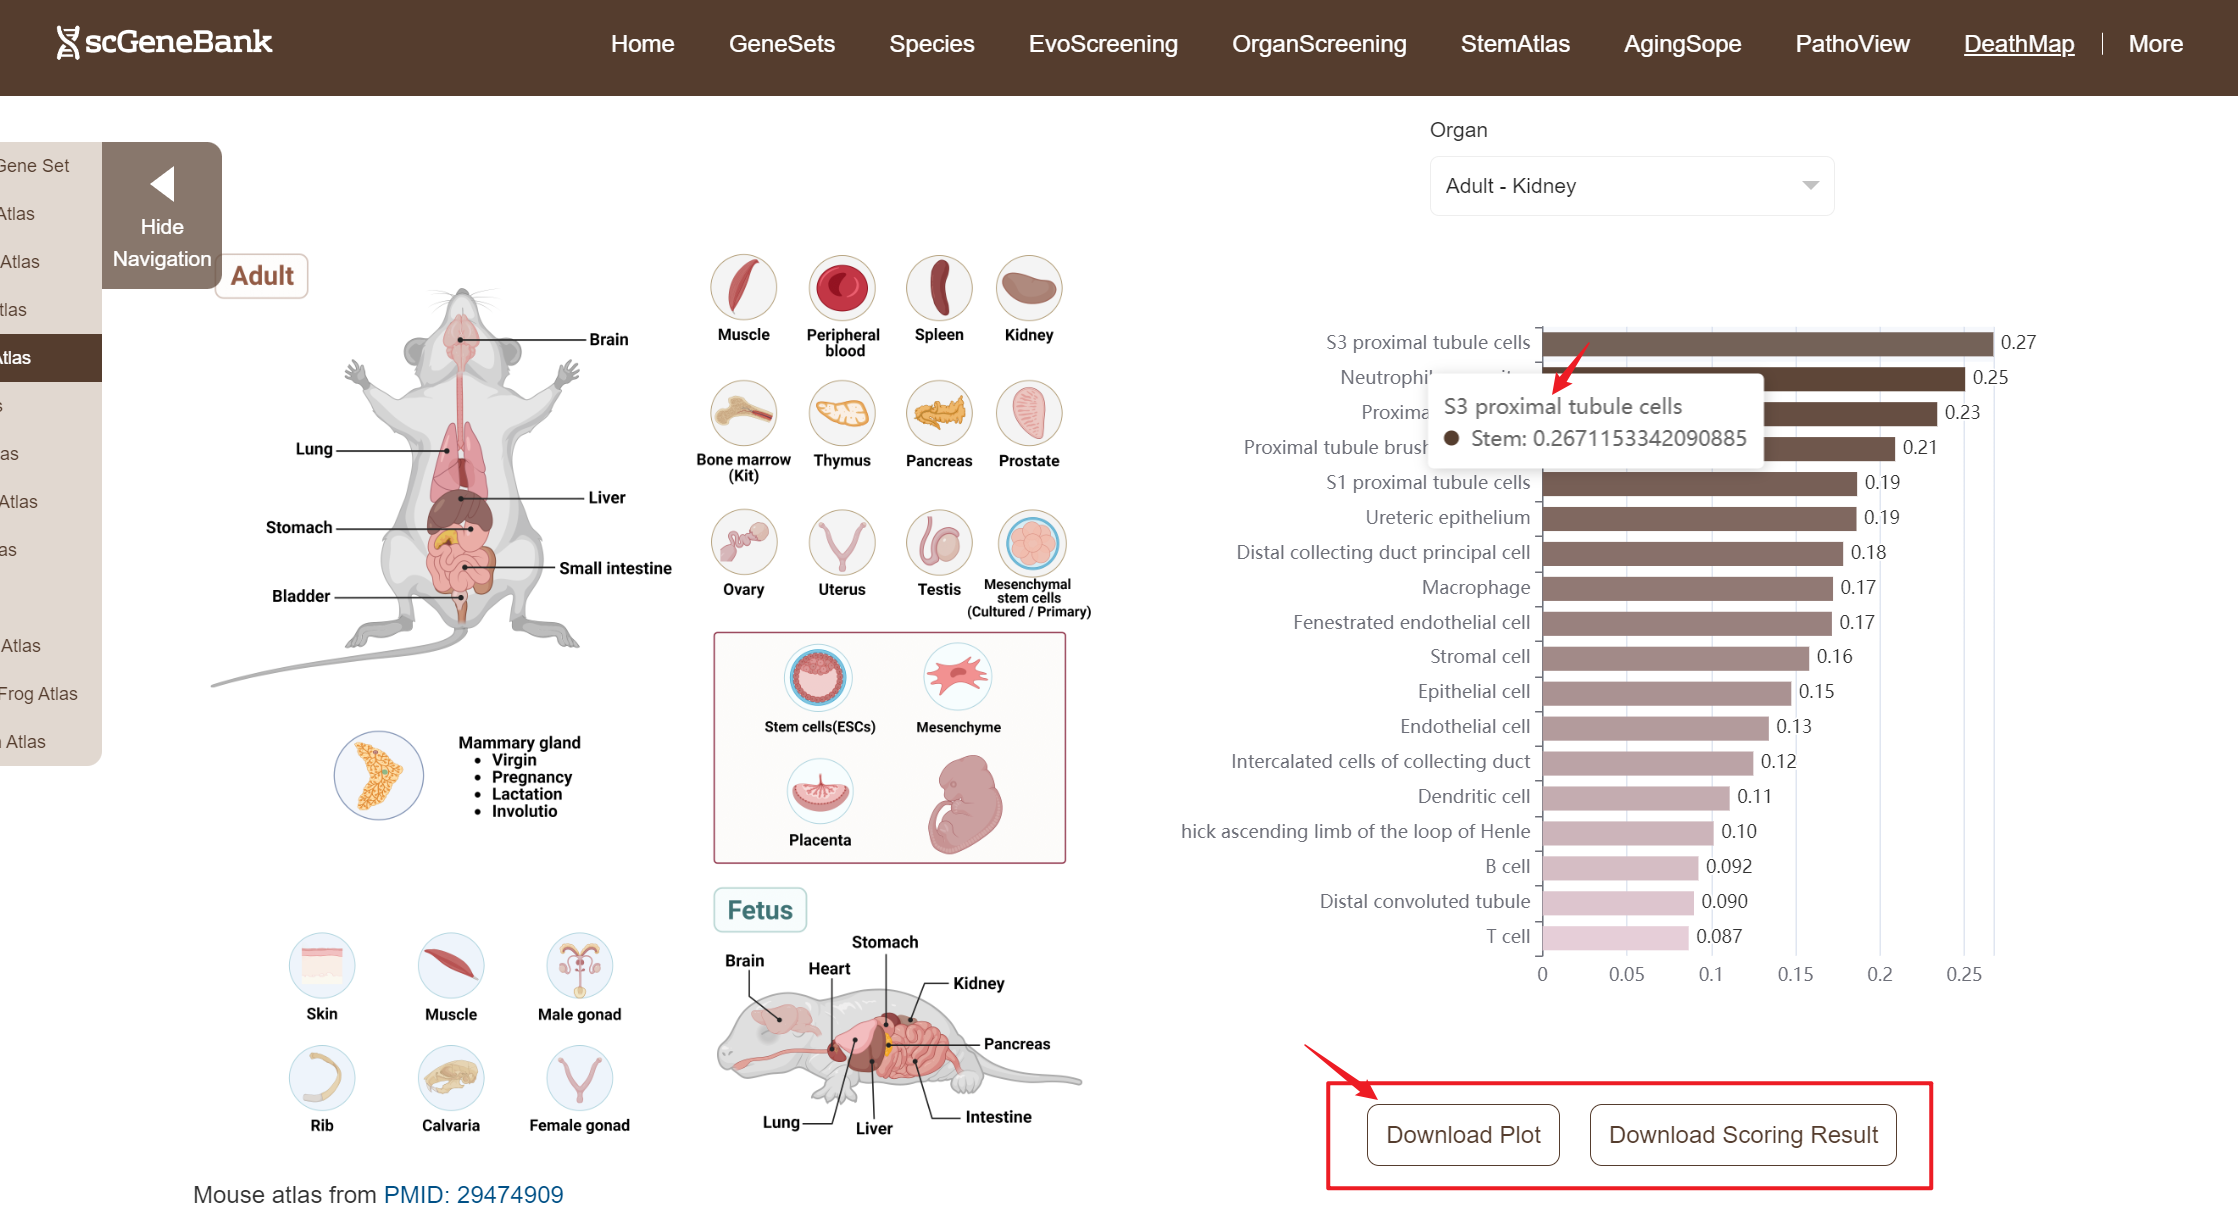
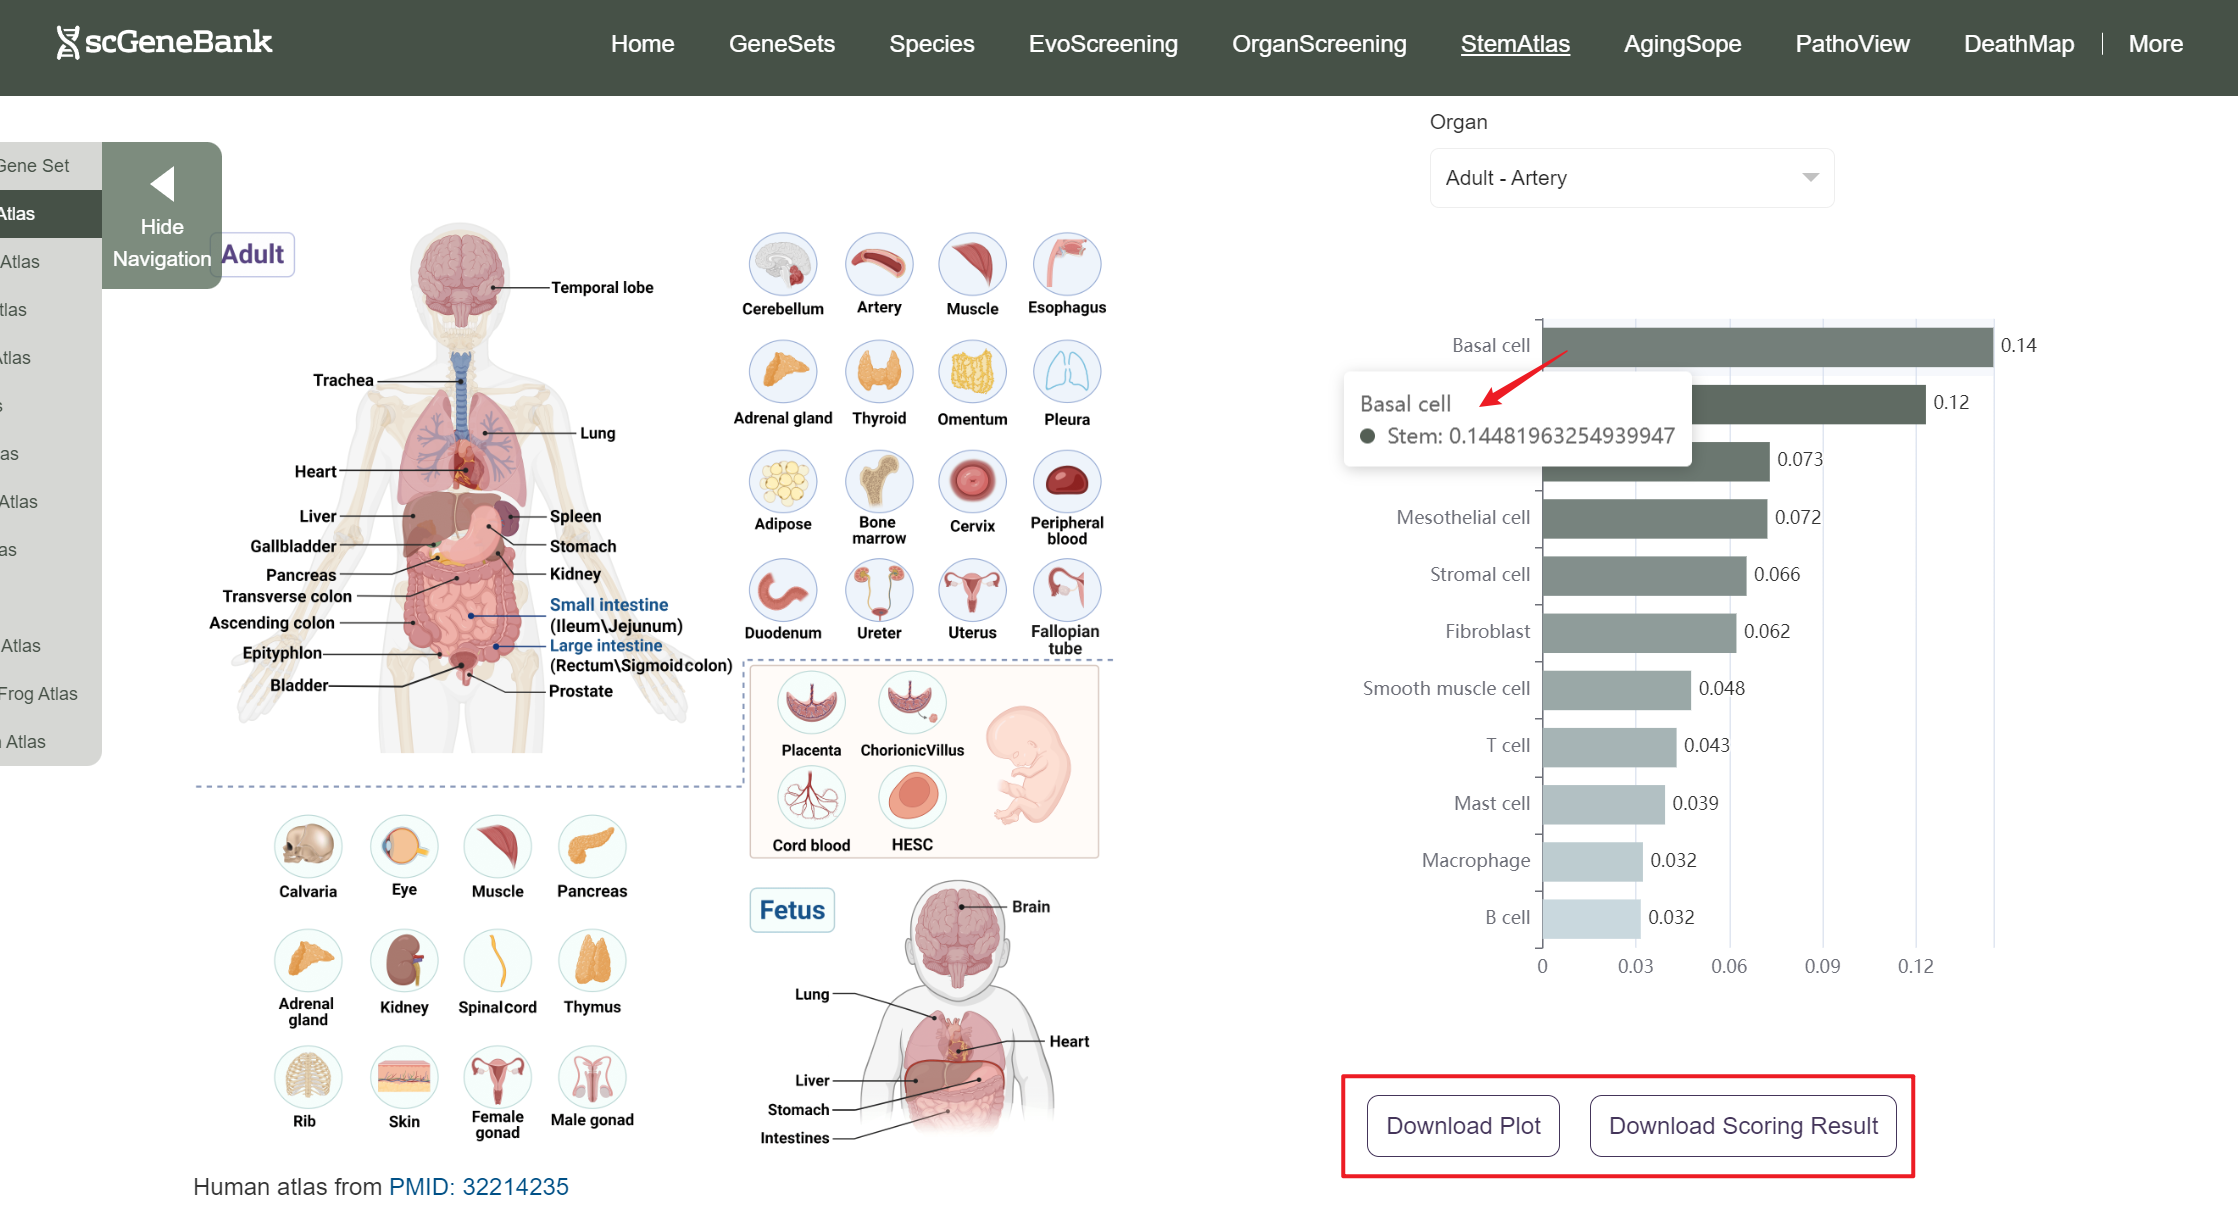
Next, scroll or click on the navigation bar at the bottom left to a specific display panel (12 species), then either click the corresponding region in the interactive anatomical diagram, use the filter bar to make a selection, or manually enter the target organ. Once the organ is selected, users can calculate gene set activity using the scanpy.tl.score_genes method.
Step 2
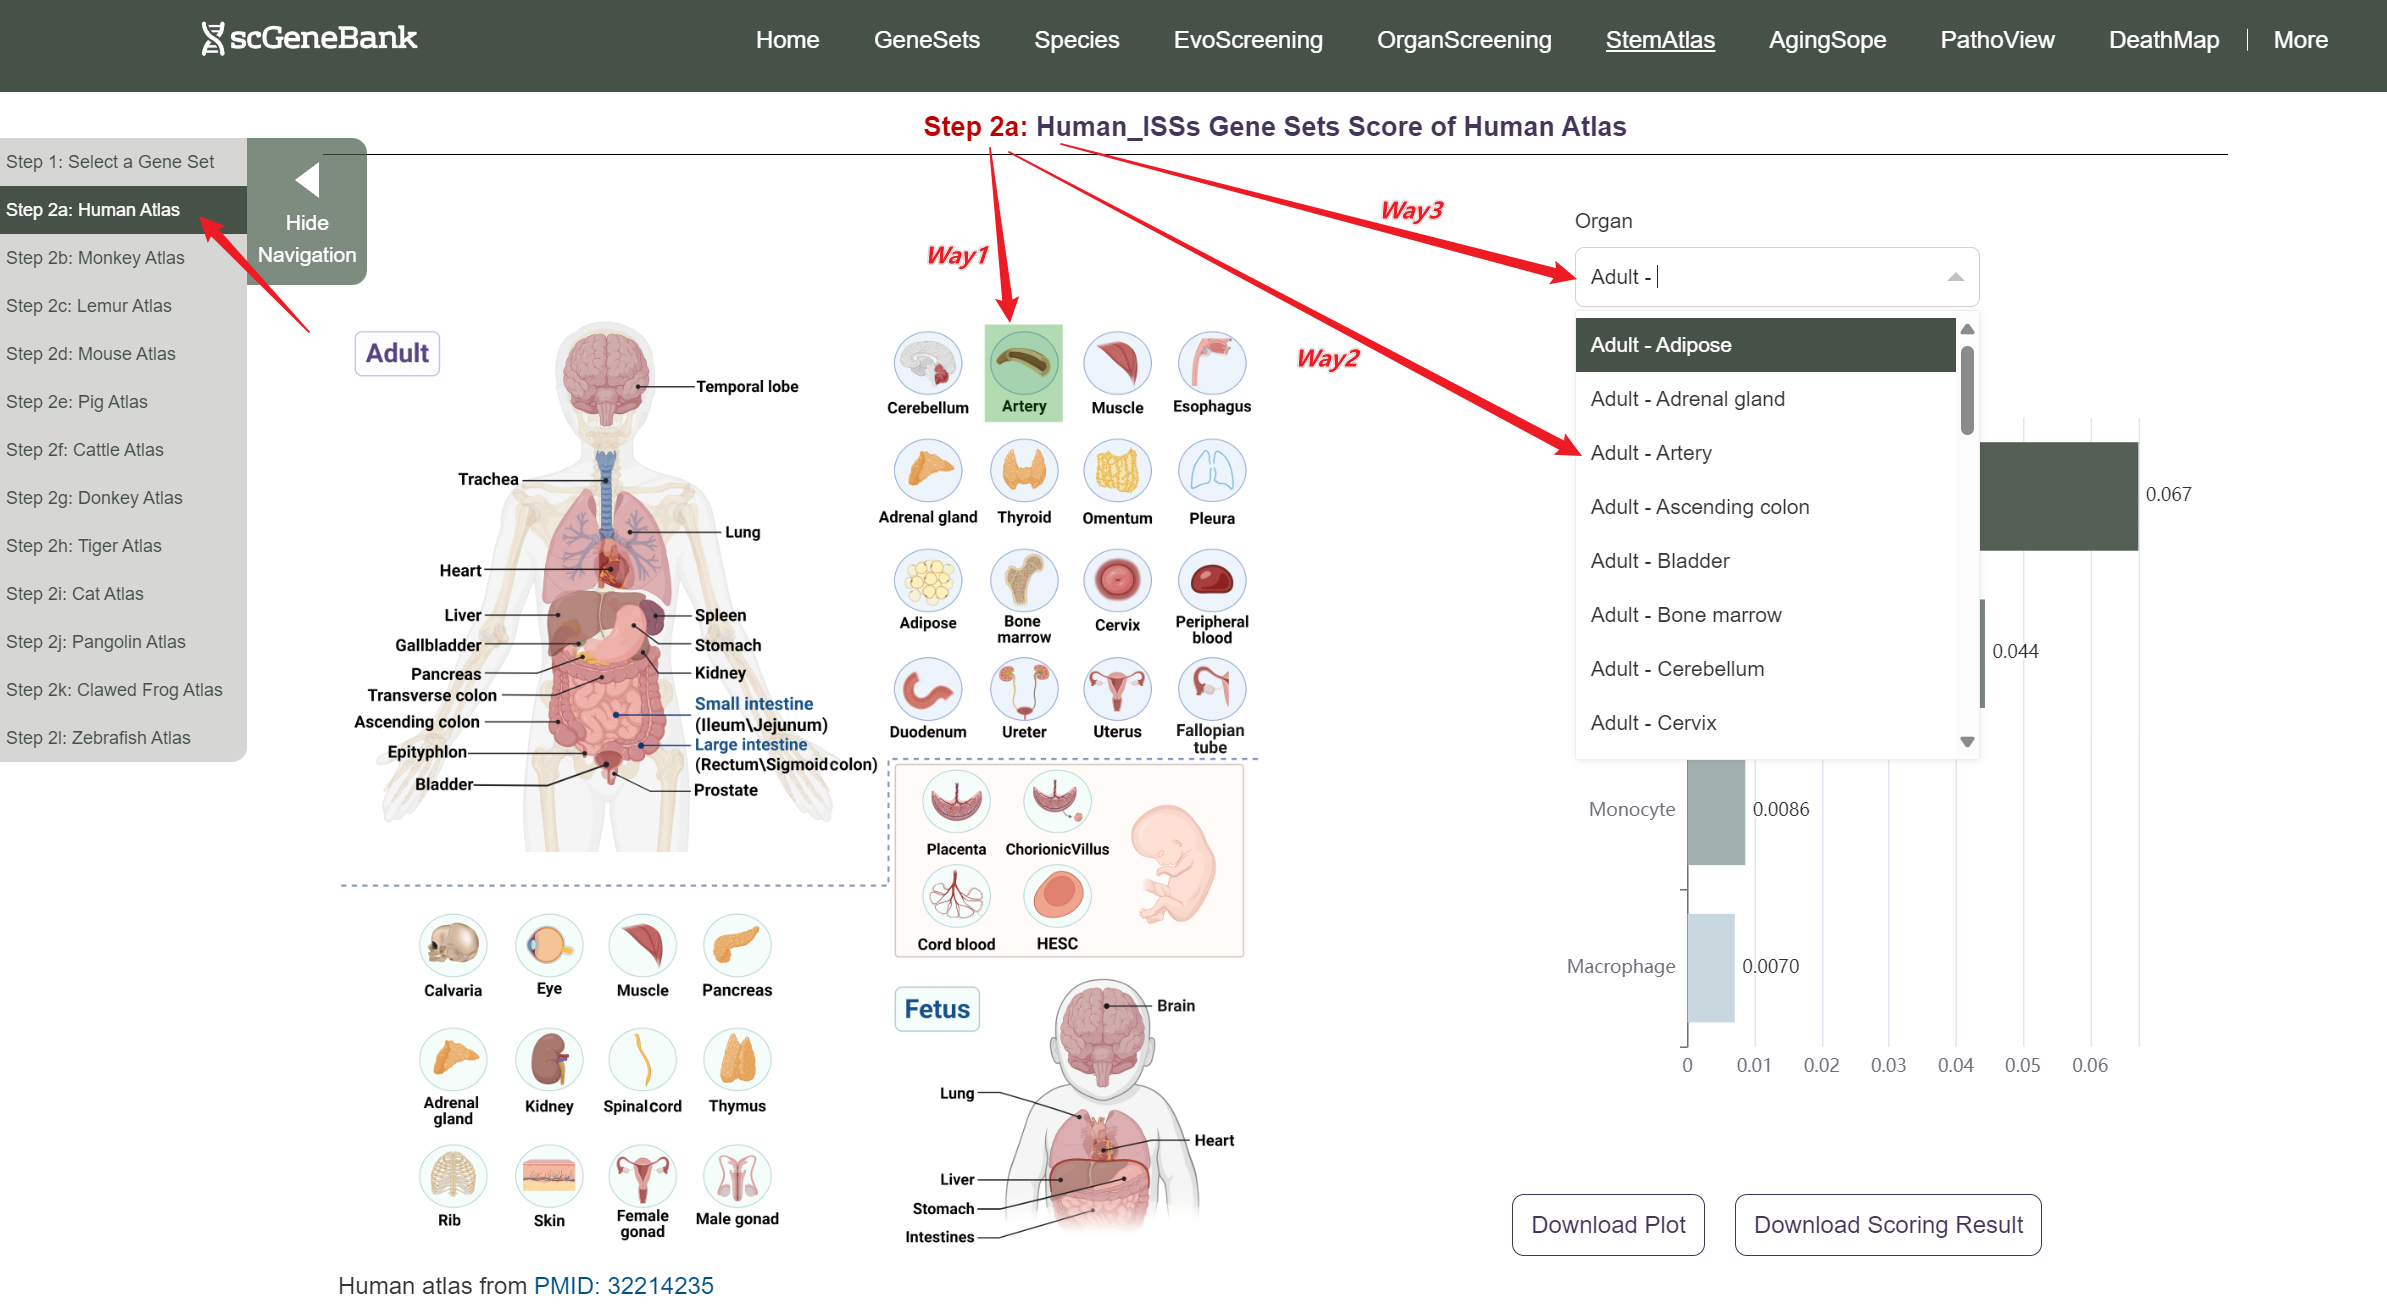
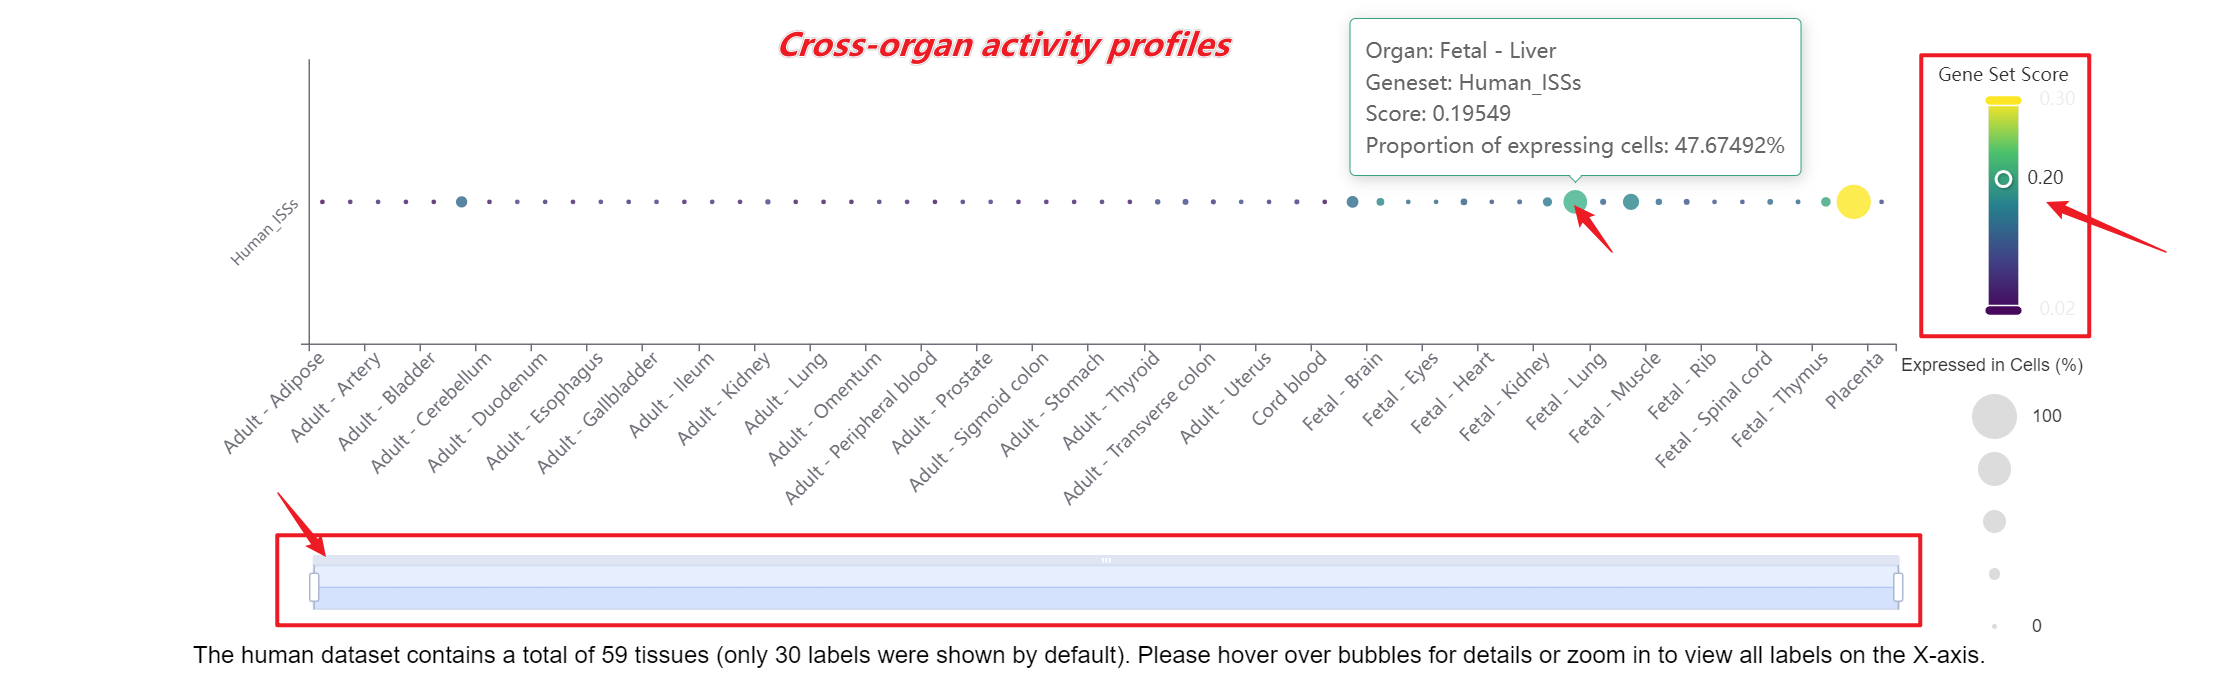
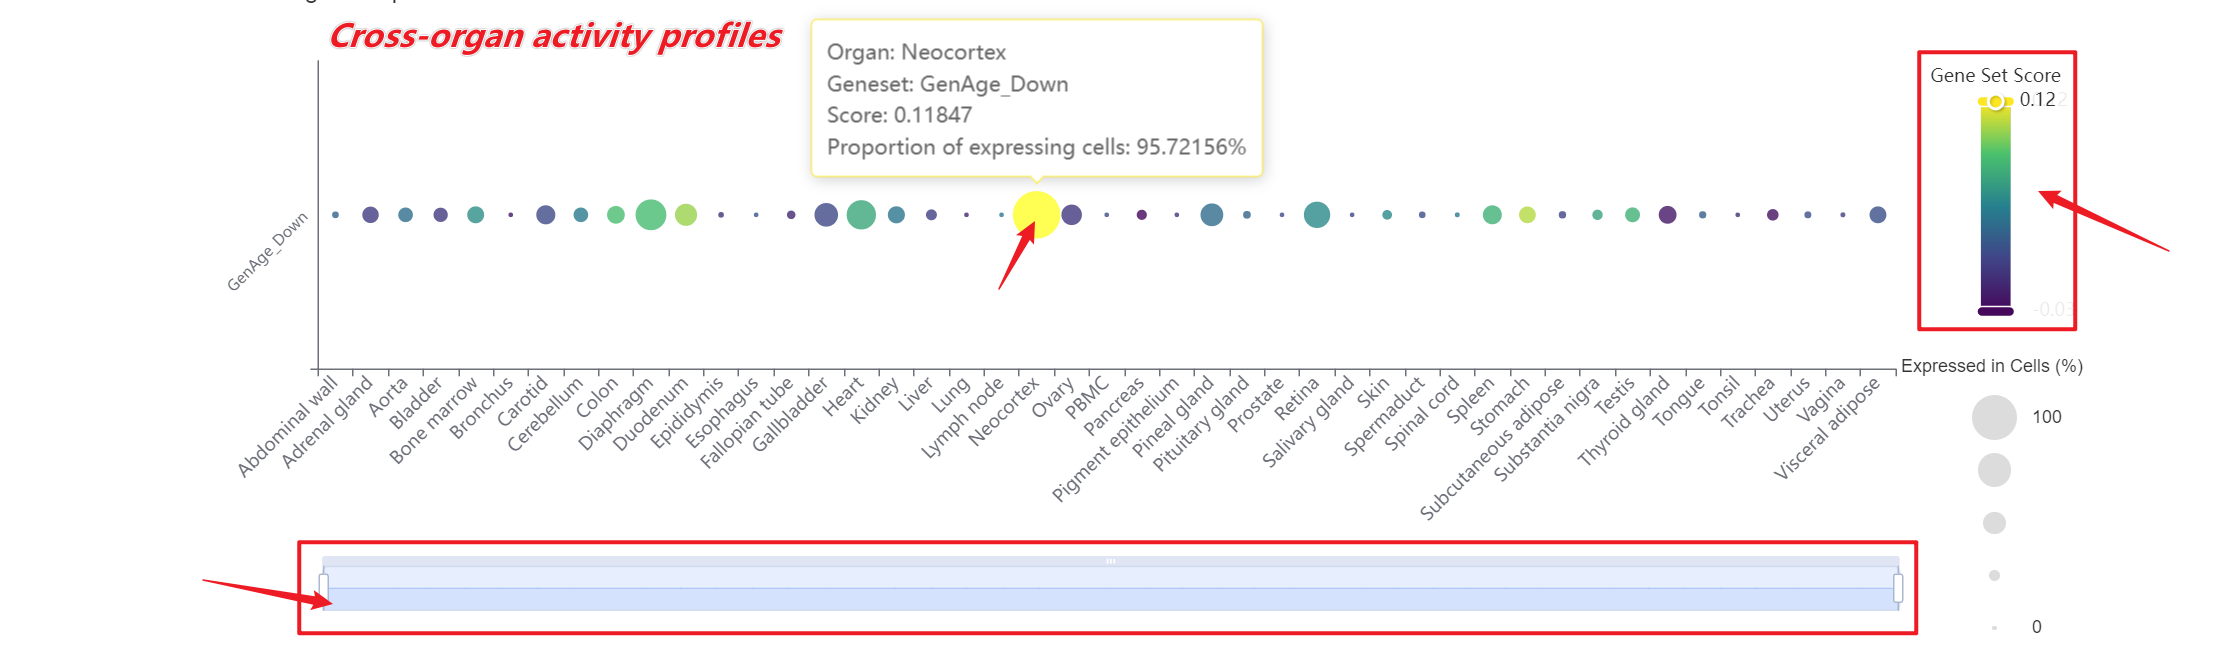
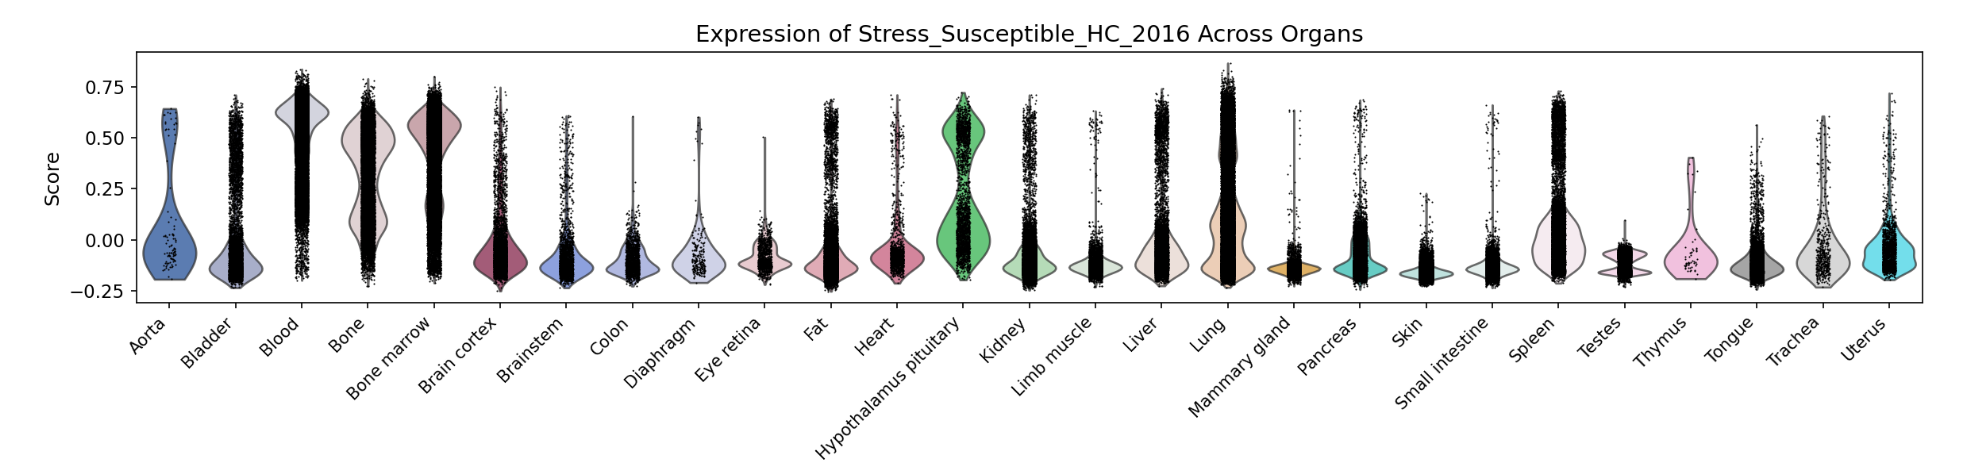
A bar chart will then display the activity of the chosen gene set across annotated cell types within the selected organ. You can download both the gene set score table and the bar chart by clicking the download buttons. Additionally, cross-organ activity profiles within each species are provided at the bottom of the display panel.
-
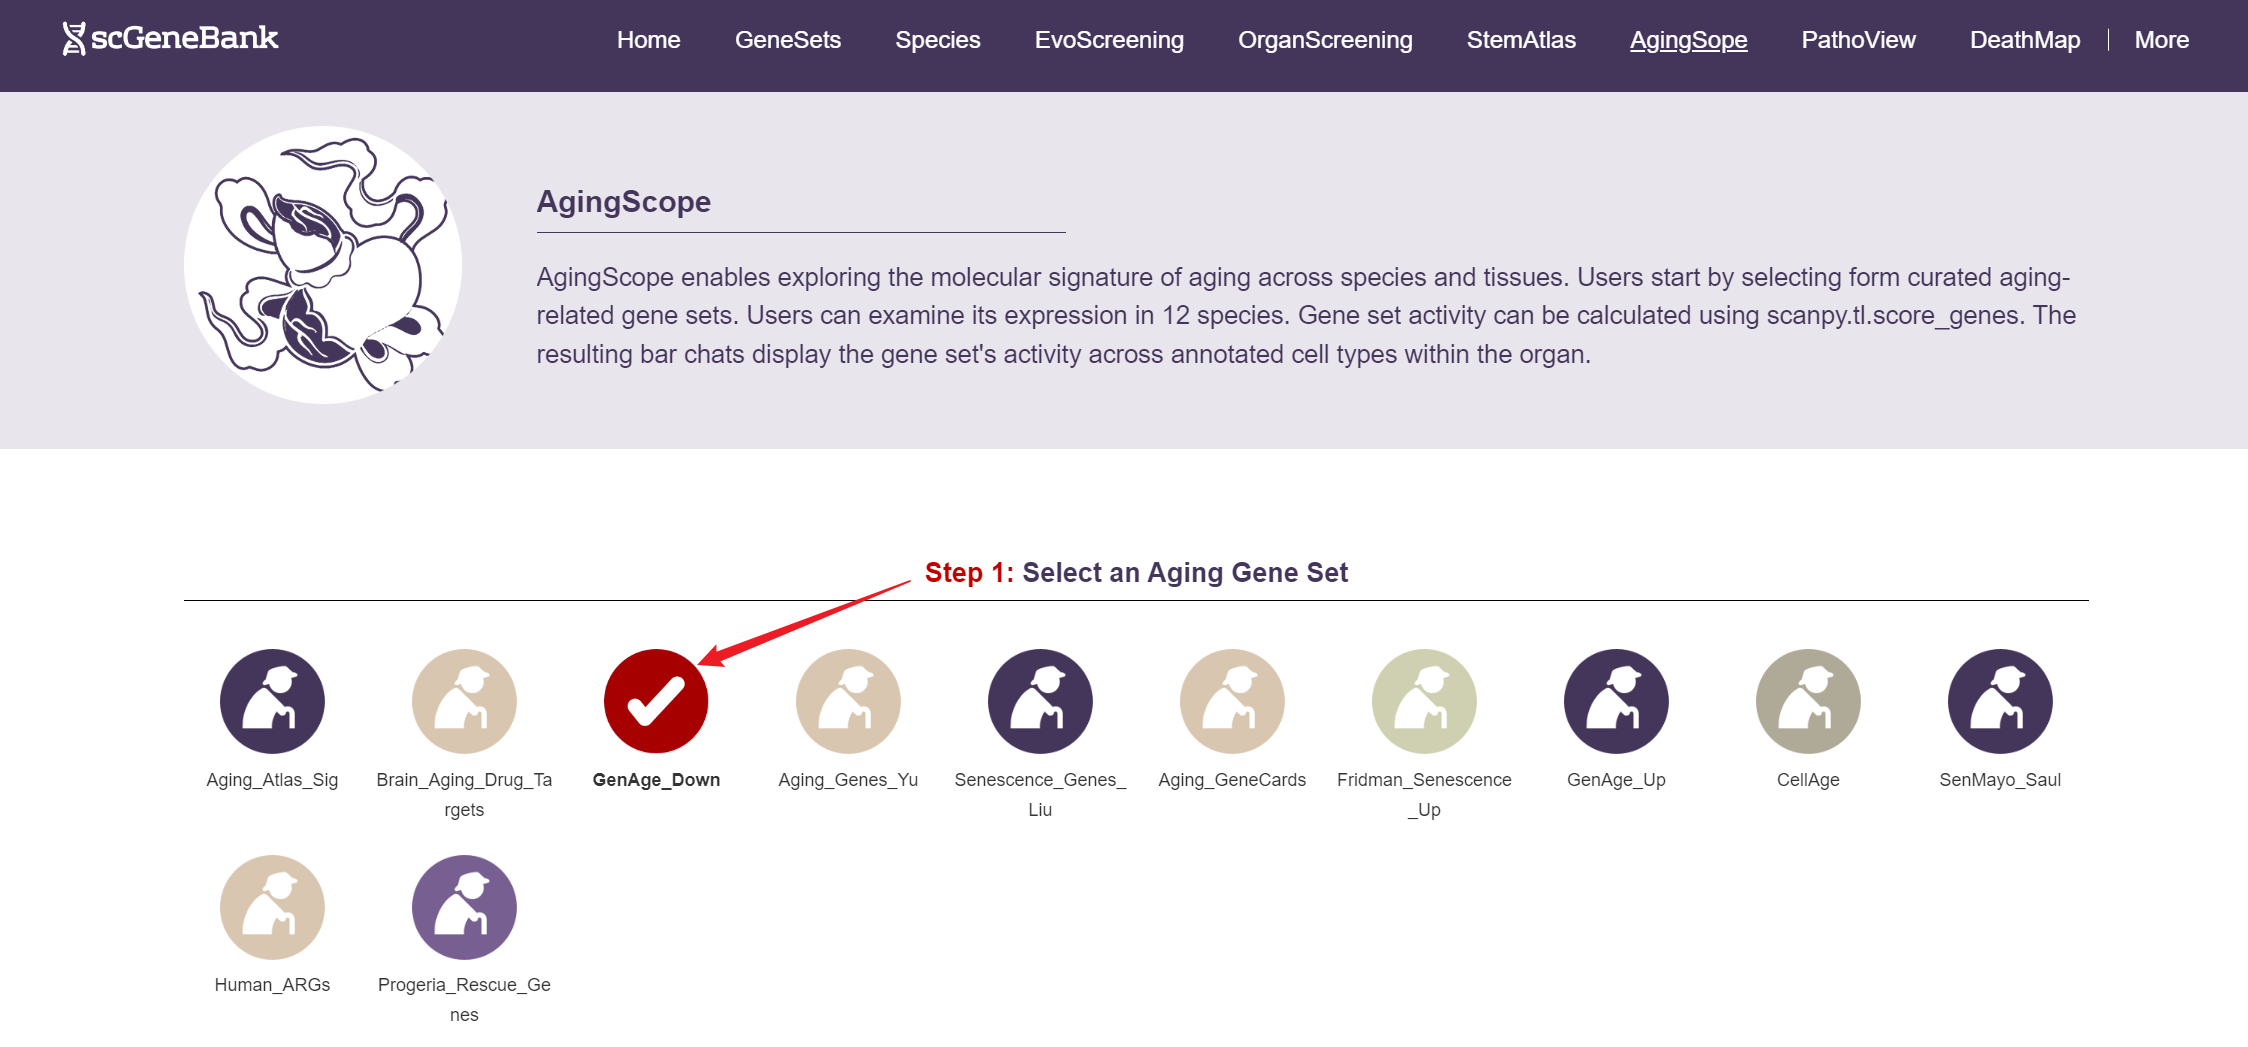
Tutorial of AgingScope
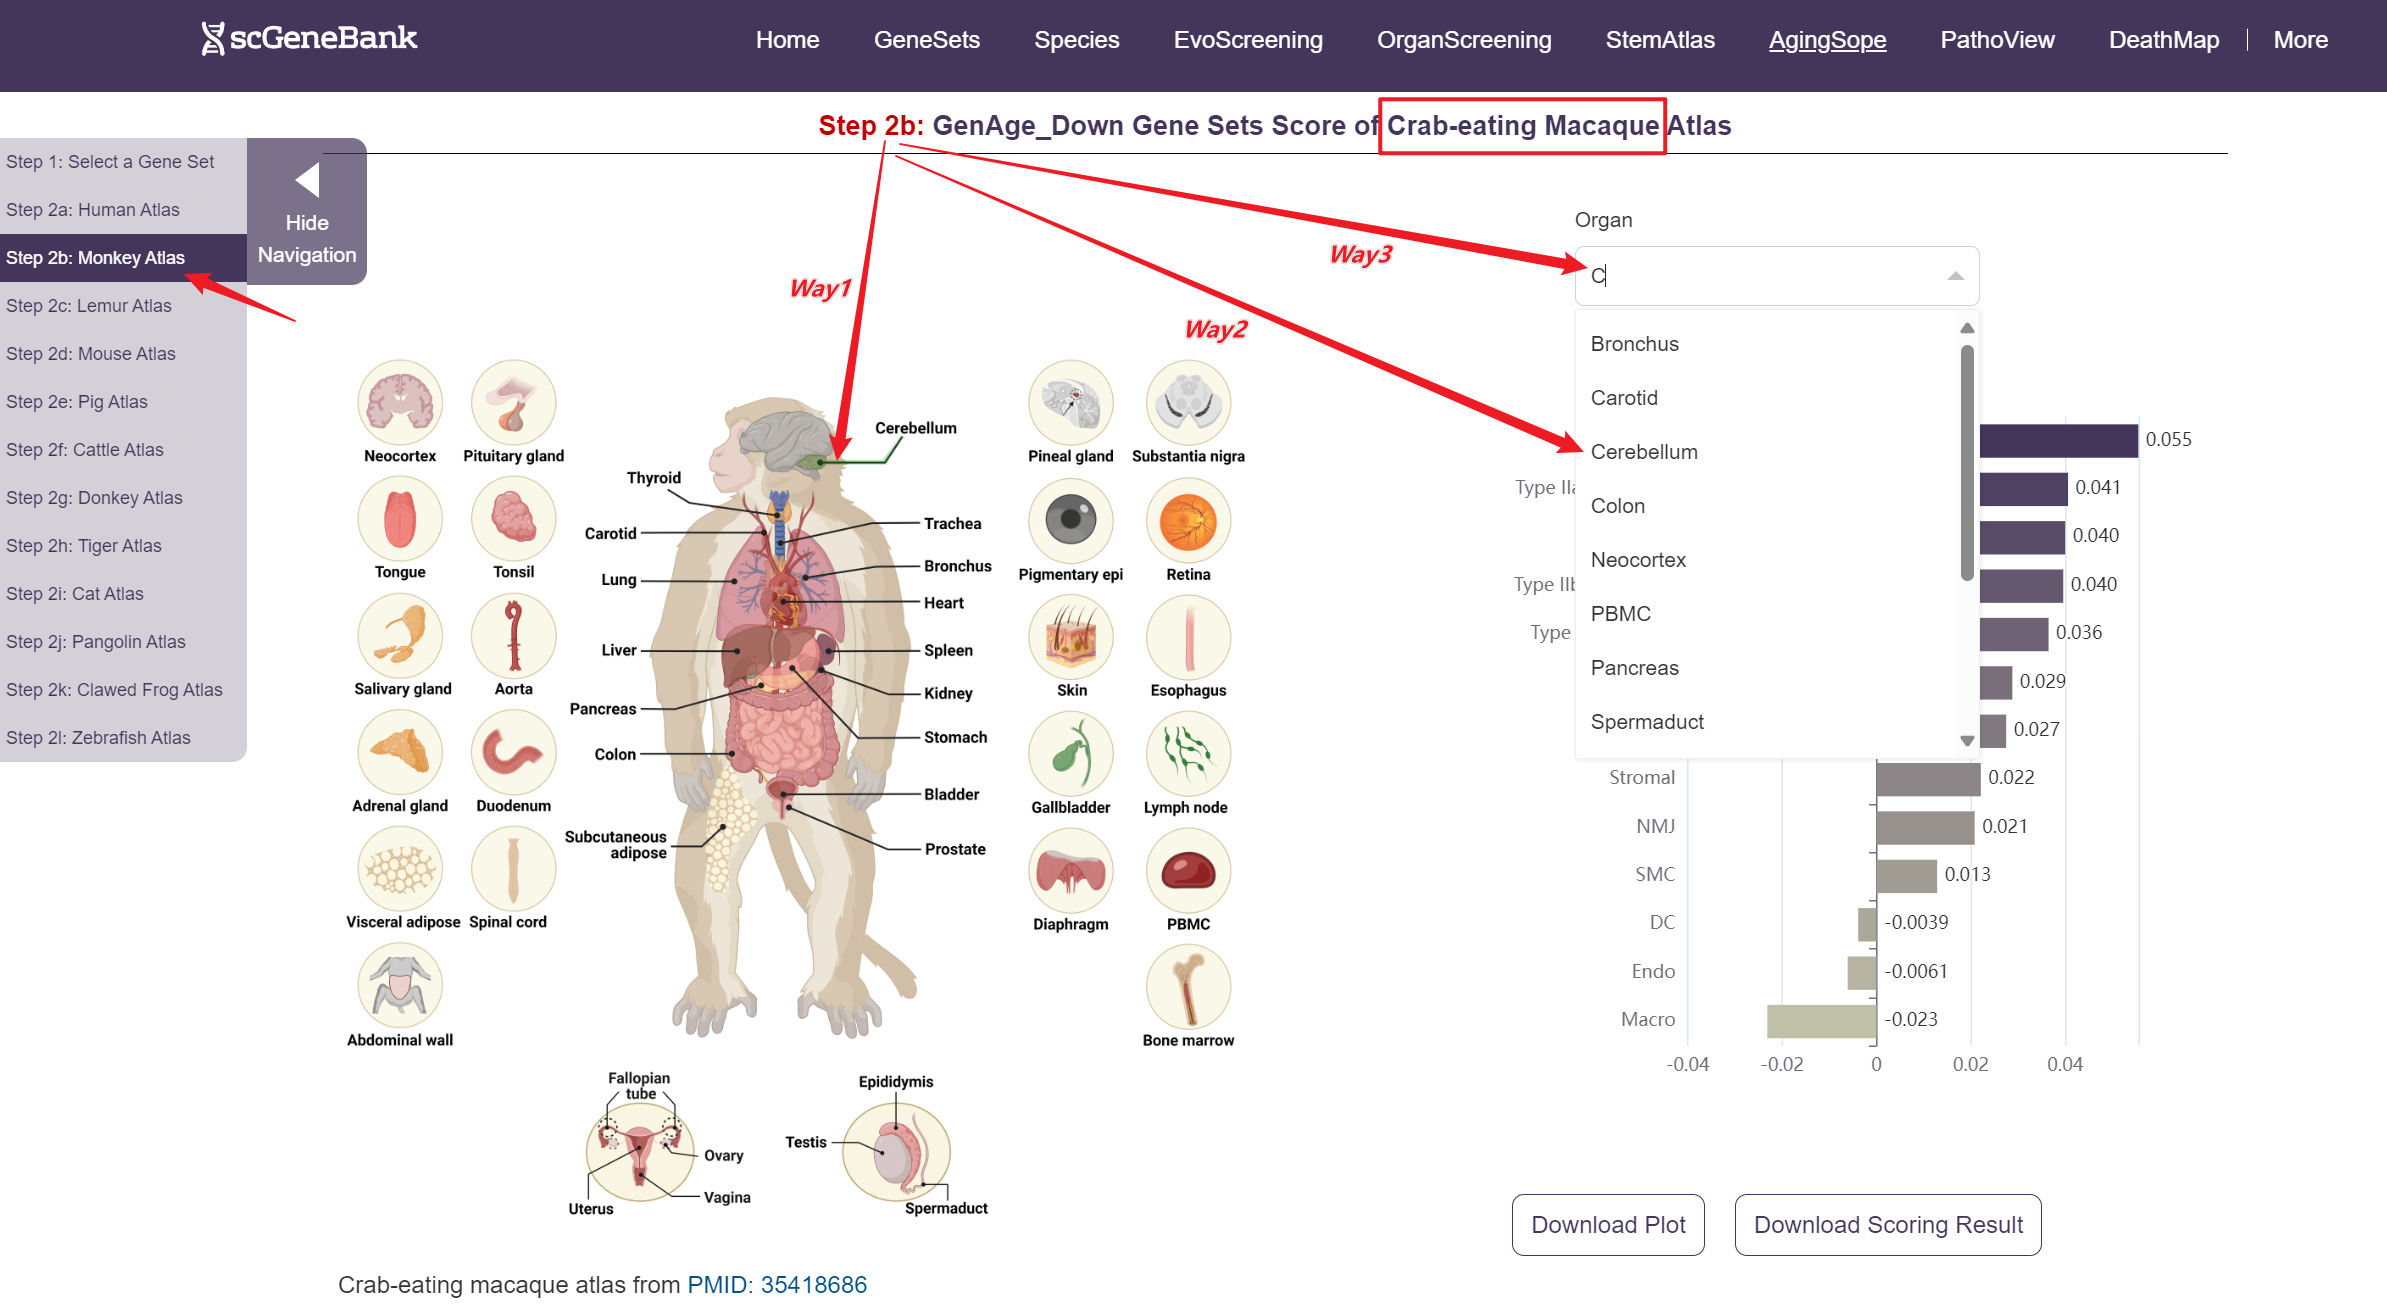
AgingScope supports gene set scoring for Aging-related signature across whole-body atlas of 12 species at single-cell resolution.
To begin, select an aging-related gene set by clicking on its icon-options.
Step 1
Next, scroll or click on the navigation bar at the bottom left to a specific display panel (12 species), then either click the corresponding region in the interactive anatomical diagram, use the filter bar to make a selection, or manually enter the target organ. Once the organ is selected, users can calculate gene set activity using the scanpy.tl.score_genes method.
Step 2
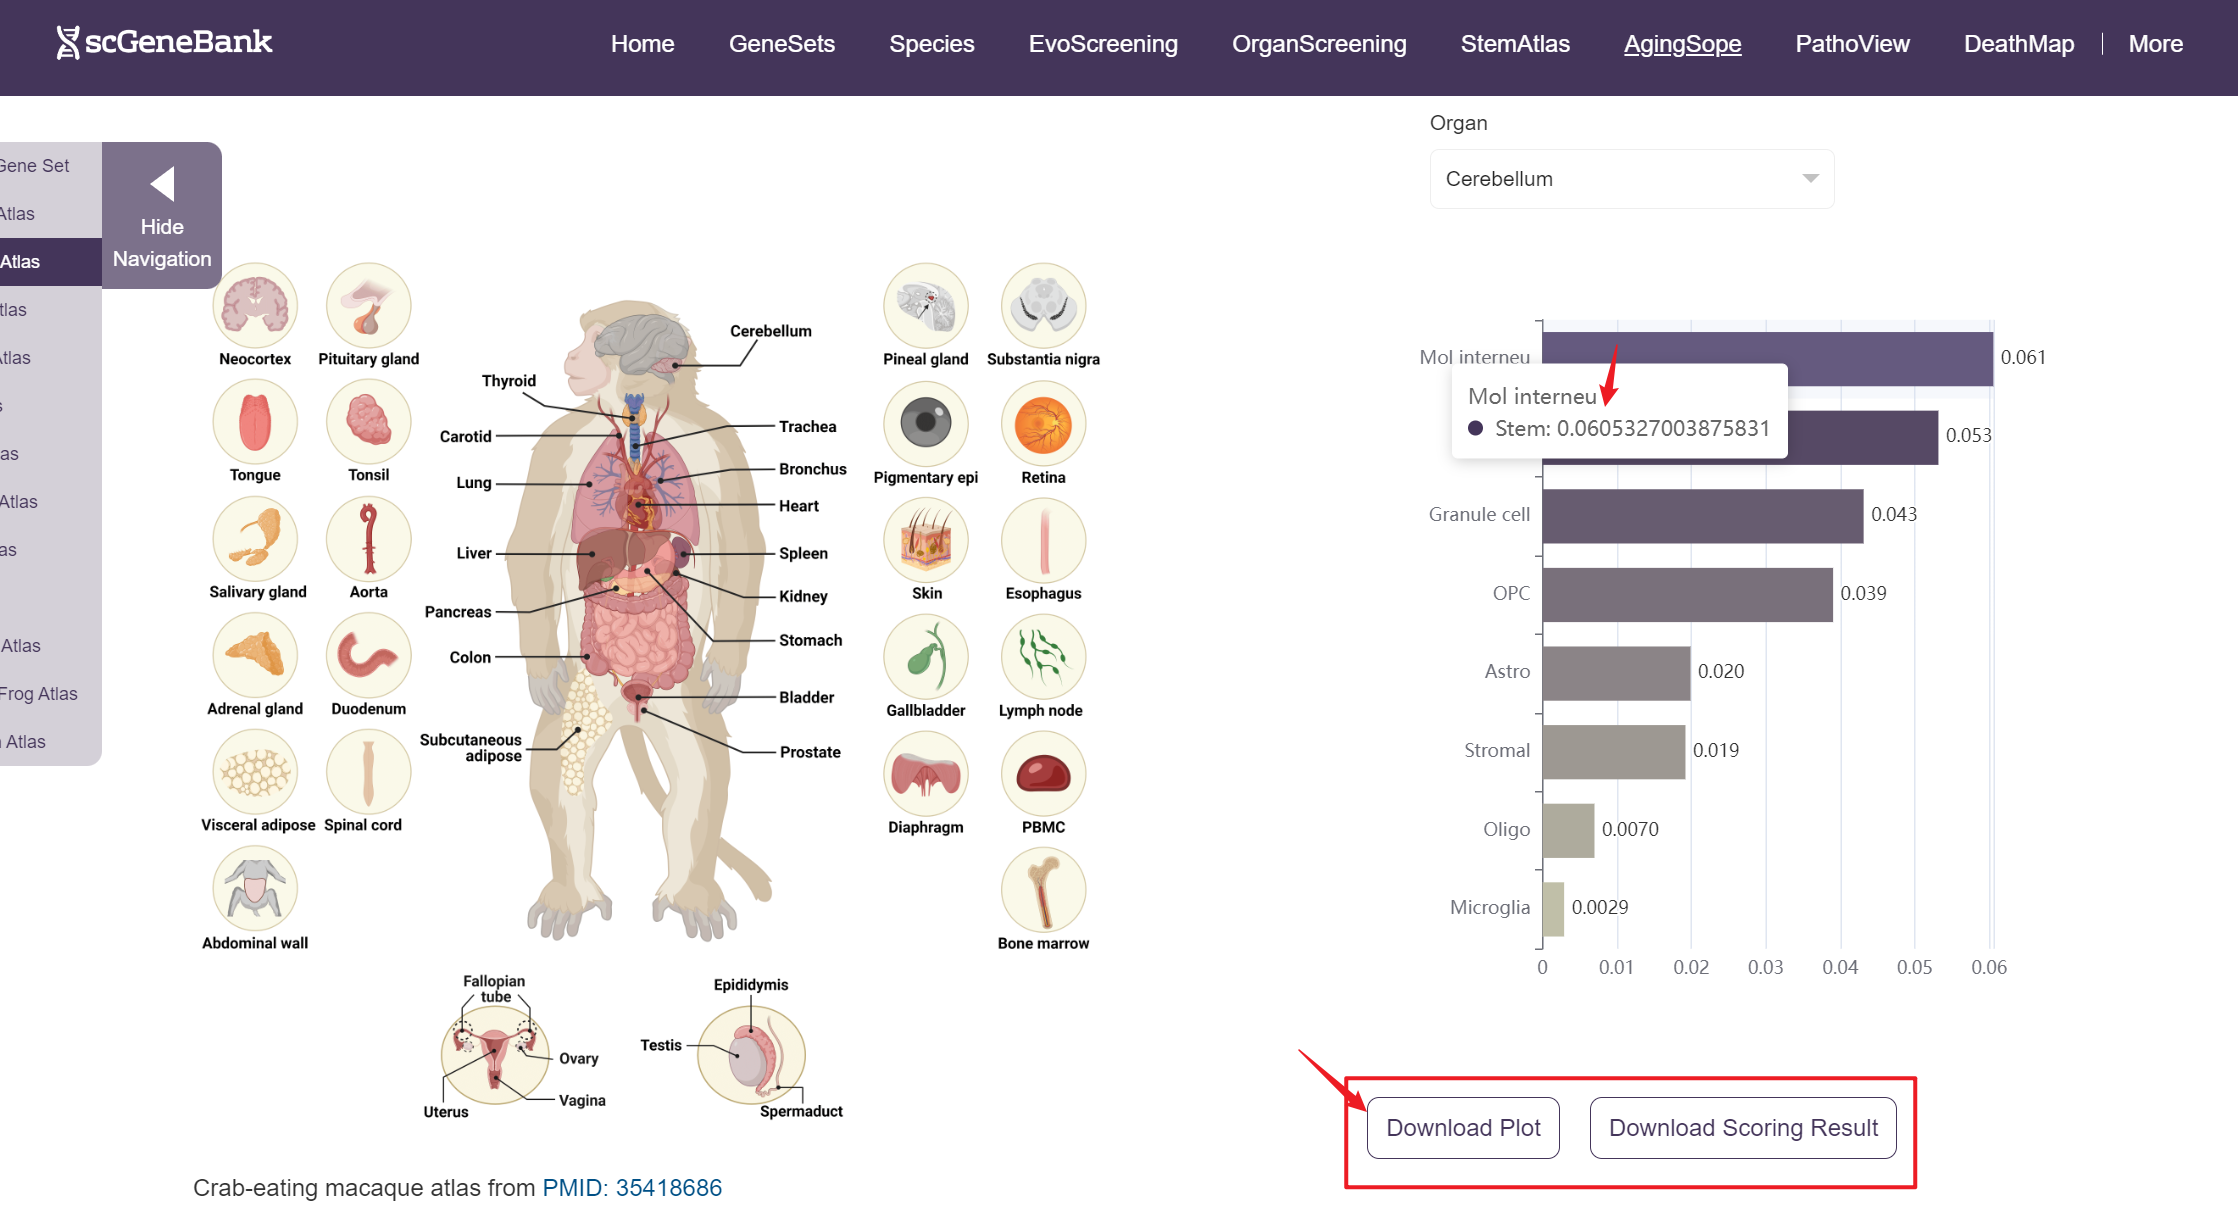
A bar chart will then display the activity of the chosen gene set across annotated cell types within the selected organ. You can download both the gene set score table and the bar chart by clicking the download buttons. Additionally, cross-organ activity profiles with each species are provided at the bottom of the display panel.
-
Tutorial of PathoView
PathoView supports gene set scoring for human disease-related signature across whole-body atlas of 12 species at single-cell resolution.
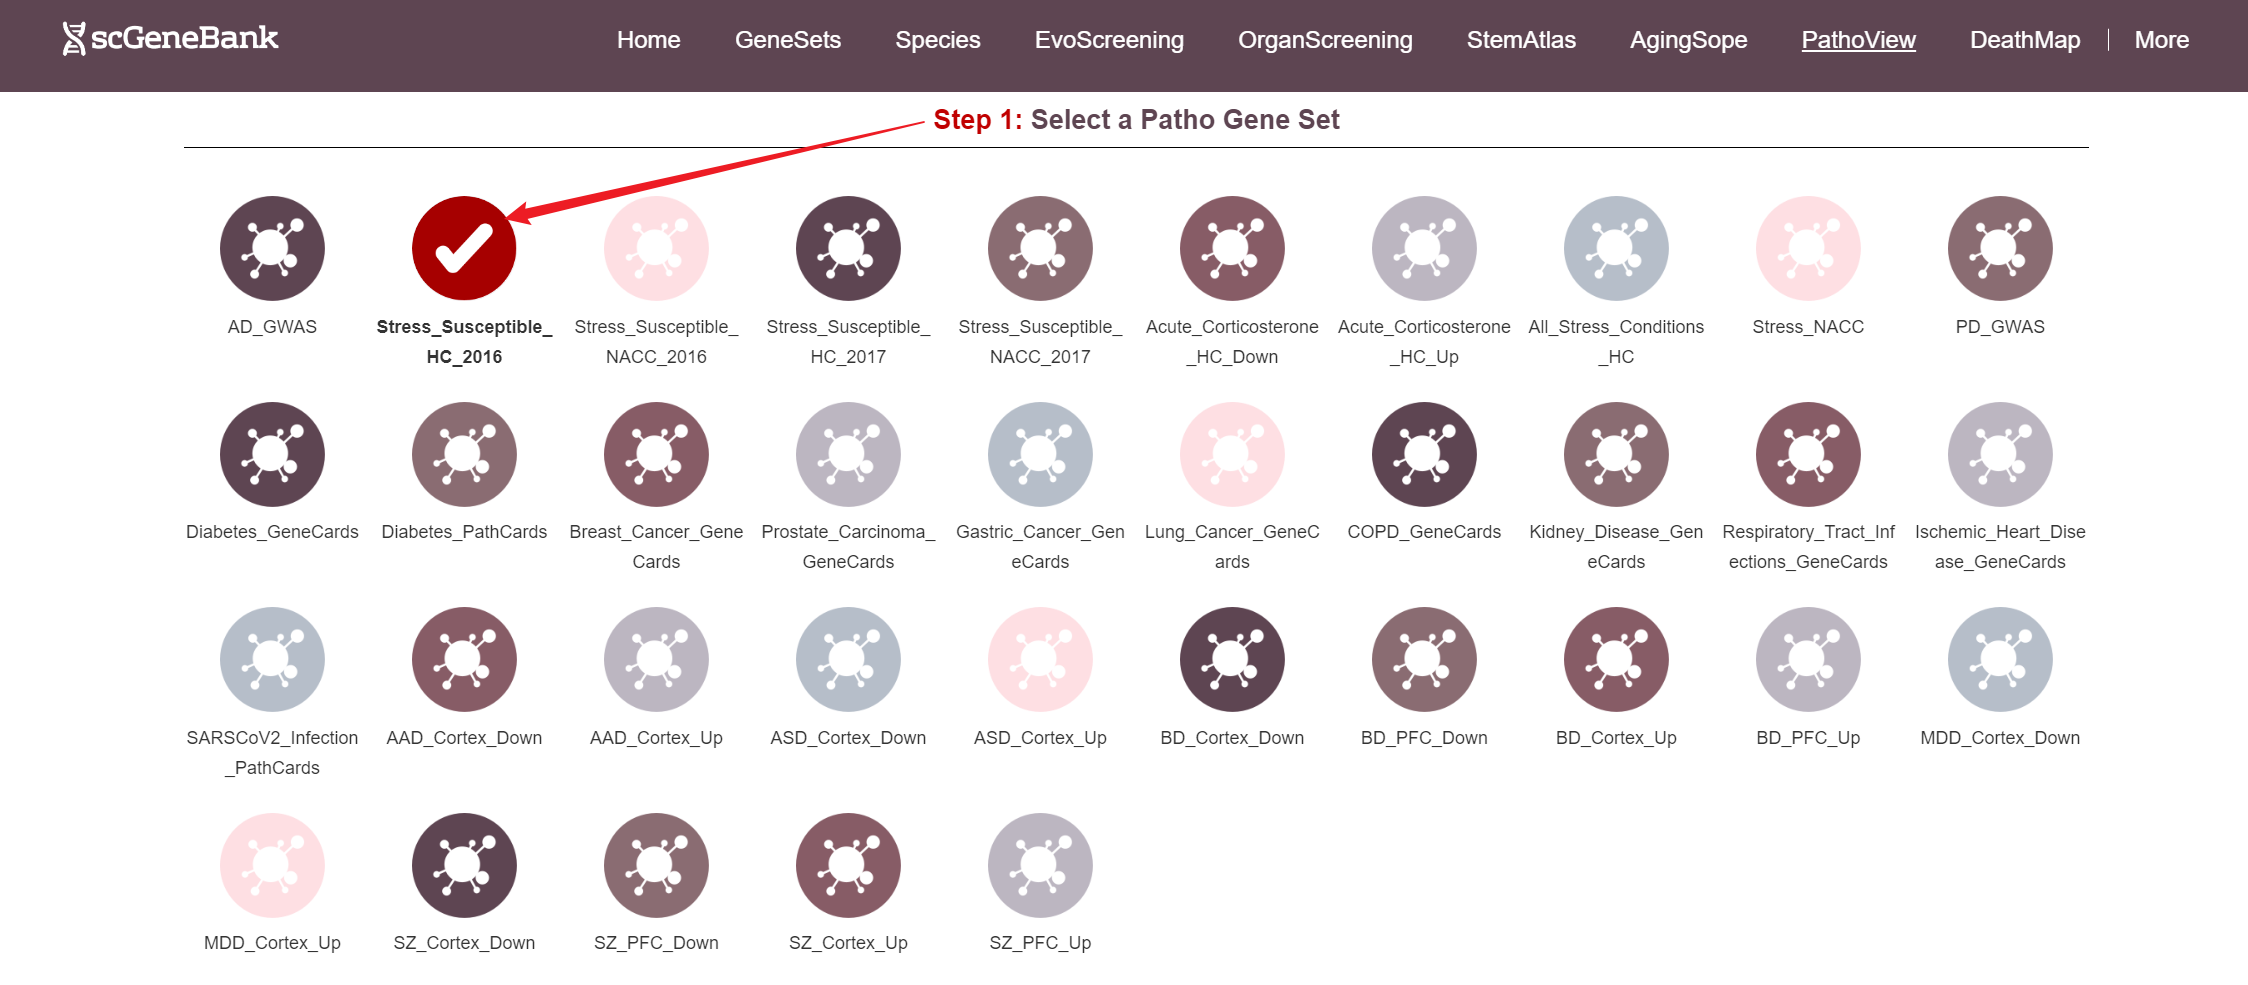
To begin, select a disease-related gene set by clicking on its icon-options.
Step 1
Next, scroll or click on the navigation bar at the bottom left to a specific display panel (12 species), then either click the corresponding region in the interactive anatomical diagram, use the filter bar to make a selection, or manually enter the target organ. Once the organ is selected, users can calculate gene set activity using the scanpy.tl.score_genes method.
Step 2
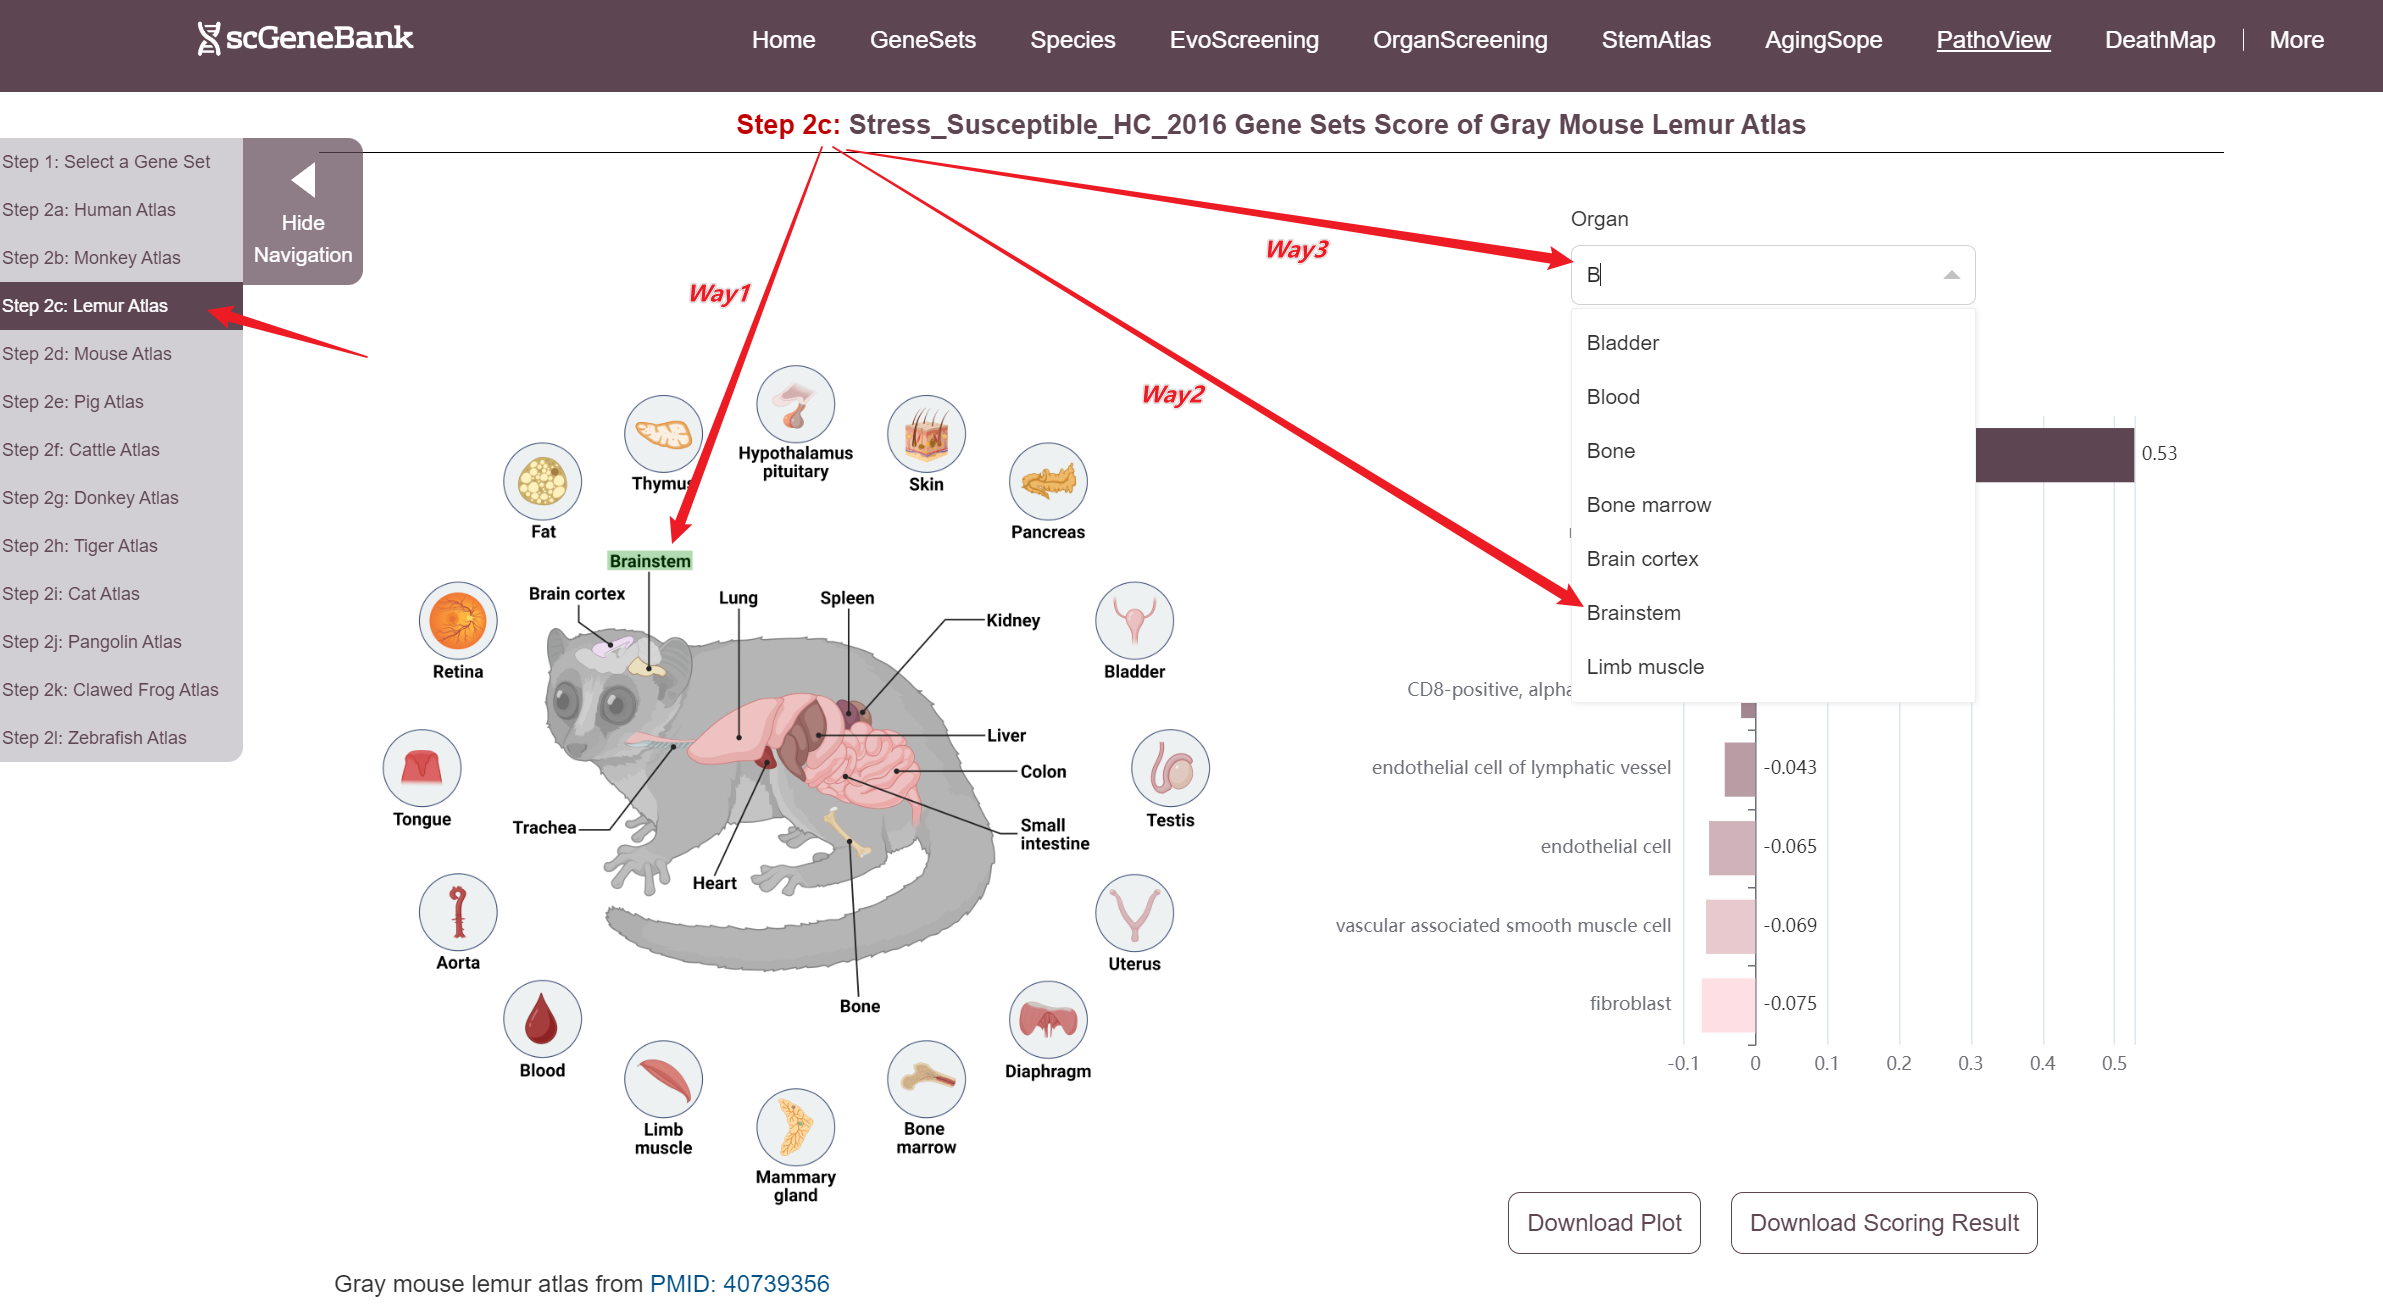
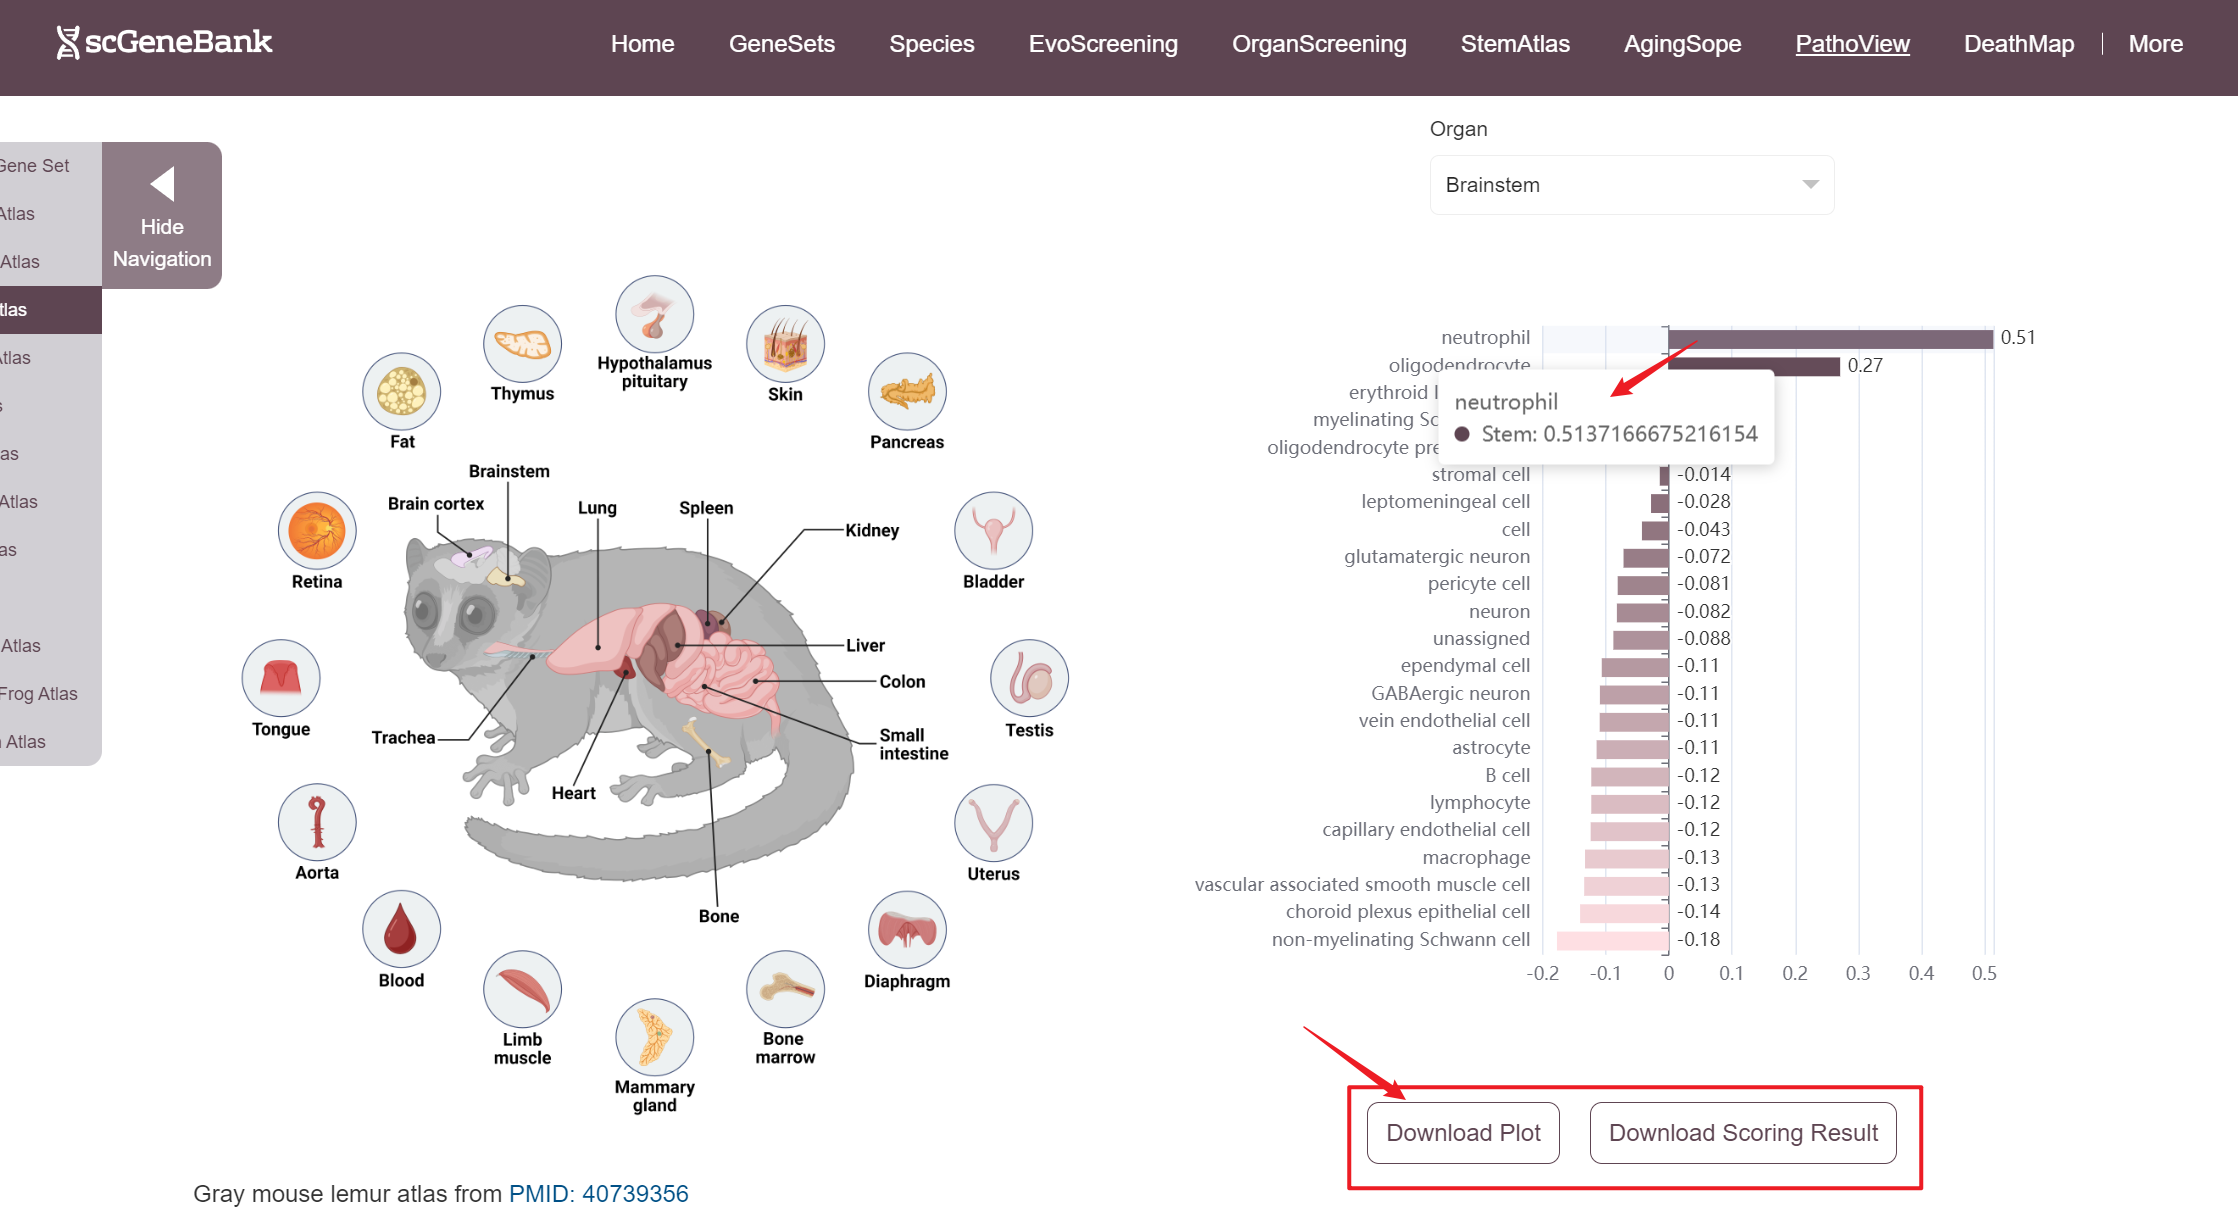
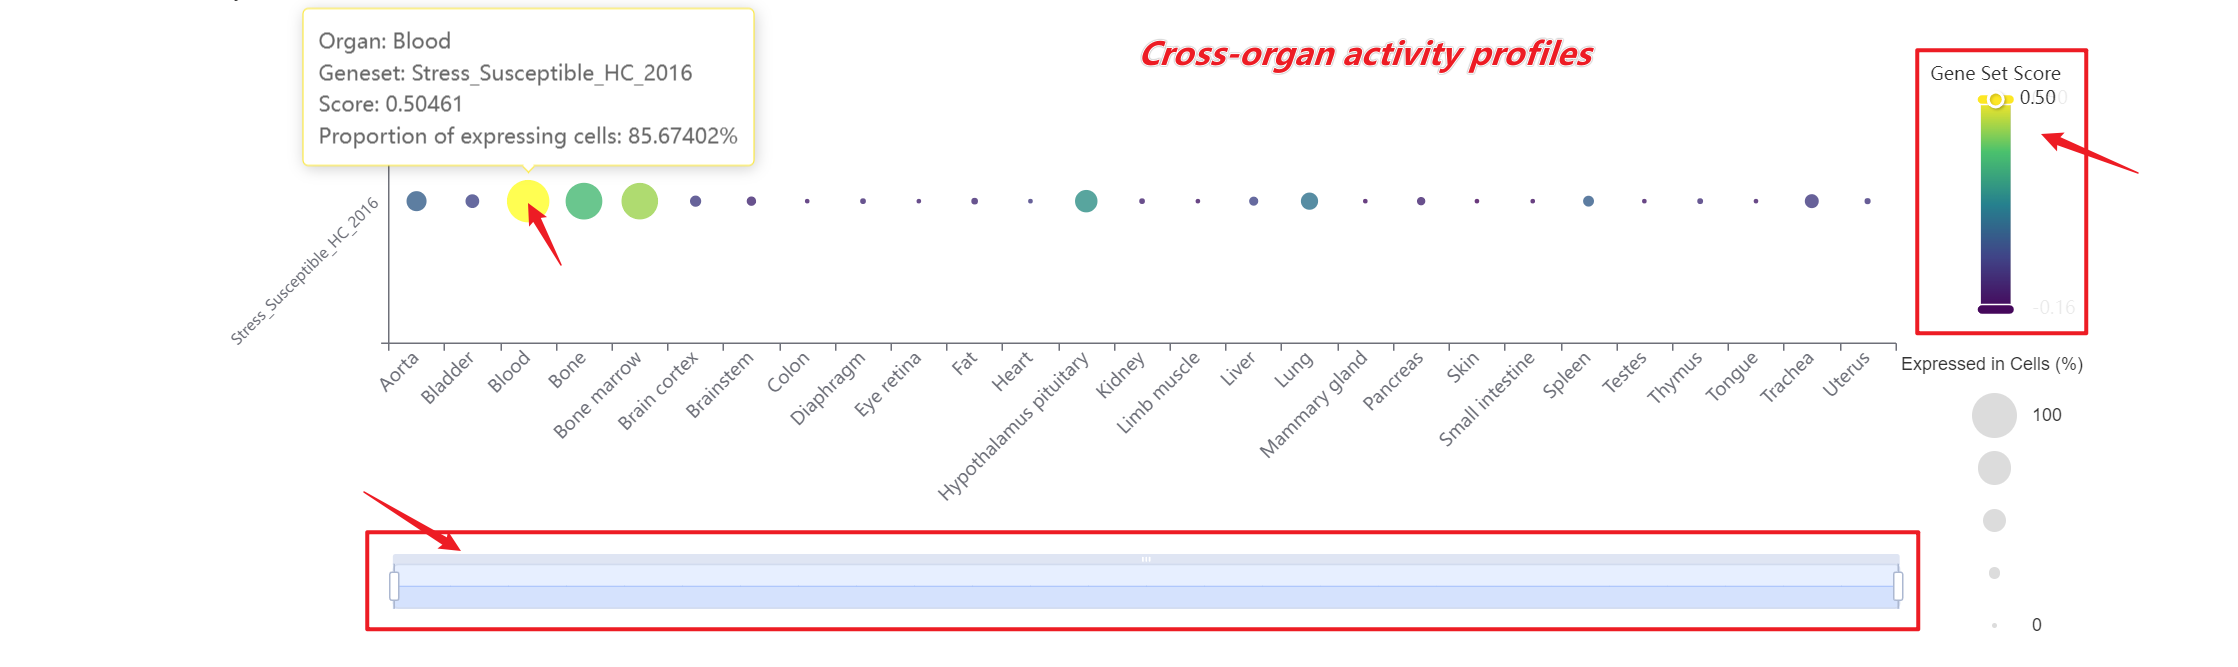
A bar chart will then display the activity of the chosen gene set across annotated cell types within the selected organ. Both the gene set score table and the bar chart can be downloaded by clicking the download button. Additionally, across-organ activity profiles with each species are provided at the bottom of the display panel.
-
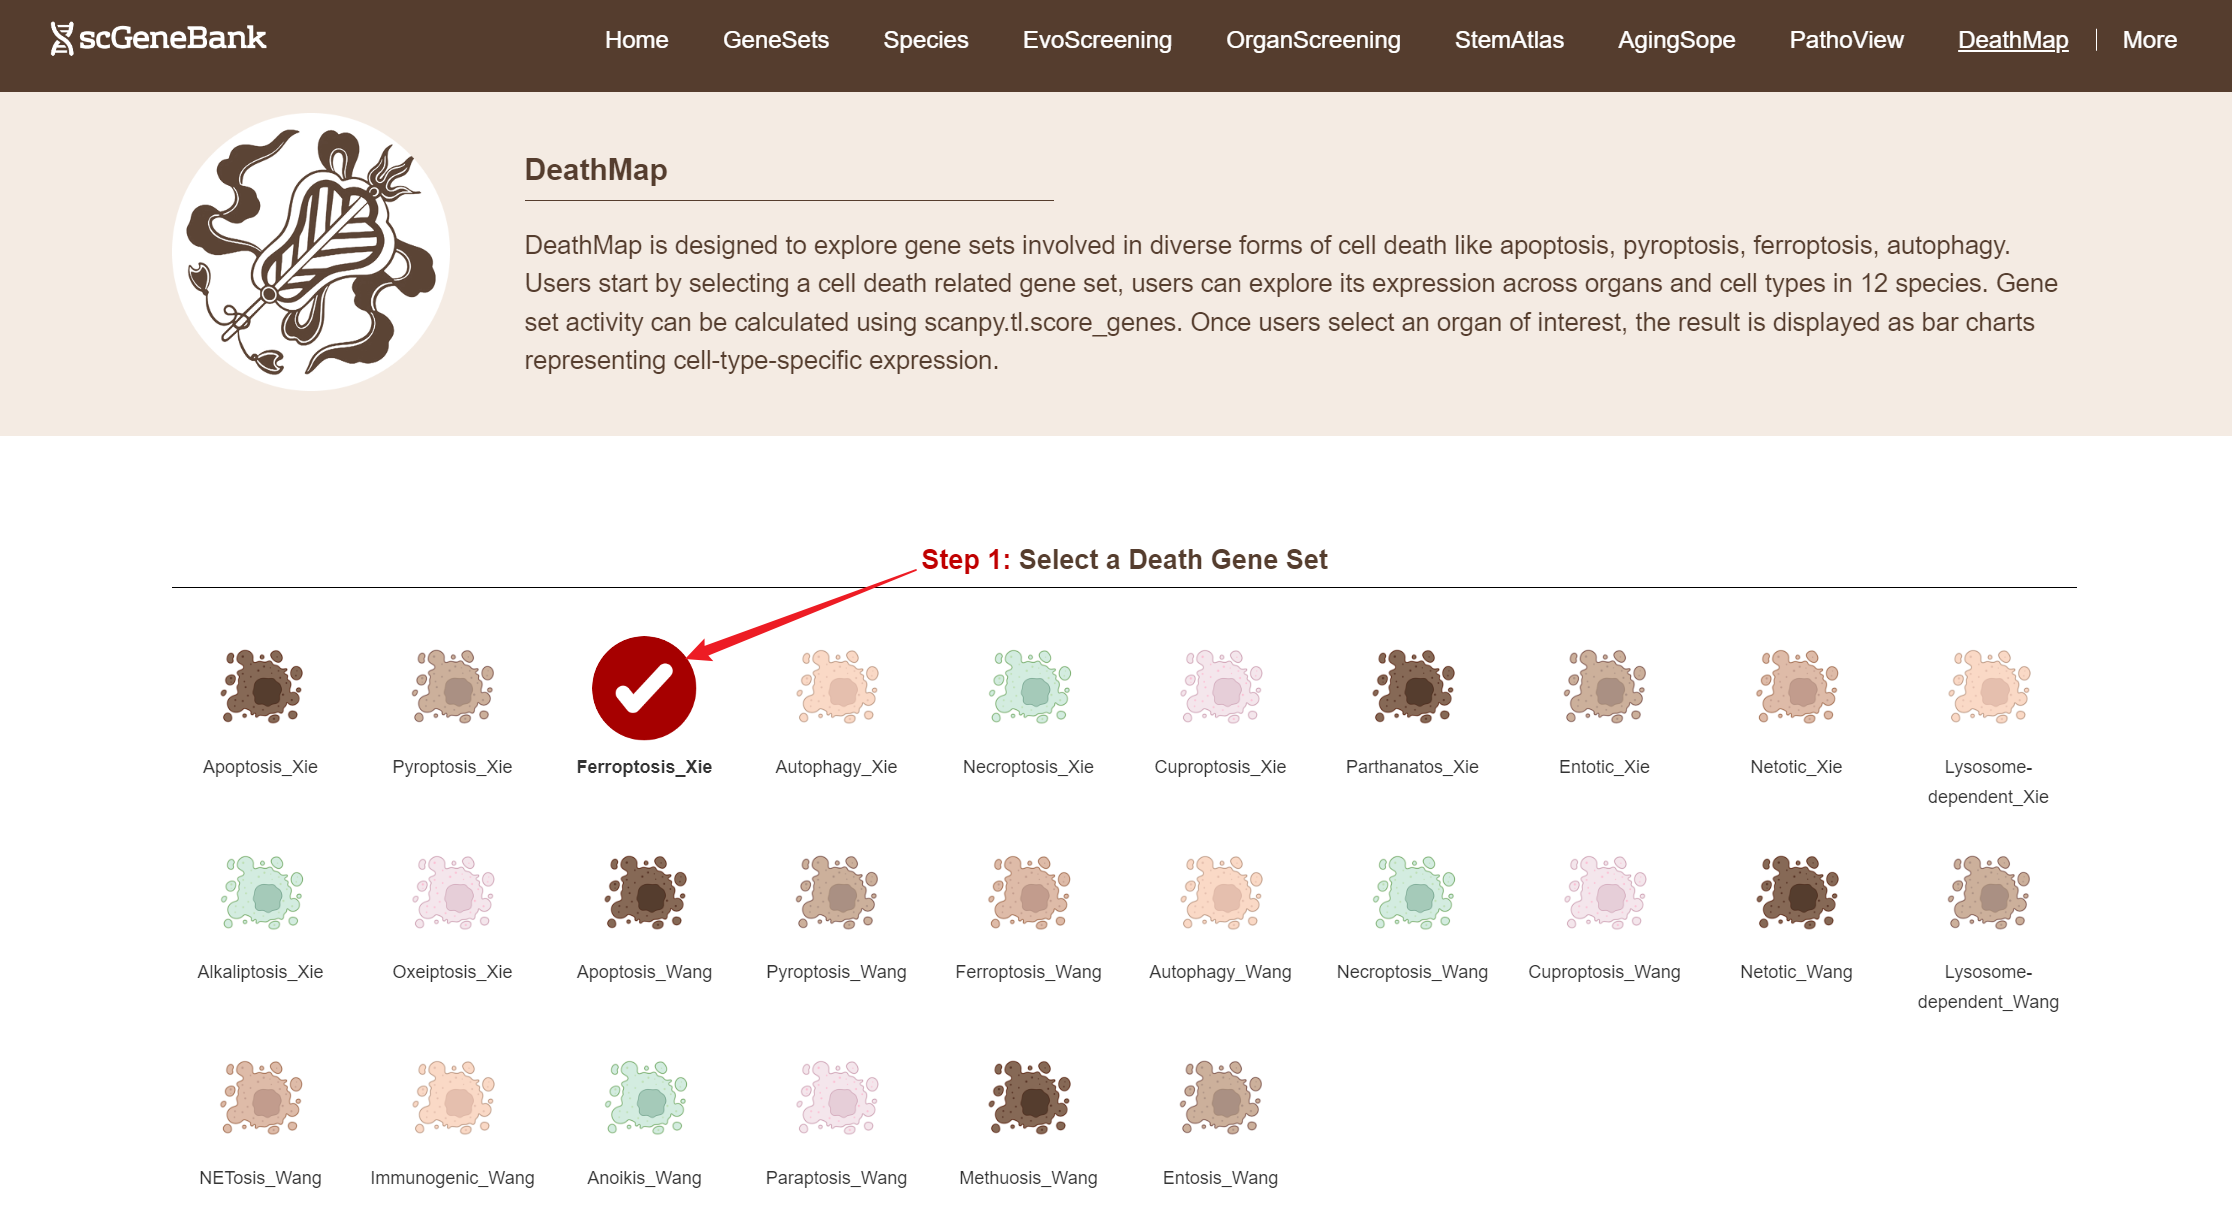
Tutorial of DeathMap
DeathMap is designed to explore gene sets involved in diverse forms of cell death like apoptosis, pyroptosis, ferroptosis, autophagy across whole-body atlas of 12 species at single-cell resolution.
To begin, select a cell death related gene set by clicking on its icon-options.
Step 1
Next, scroll or click on the navigation bar at the bottom left to a specific display panel (12 species), then either click the corresponding region in the interactive anatomical diagram, use the filter bar to make a selection, or manually enter the target organ. Once the organ is selected, users can calculate gene set activity using the scanpy.tl.score_genes method.
Step 2
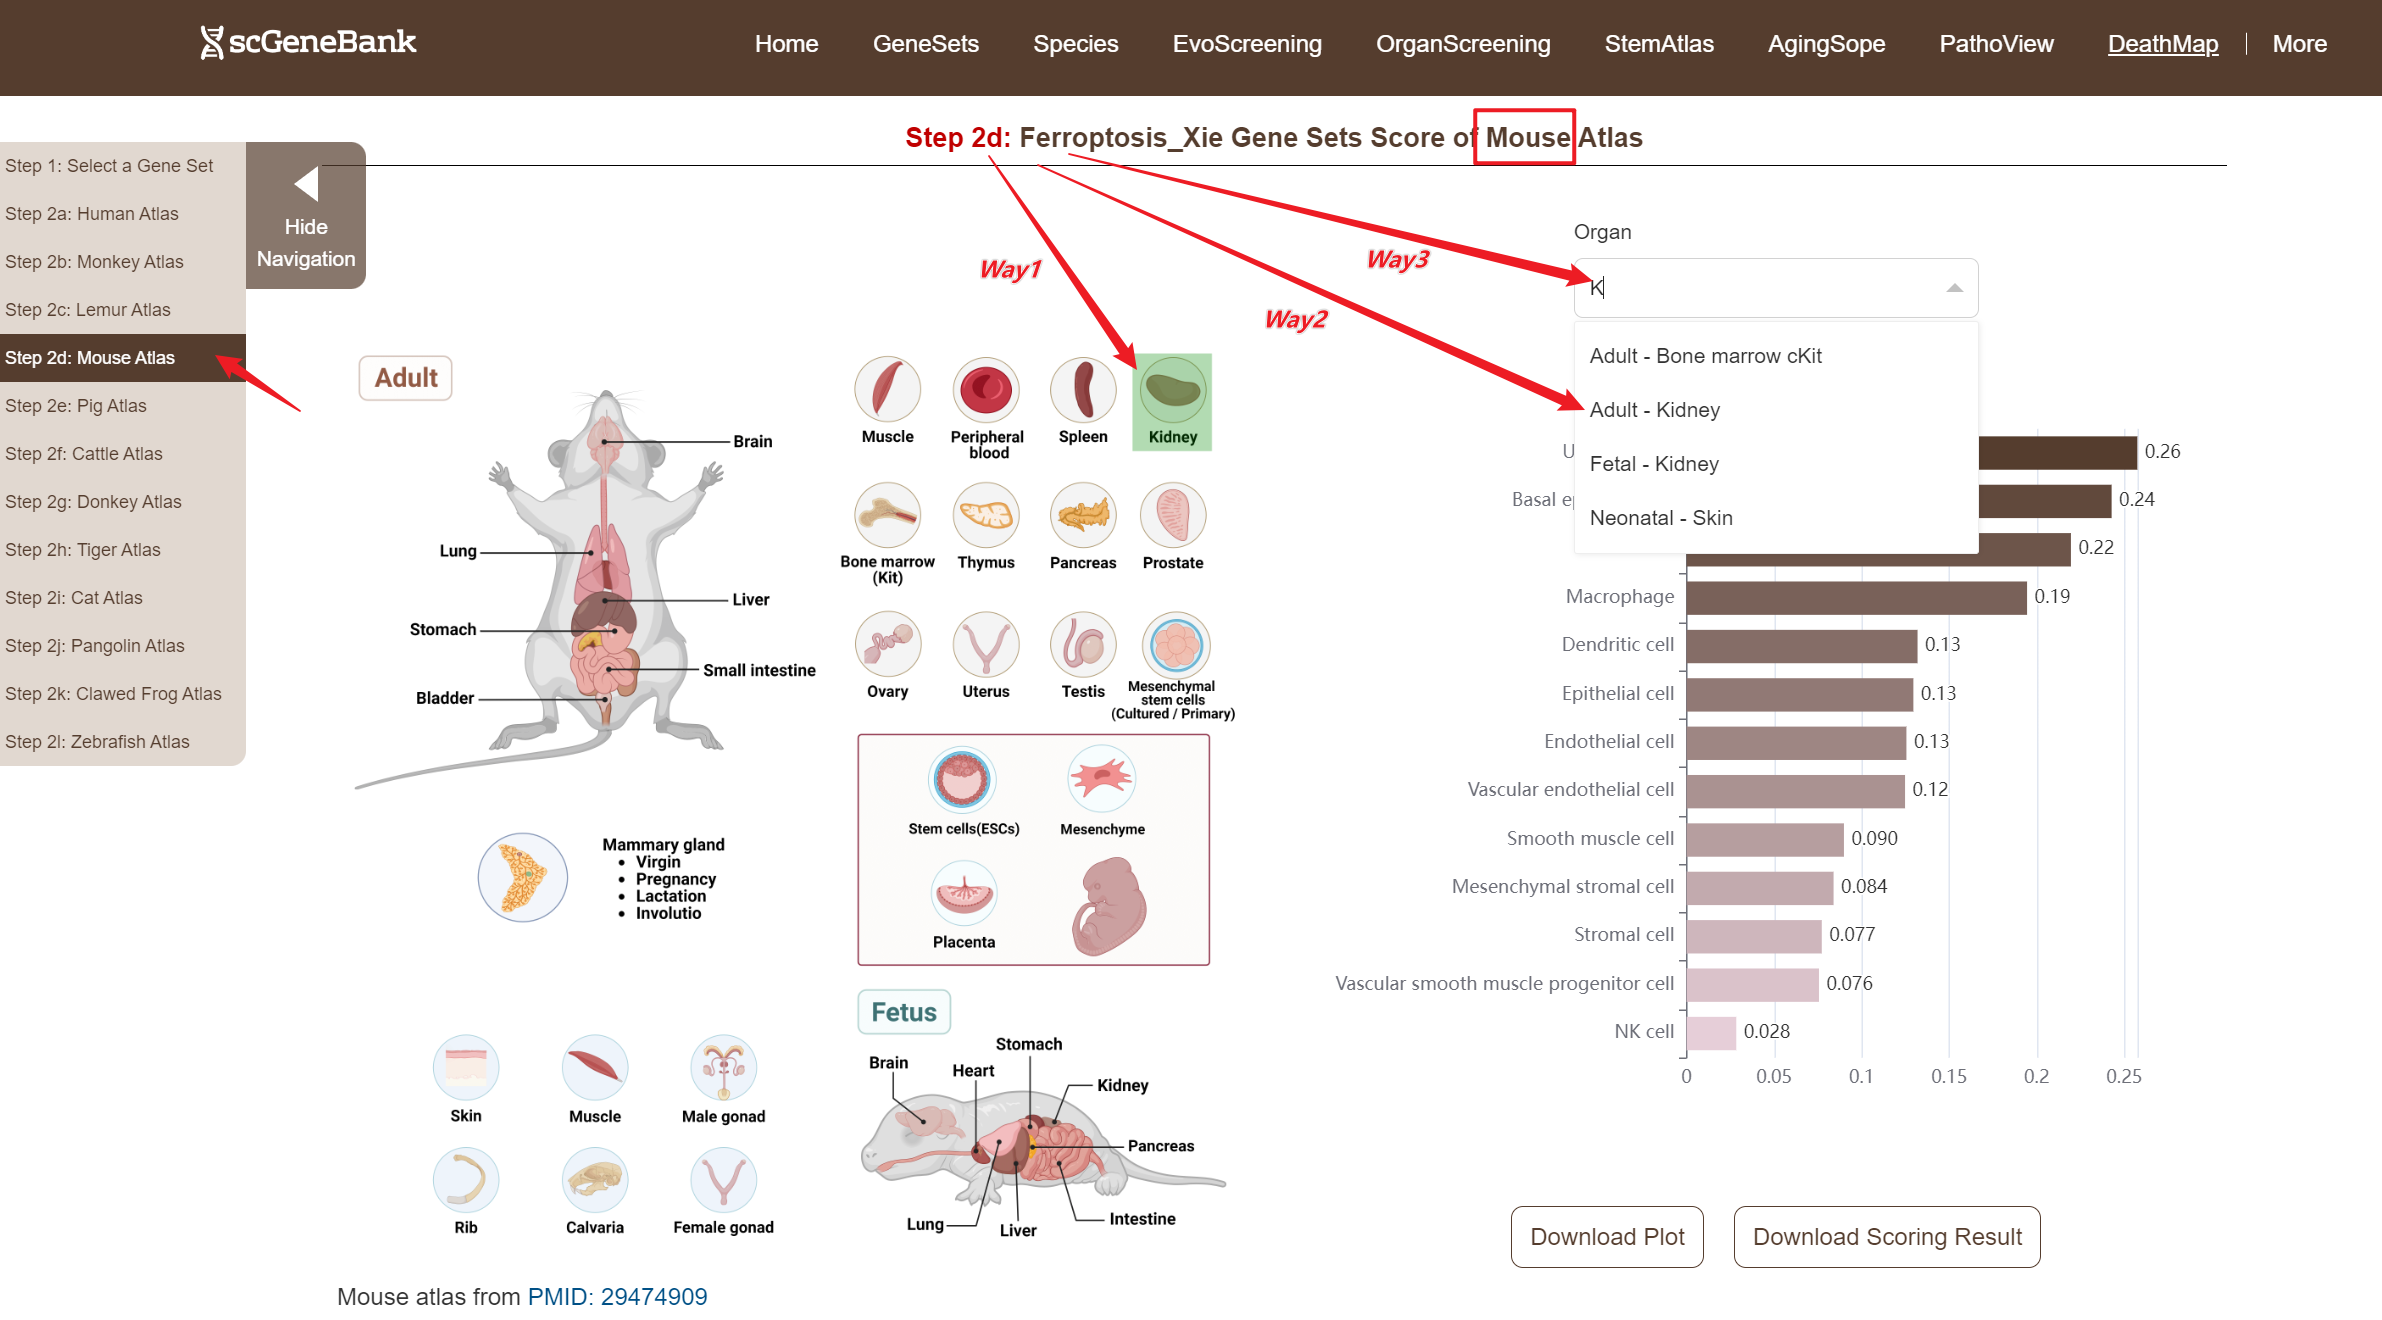
A bar chart will then display the activity of the chosen gene set across annotated cell types within the selected organ. Both the gene set score table and the bar chart can be downloaded by clicking the download buttons. Additonally, cross-organ activity profiles within each species are provided at the bottom of the display panel.