
EvoScreening
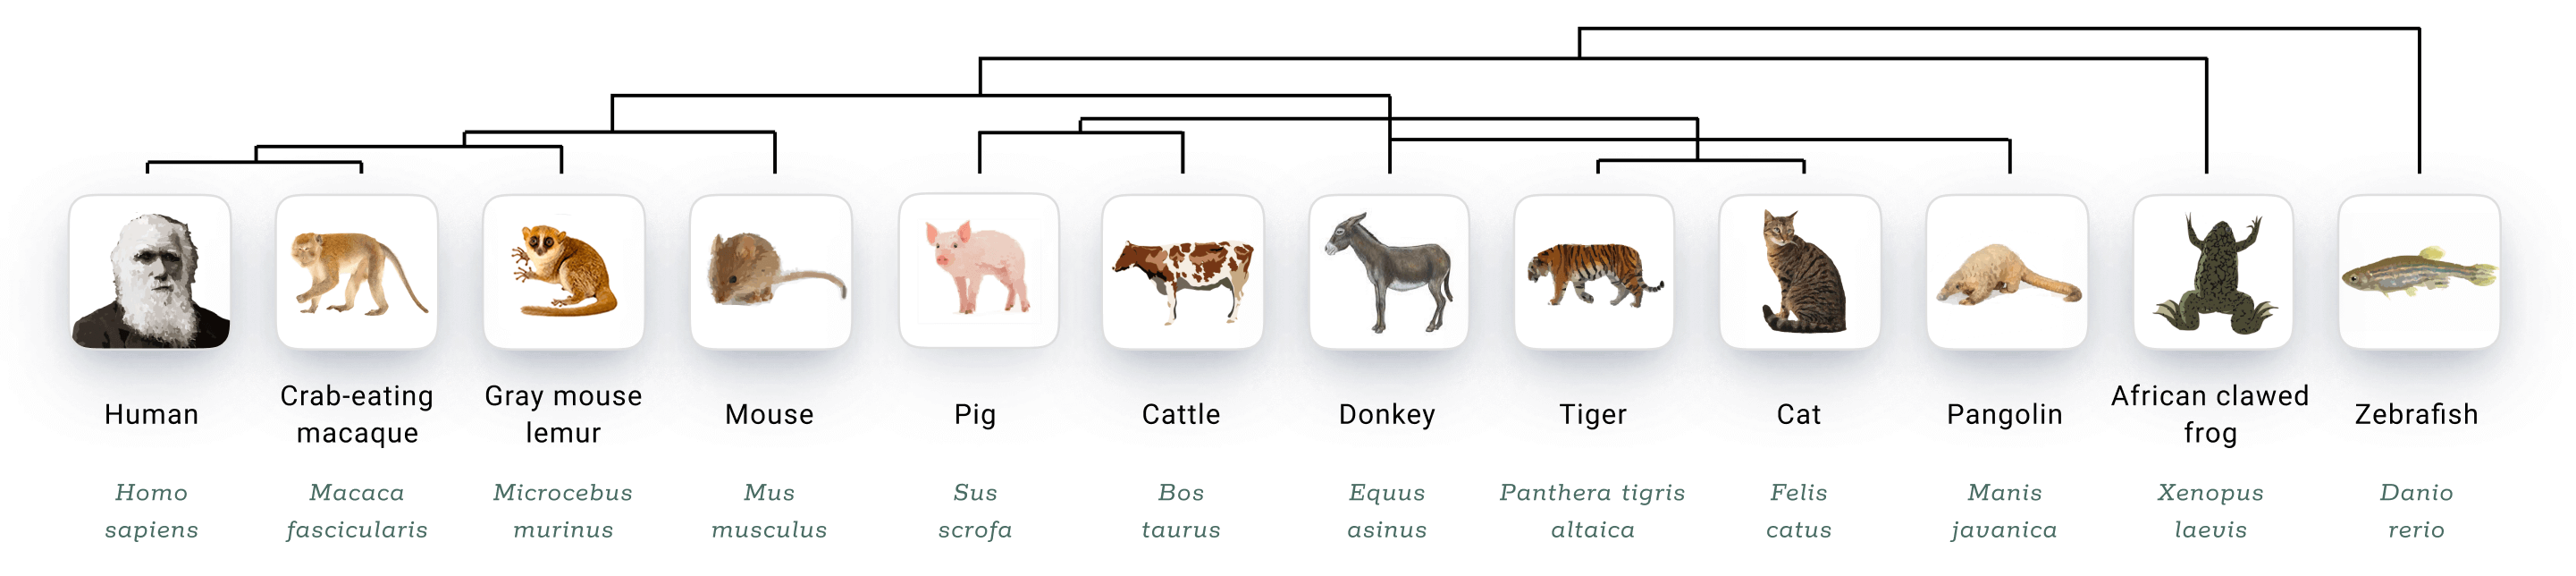
EvoScreening enables users to explore how functional gene sets are expressed across key evolutionary branches. By selecting a specific tissue and one or more gene sets, users can visualize gene expression patterns across representative species from major lineages, including mammals, amphibians, and fish. Results are displayed as a bubble plot, where each row represents a gene set and each column a species. Bubble size and color indicate expression levels within the selected organ. This module is ideal for studying evolutionary conservation, functional divergence, and species-specific gene regulation at single-cell resolution.
Investigated Species in This Module
PMID:
Data Source: The dataset on this page is derived from the aforementioned publication.
Step 1: Select an Organ
Step 2: Cross-species Atlas - Gene Set Selection
Search
Gene sets of
The gene sets screened for plotting
Cross-species Score of 0 Gene Sets in
Gene Set Name
Download Plot
Download Plot PNG
Download Plot PDF
Download All Scoring Results
Download All Scoring Results
Expressed in Cells (%)
- 100
- 0

* For bubble plots, color represents the mean; for violin plots, color represents the median.