
DeathMap
DeathMap is designed to explore gene sets involved in diverse forms of cell death like apoptosis, pyroptosis, ferroptosis, autophagy. Users start by selecting a cell death related gene set, users can explore its expression across organs and cell types in 12 species. Gene set activity can be calculated using scanpy.tl.score_genes. Once users select an organ of interest, the result is displayed as bar charts representing cell-type-specific expression.
Step 1: Select a Death Gene Set
Step 2a: Gene Sets Score of Human Atlas
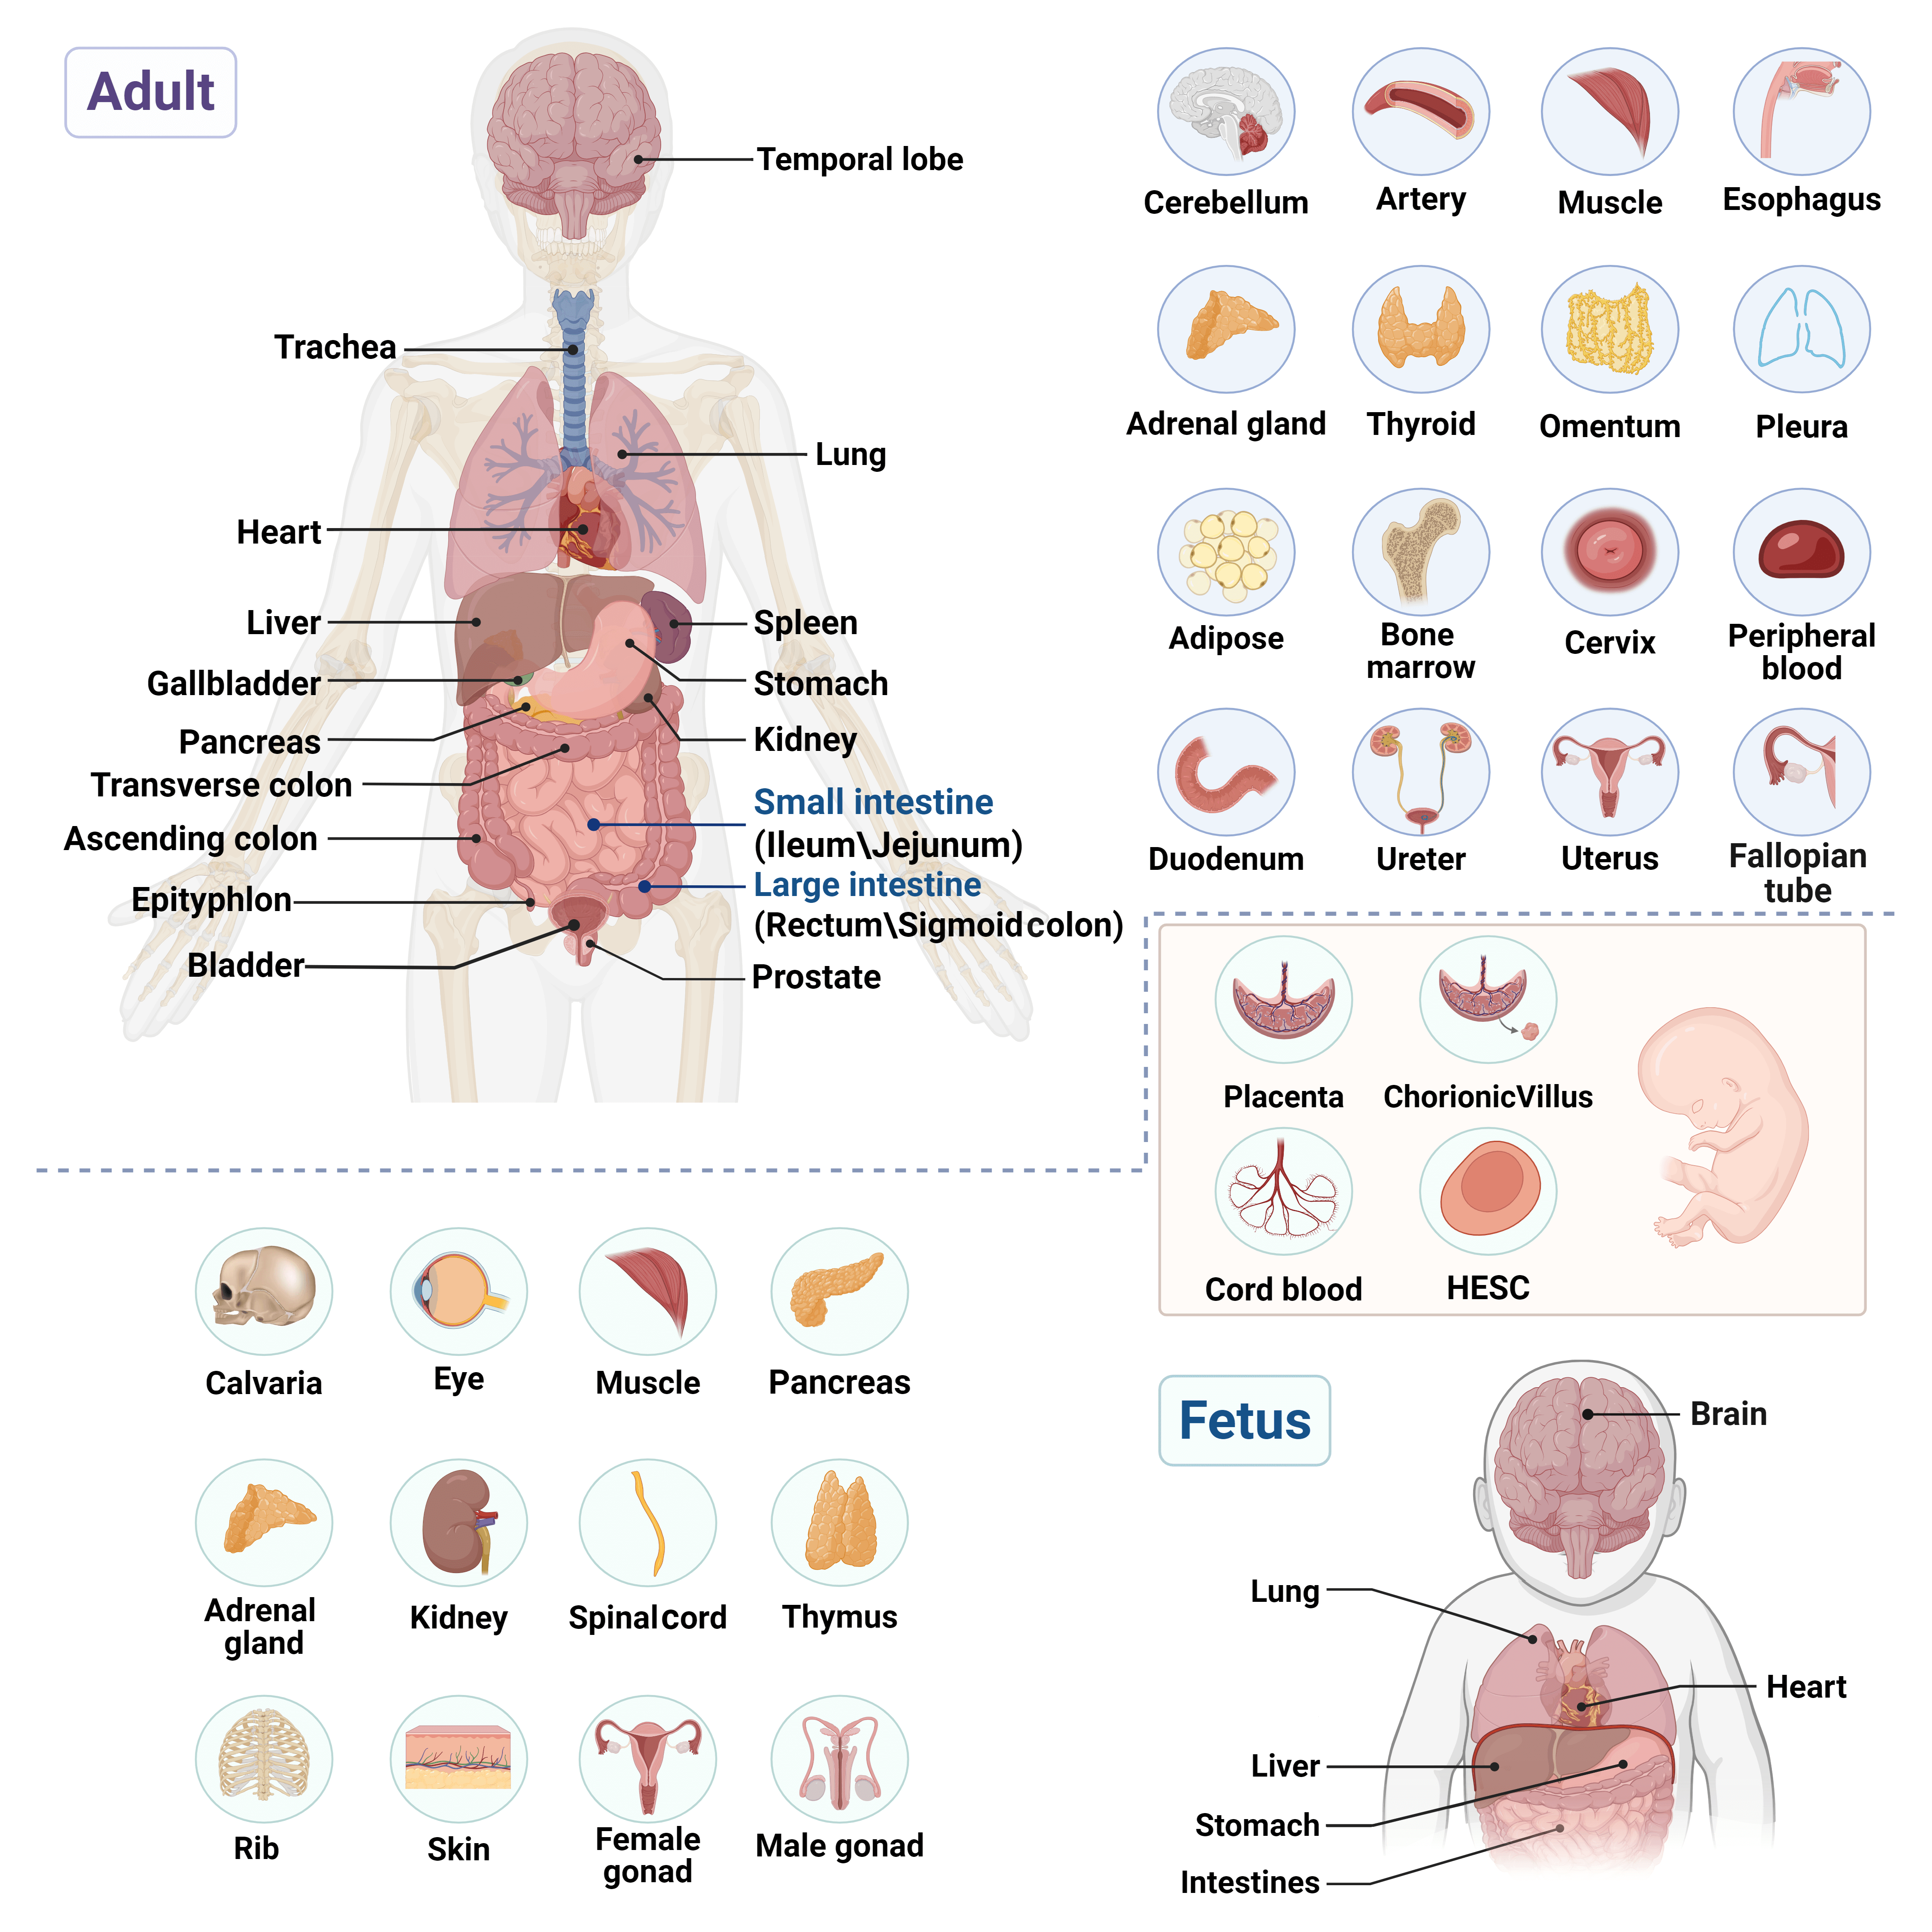
Human atlas from PMID:
32214235
The human dataset contains a total of 59 tissues (only 30 labels were shown by default). Please hover
over bubbles for details or zoom in to view all labels on the X-axis.
Expressed in Cells (%)
- 100
- 0

Step 2b: Gene Sets Score of Crab-eating Macaque Atlas
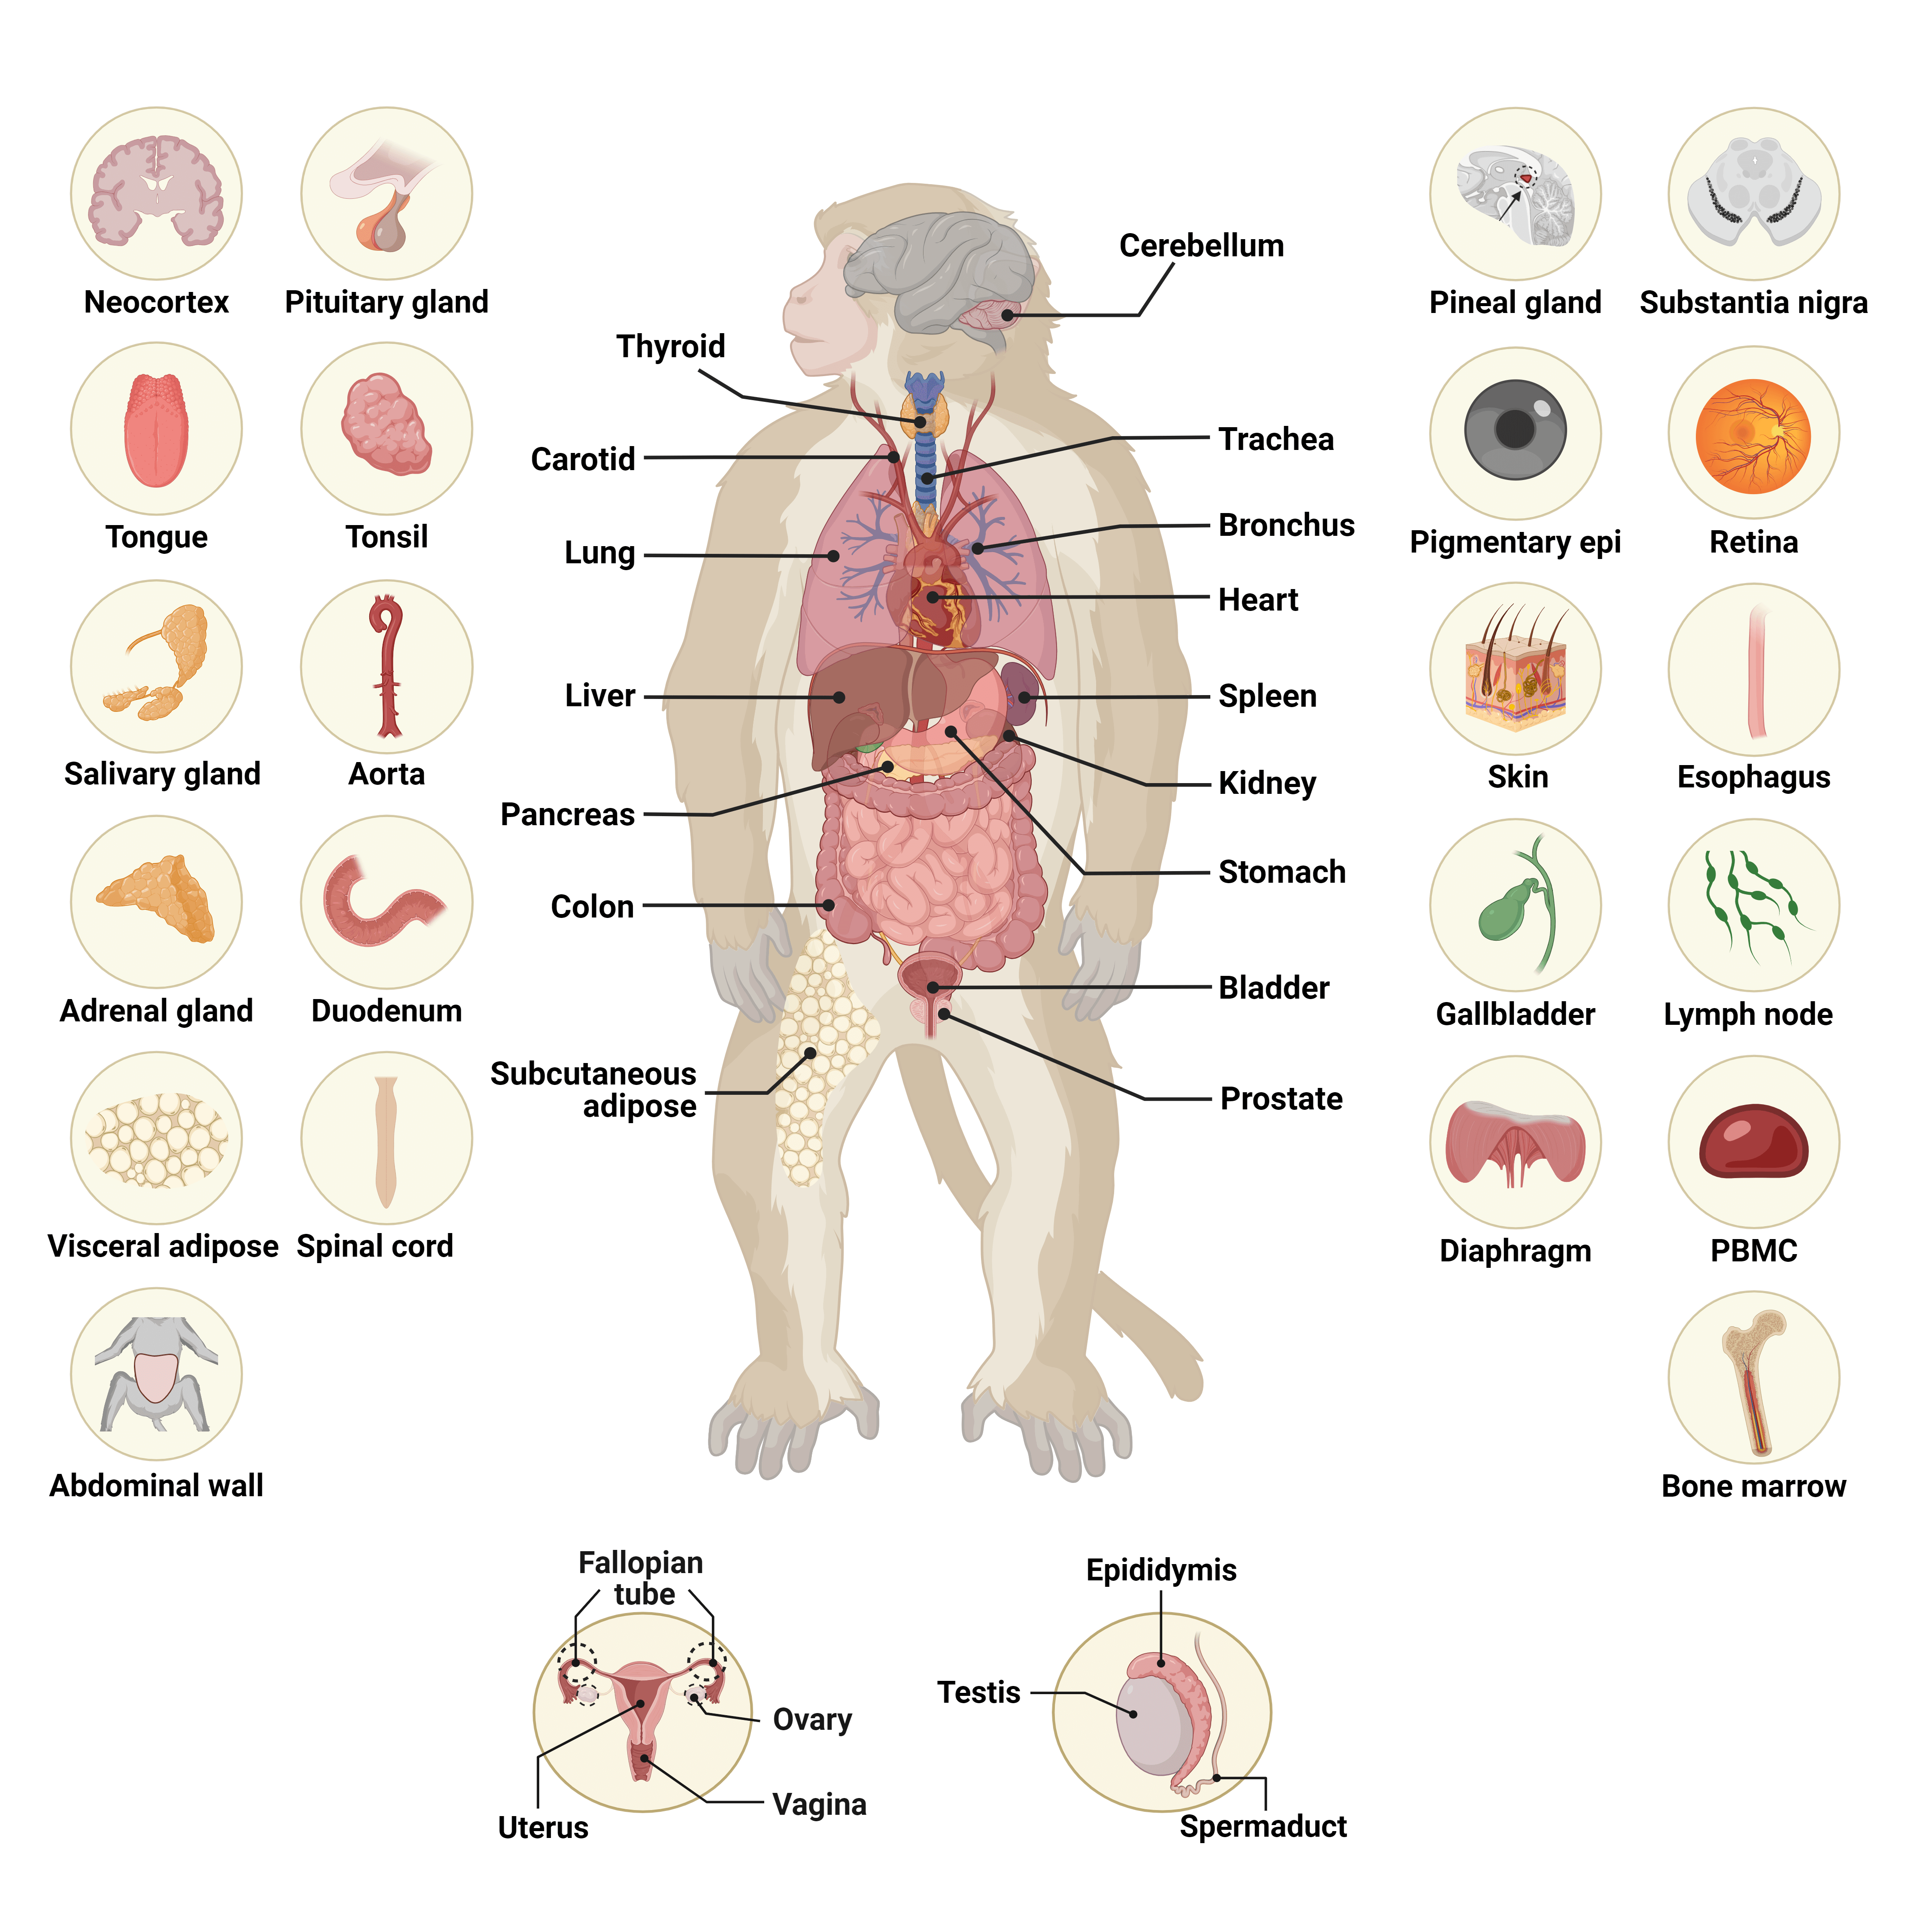
Crab-eating macaque atlas from PMID: 35418686
Expressed in Cells (%)
- 100
- 0
Step 2c: Gene Sets Score of Gray Mouse Lemur Atlas
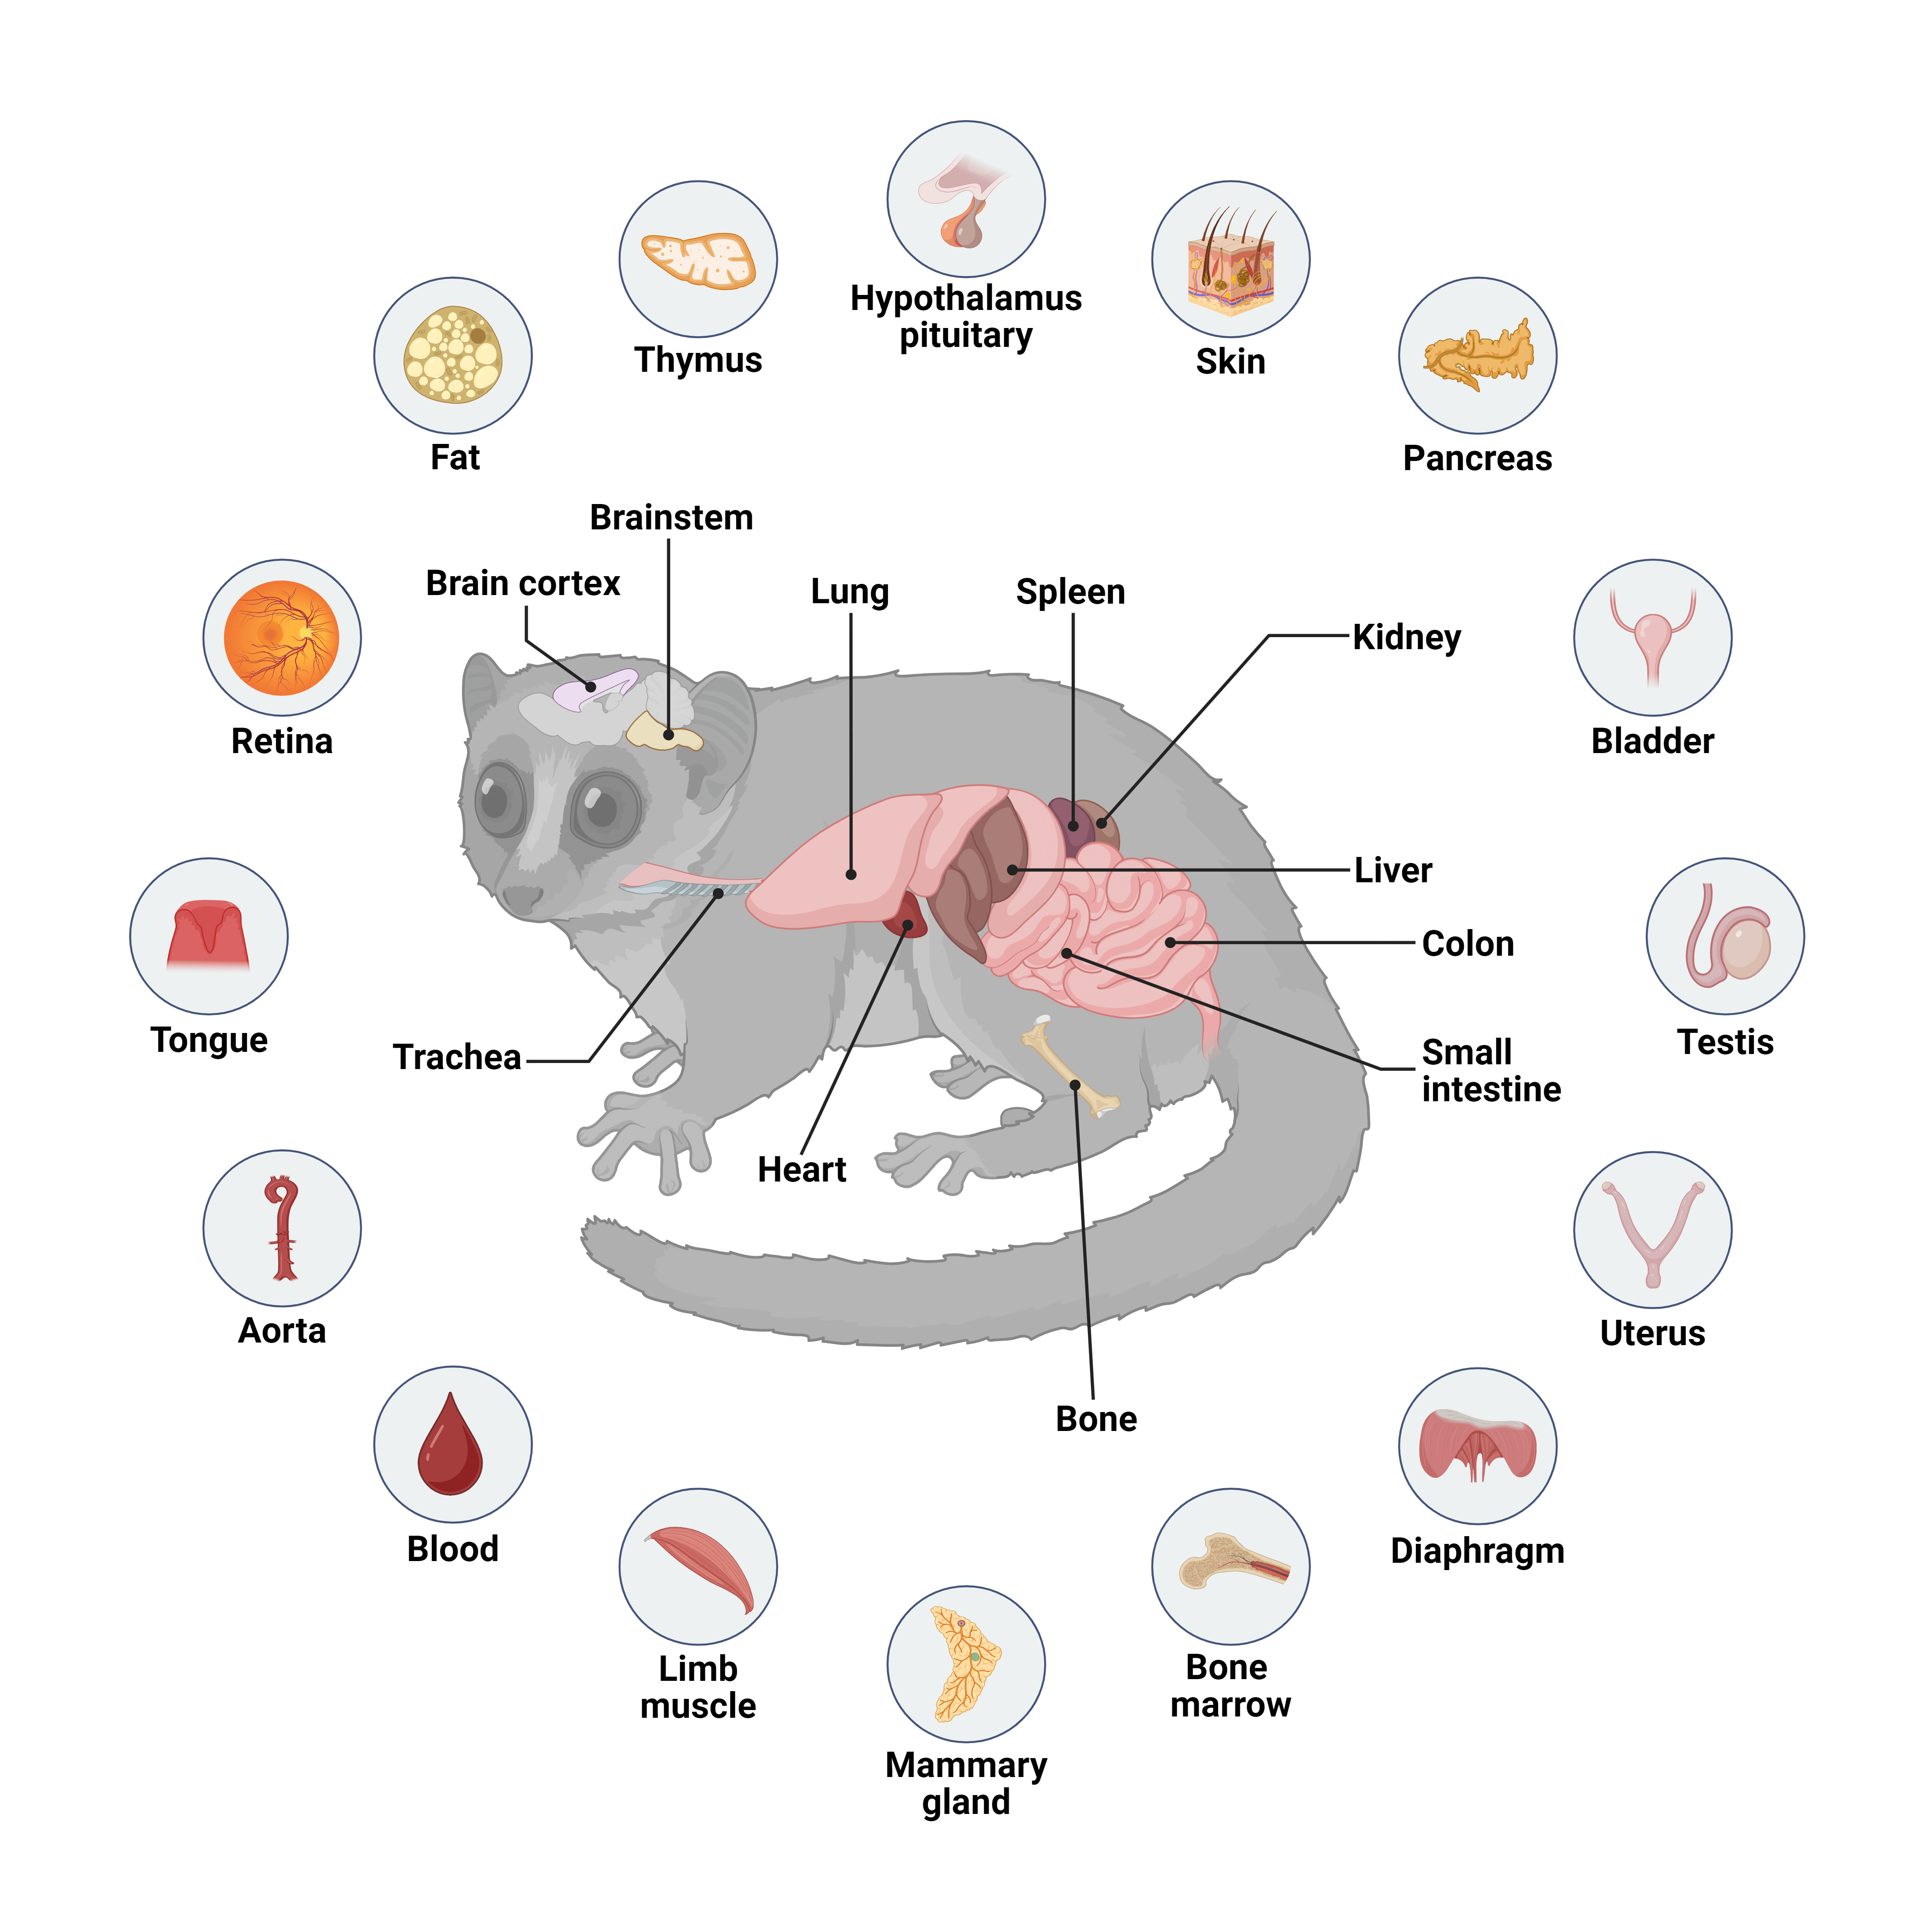
Gray mouse lemur atlas from PMID: 40739356
Expressed in Cells (%)
- 100
- 0
Step 2d: Gene Sets Score of Mouse Atlas
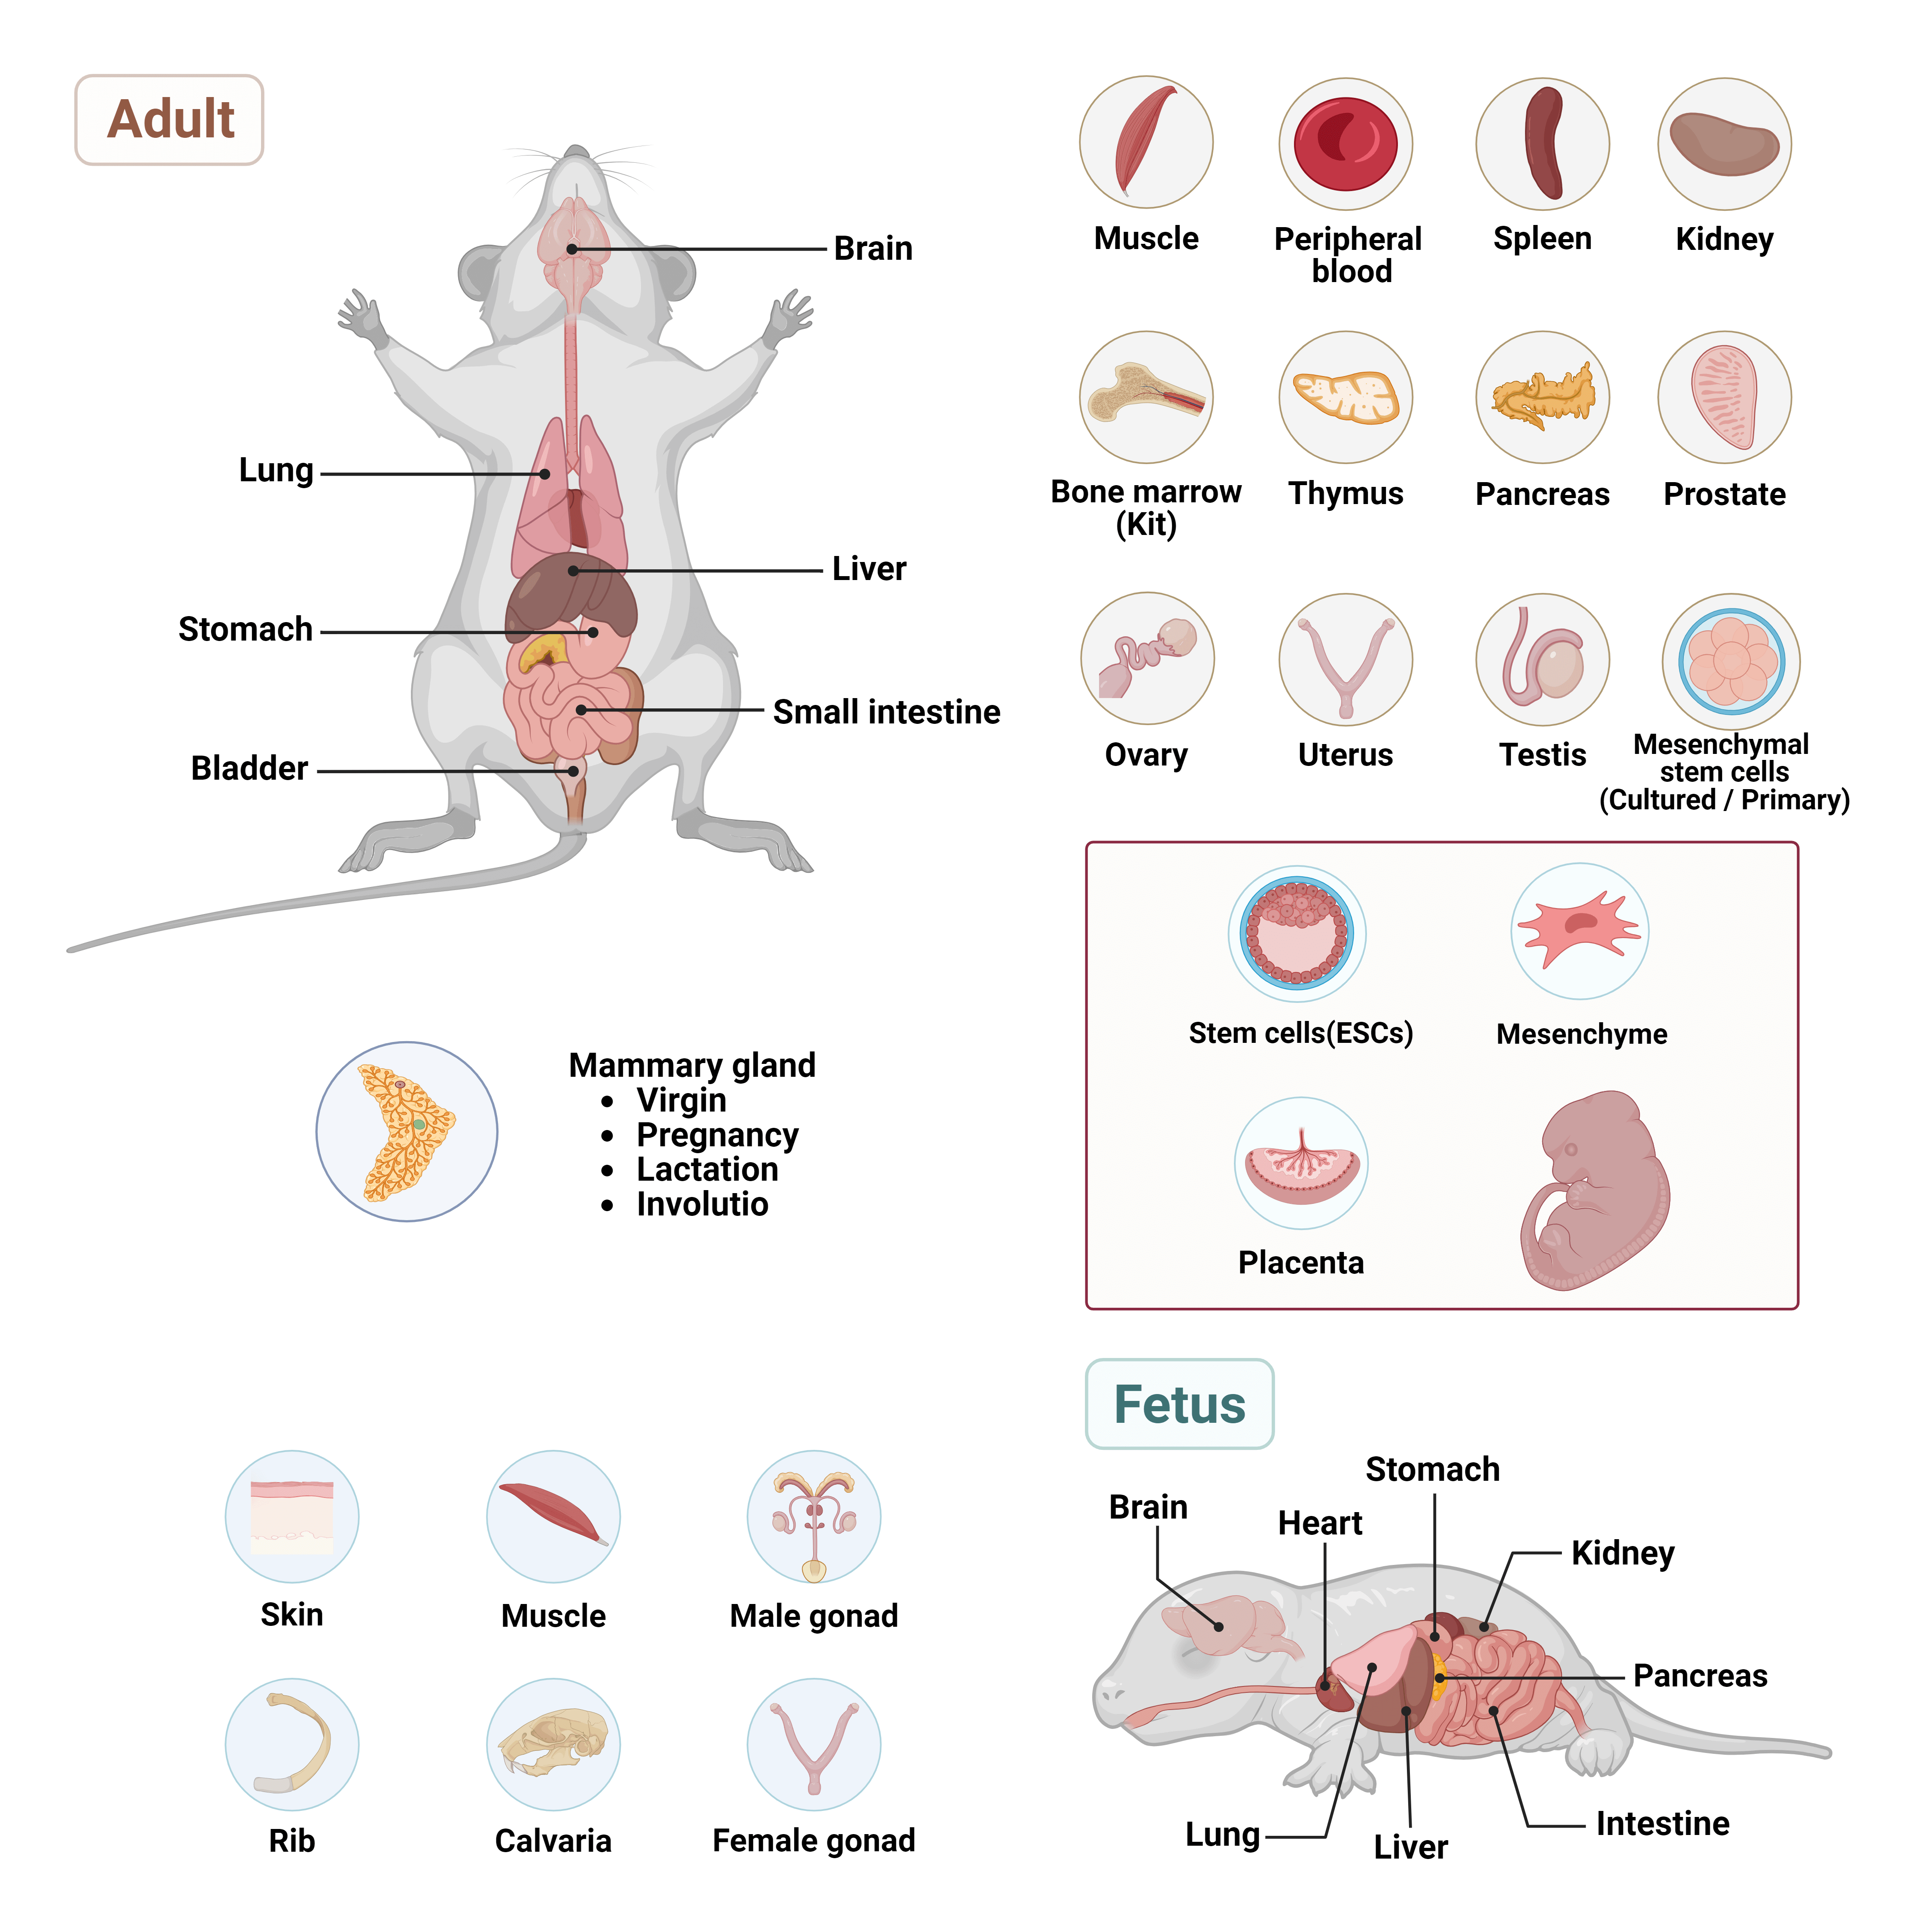
Mouse atlas from PMID: 29474909
Expressed in Cells (%)
- 100
- 0
Step 2e: Gene Sets Score of Pig Atlas
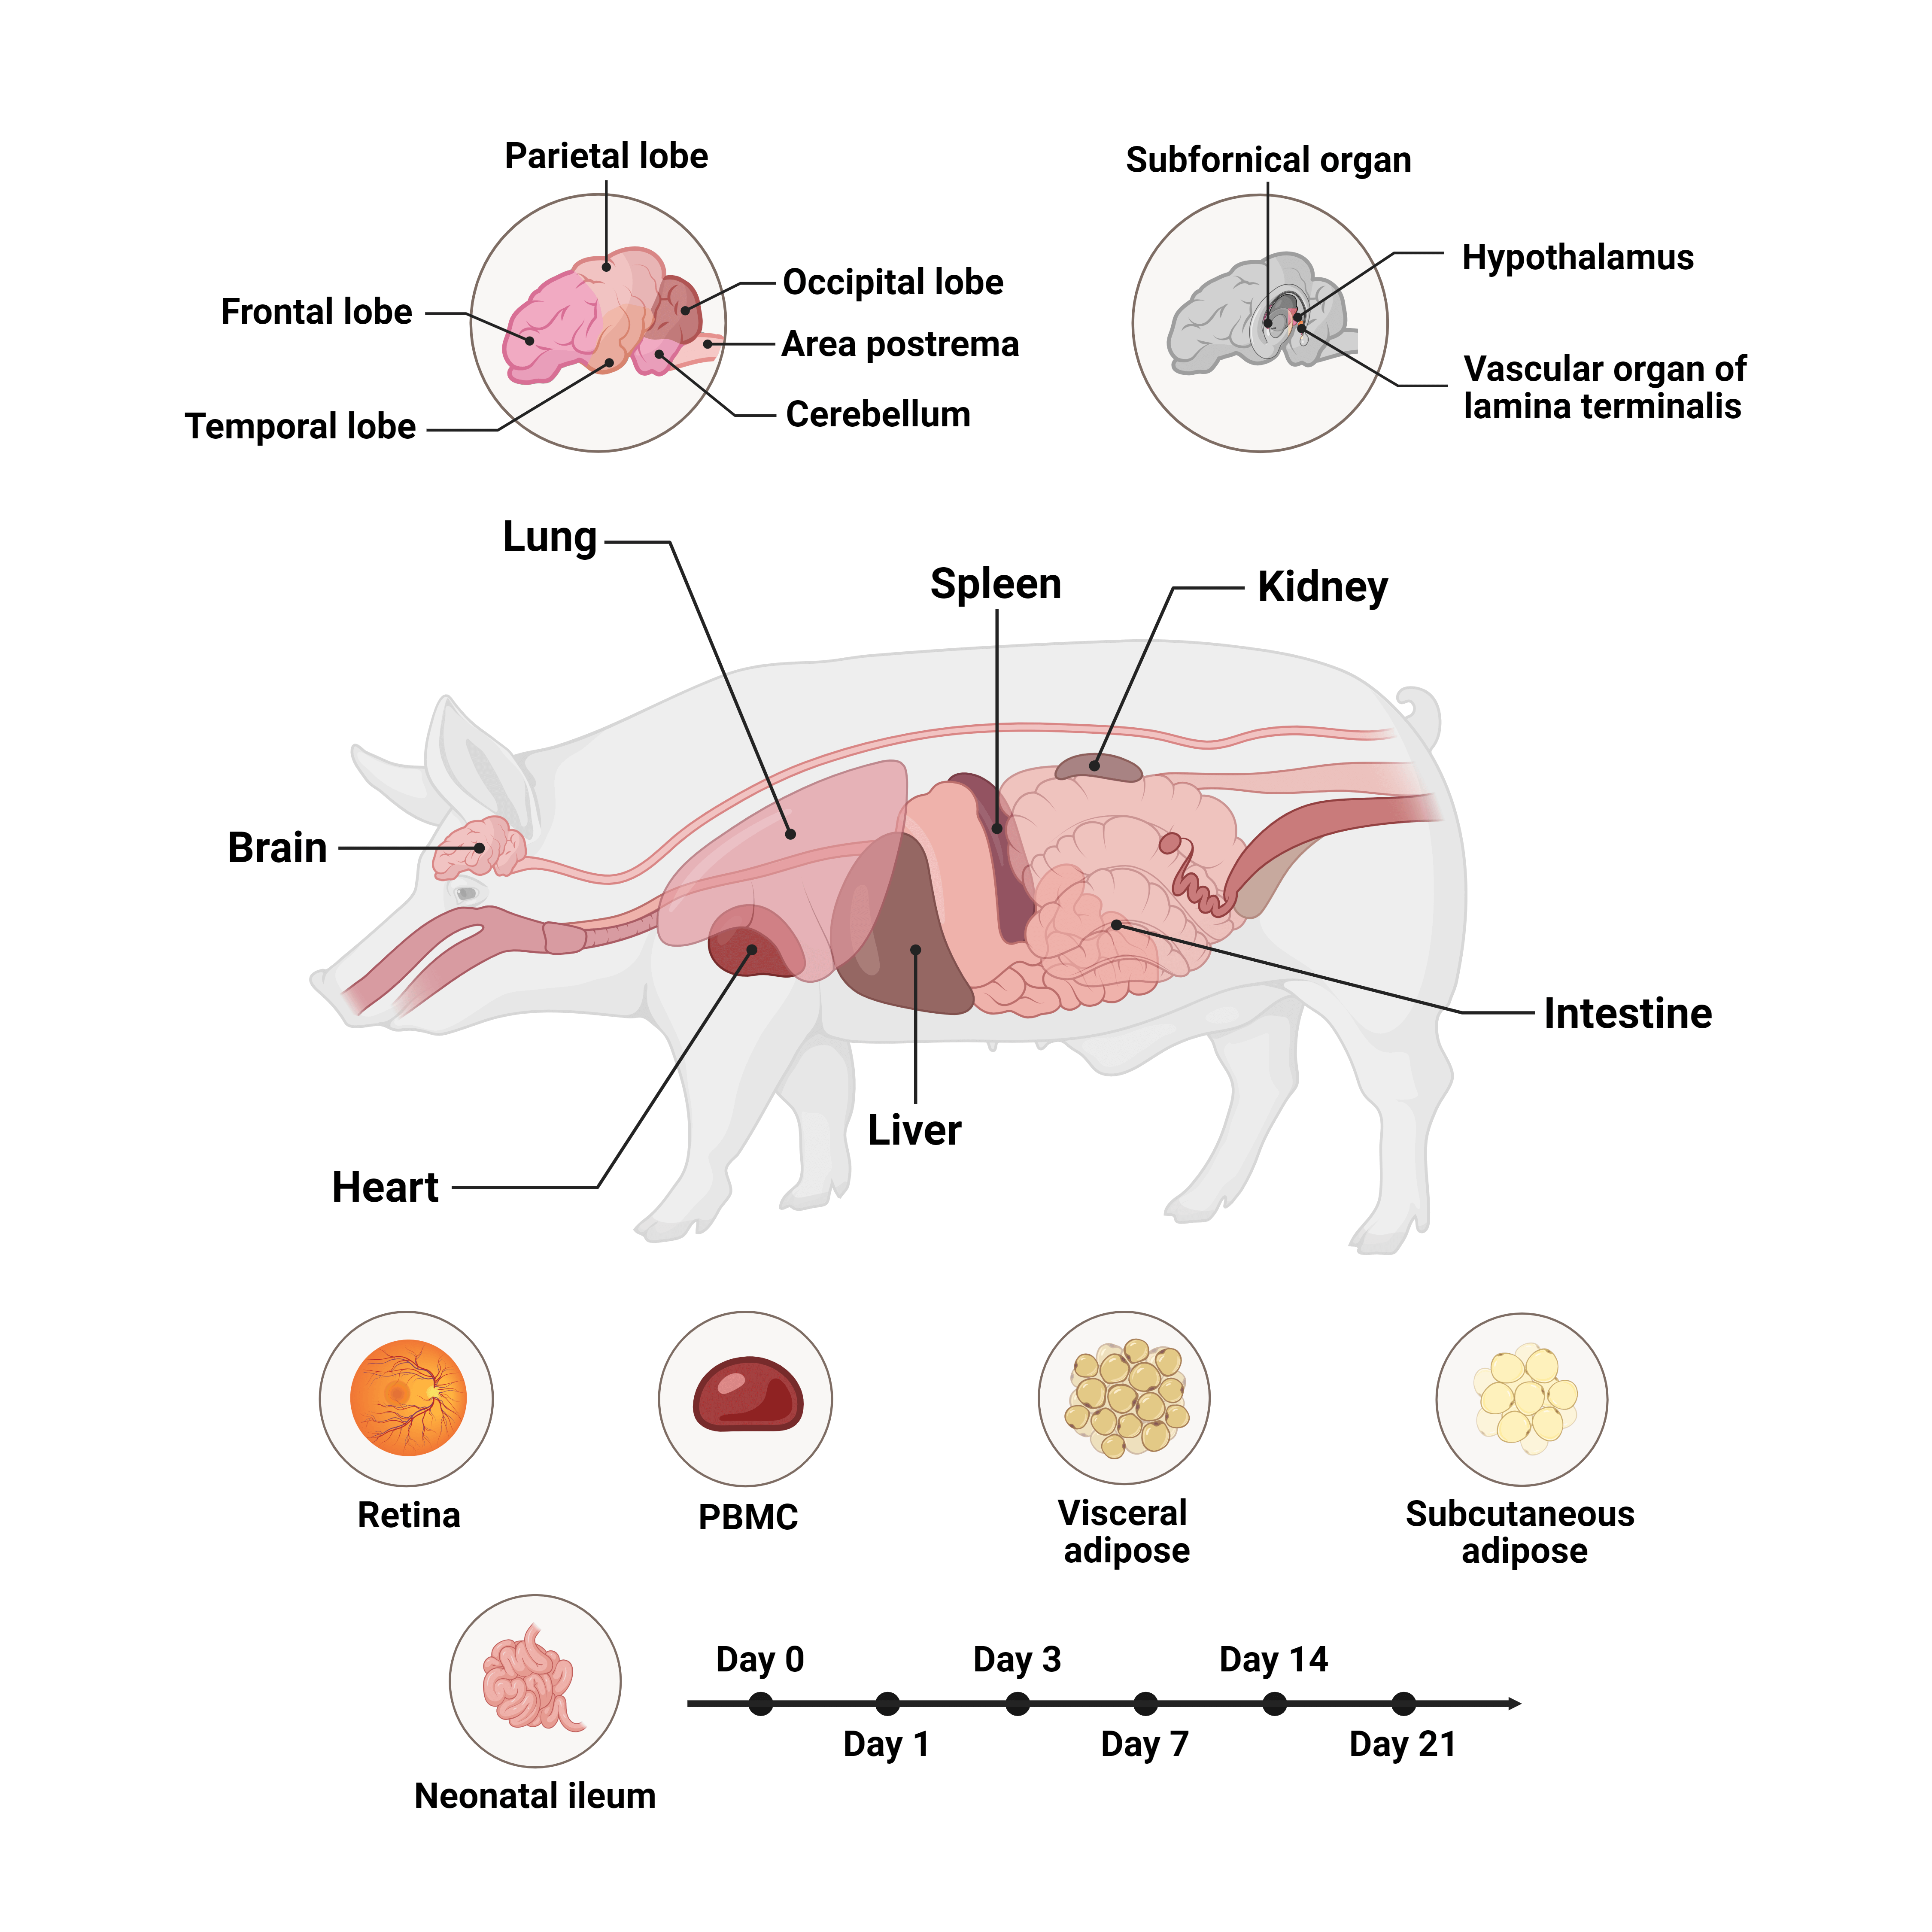
Pig atlas from PMID:
35750885
Expressed in Cells (%)
- 100
- 0
Step 2f: Gene Sets Score of Cattle Atlas
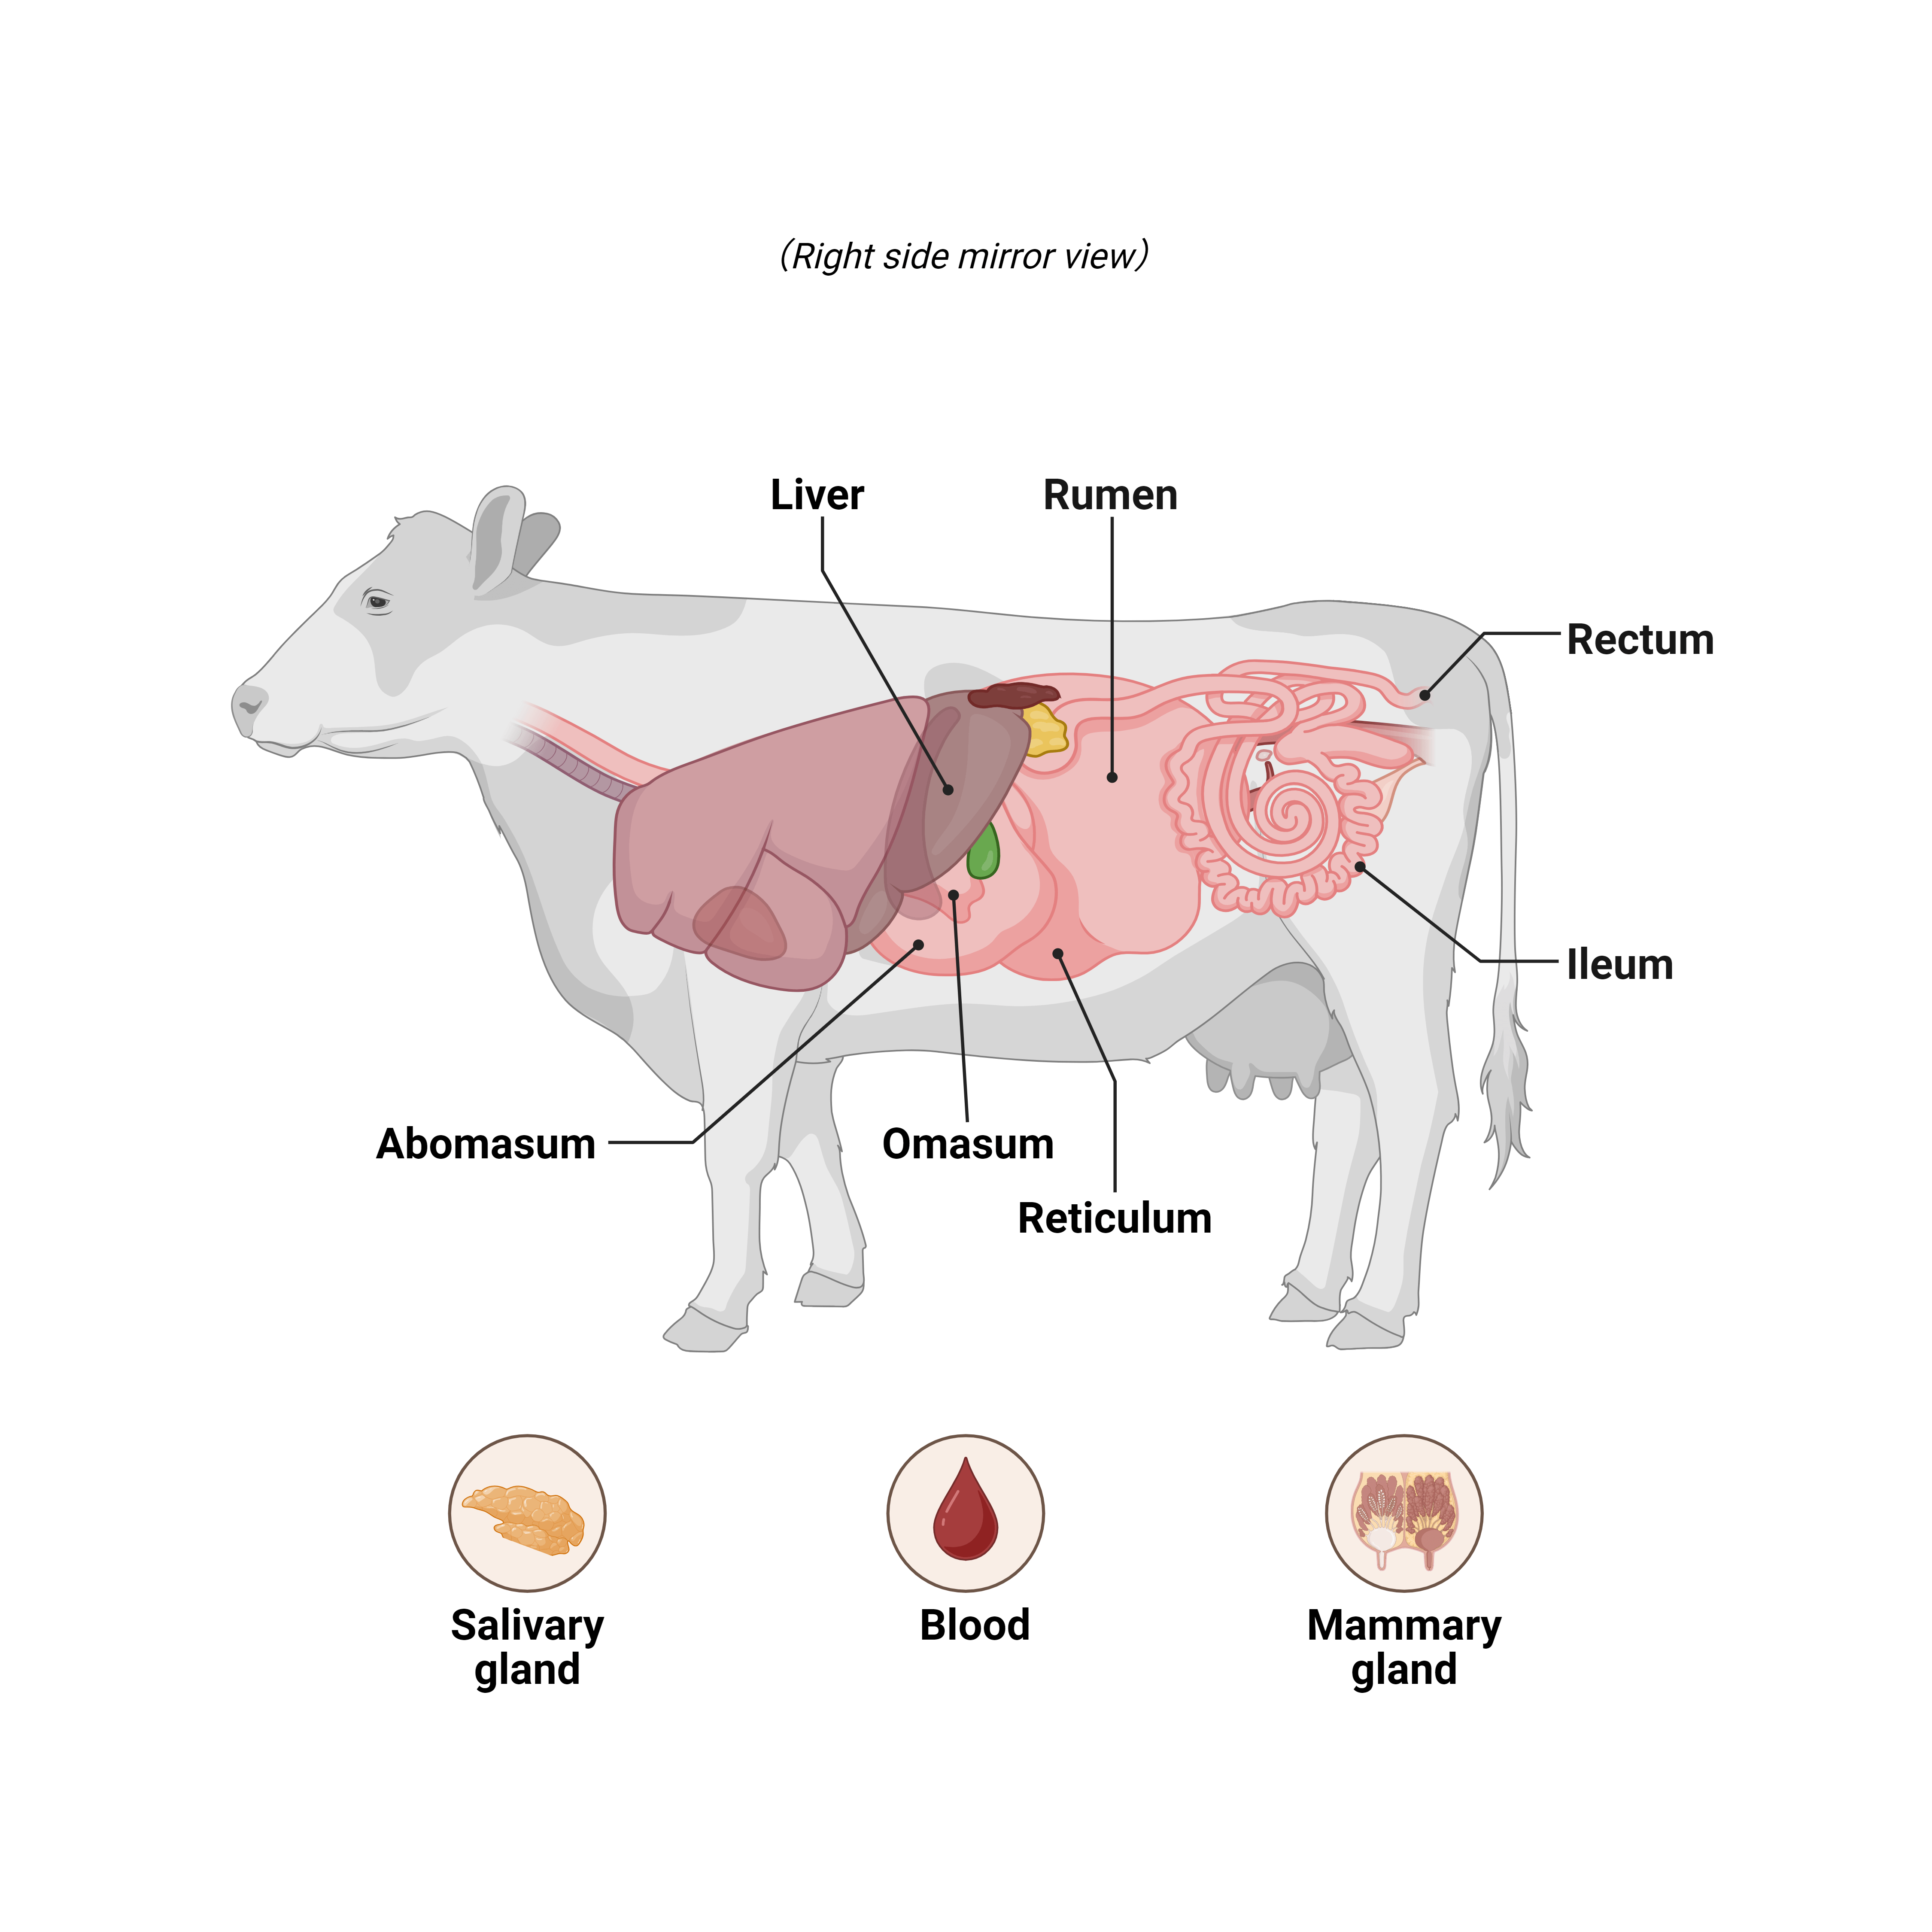
Cattle atlas from PMID: 35499046
Expressed in Cells (%)
- 100
- 0
Step 2g: Gene Sets Score of Donkey Atlas
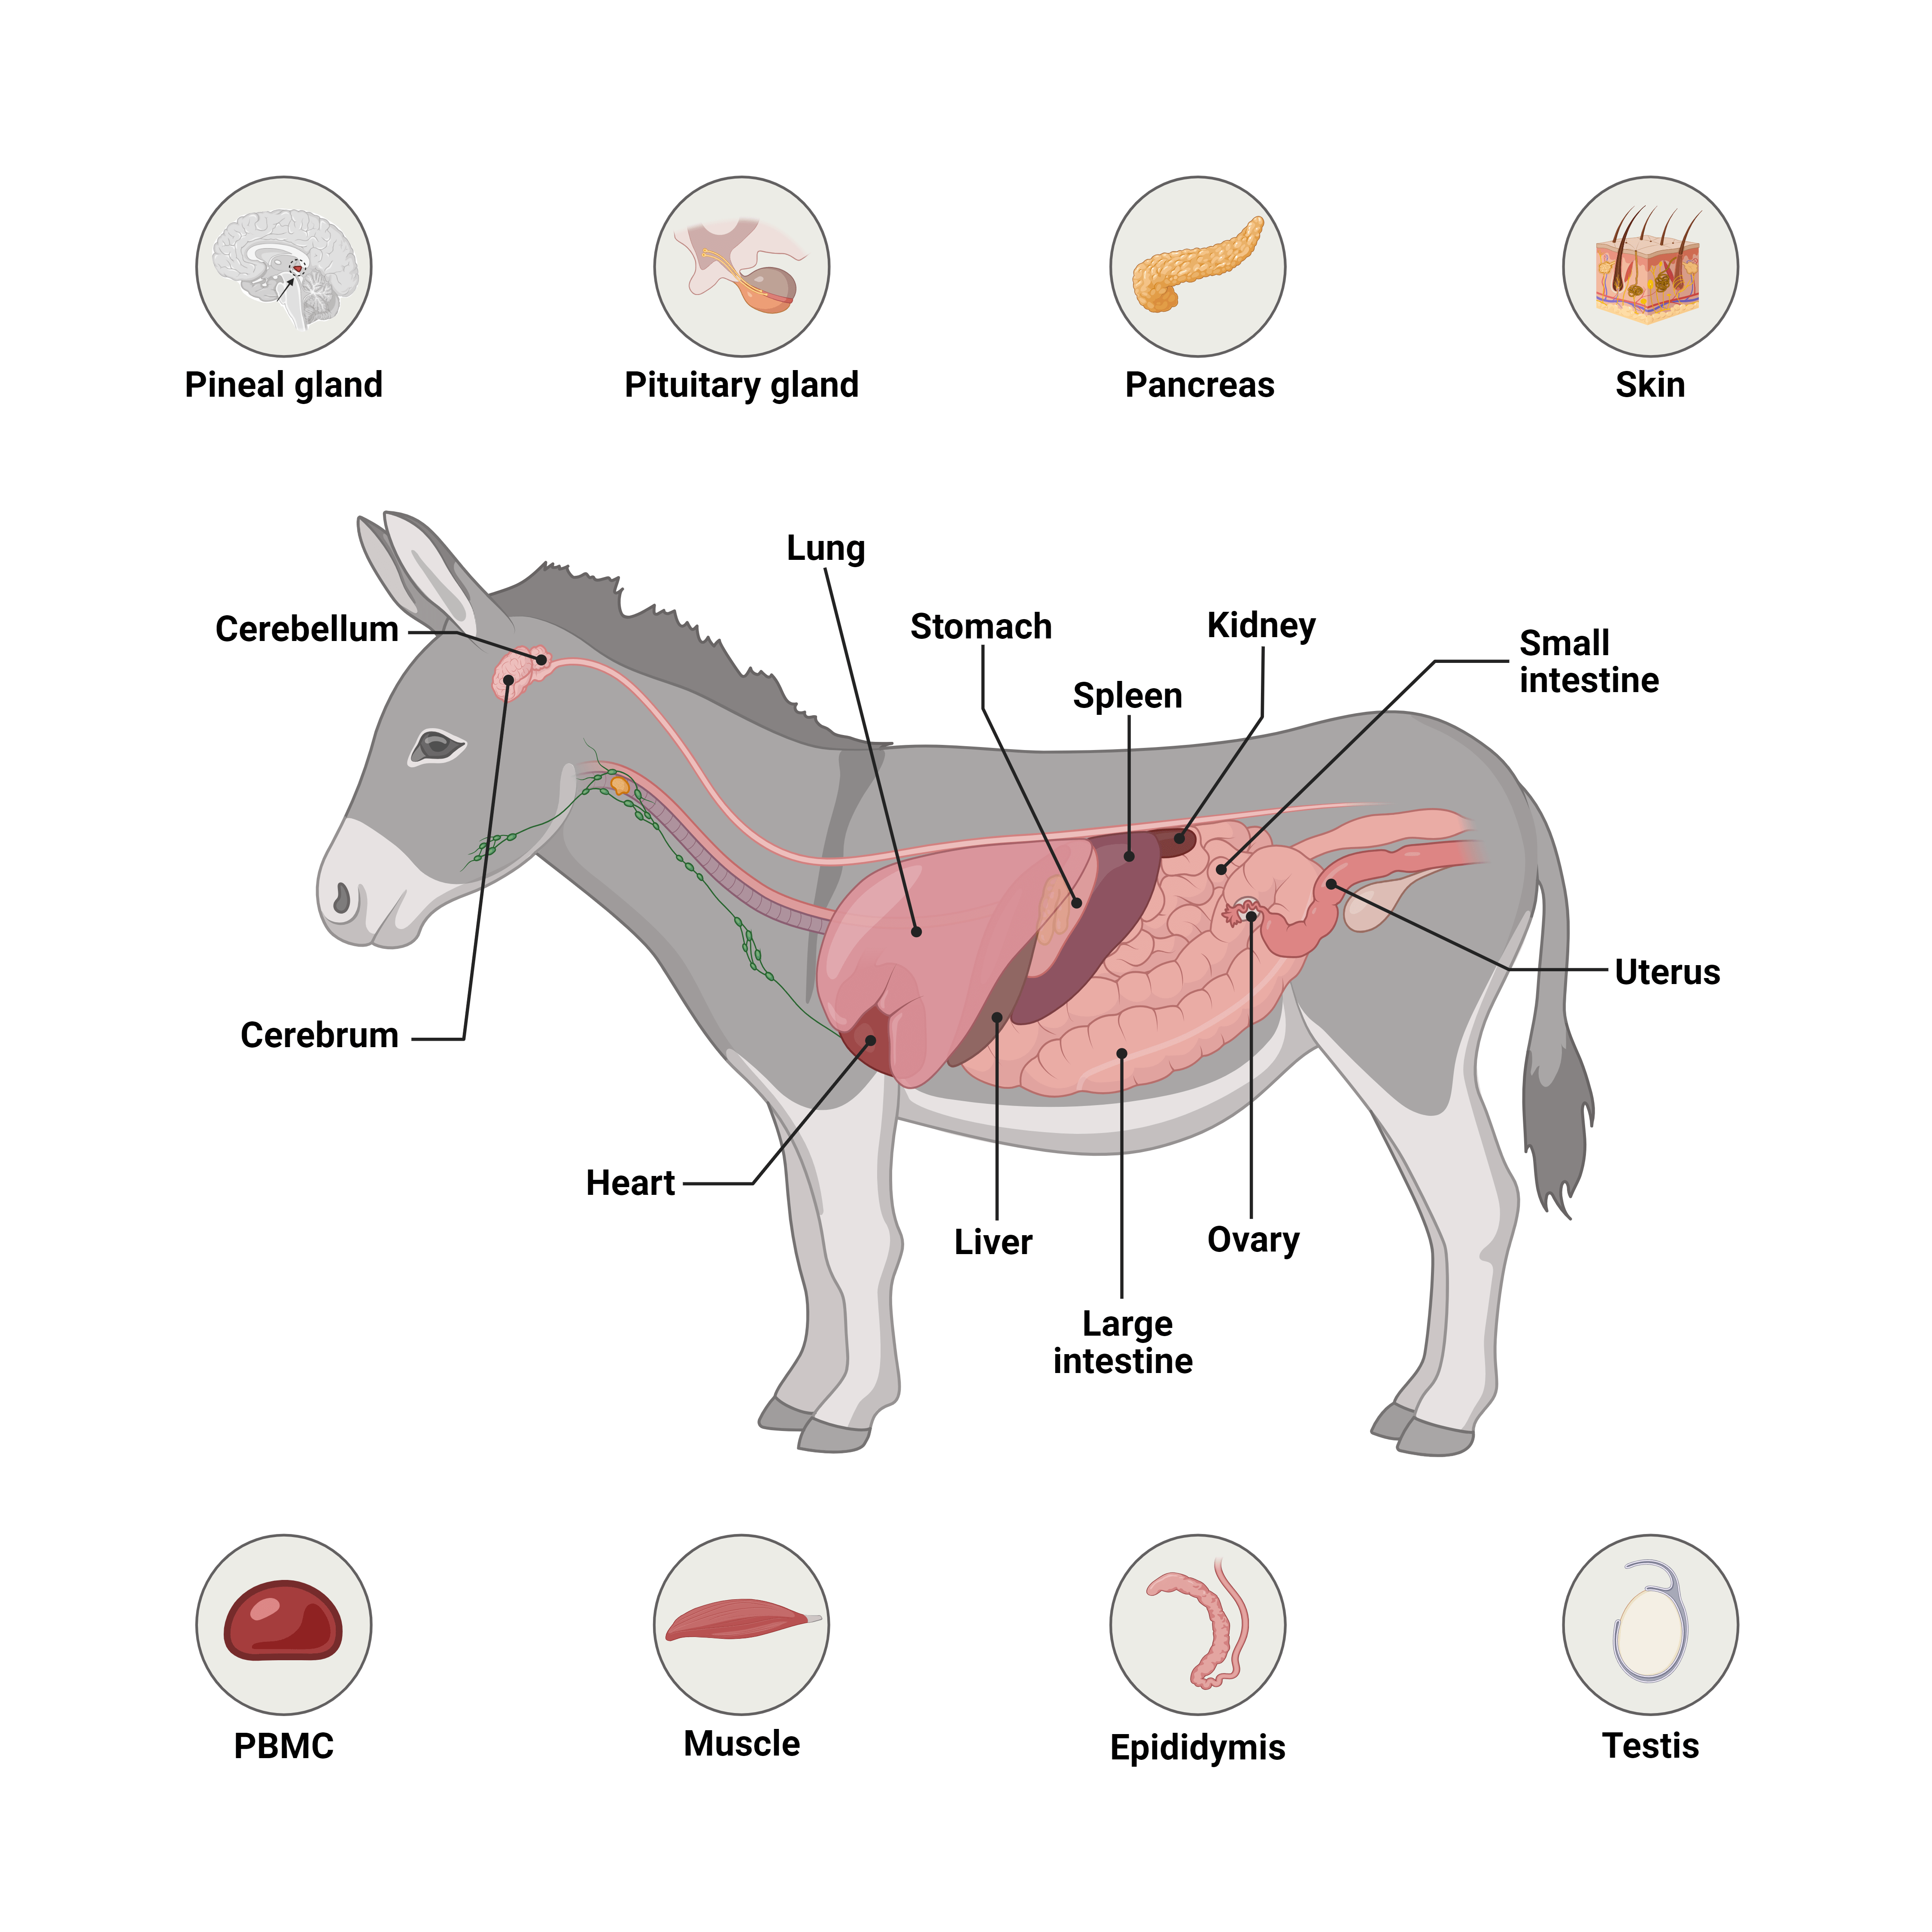
Donkey atlas from PMID: 40013957
Expressed in Cells (%)
- 100
- 0
Step 2h: Gene Sets Score of Tiger Atlas
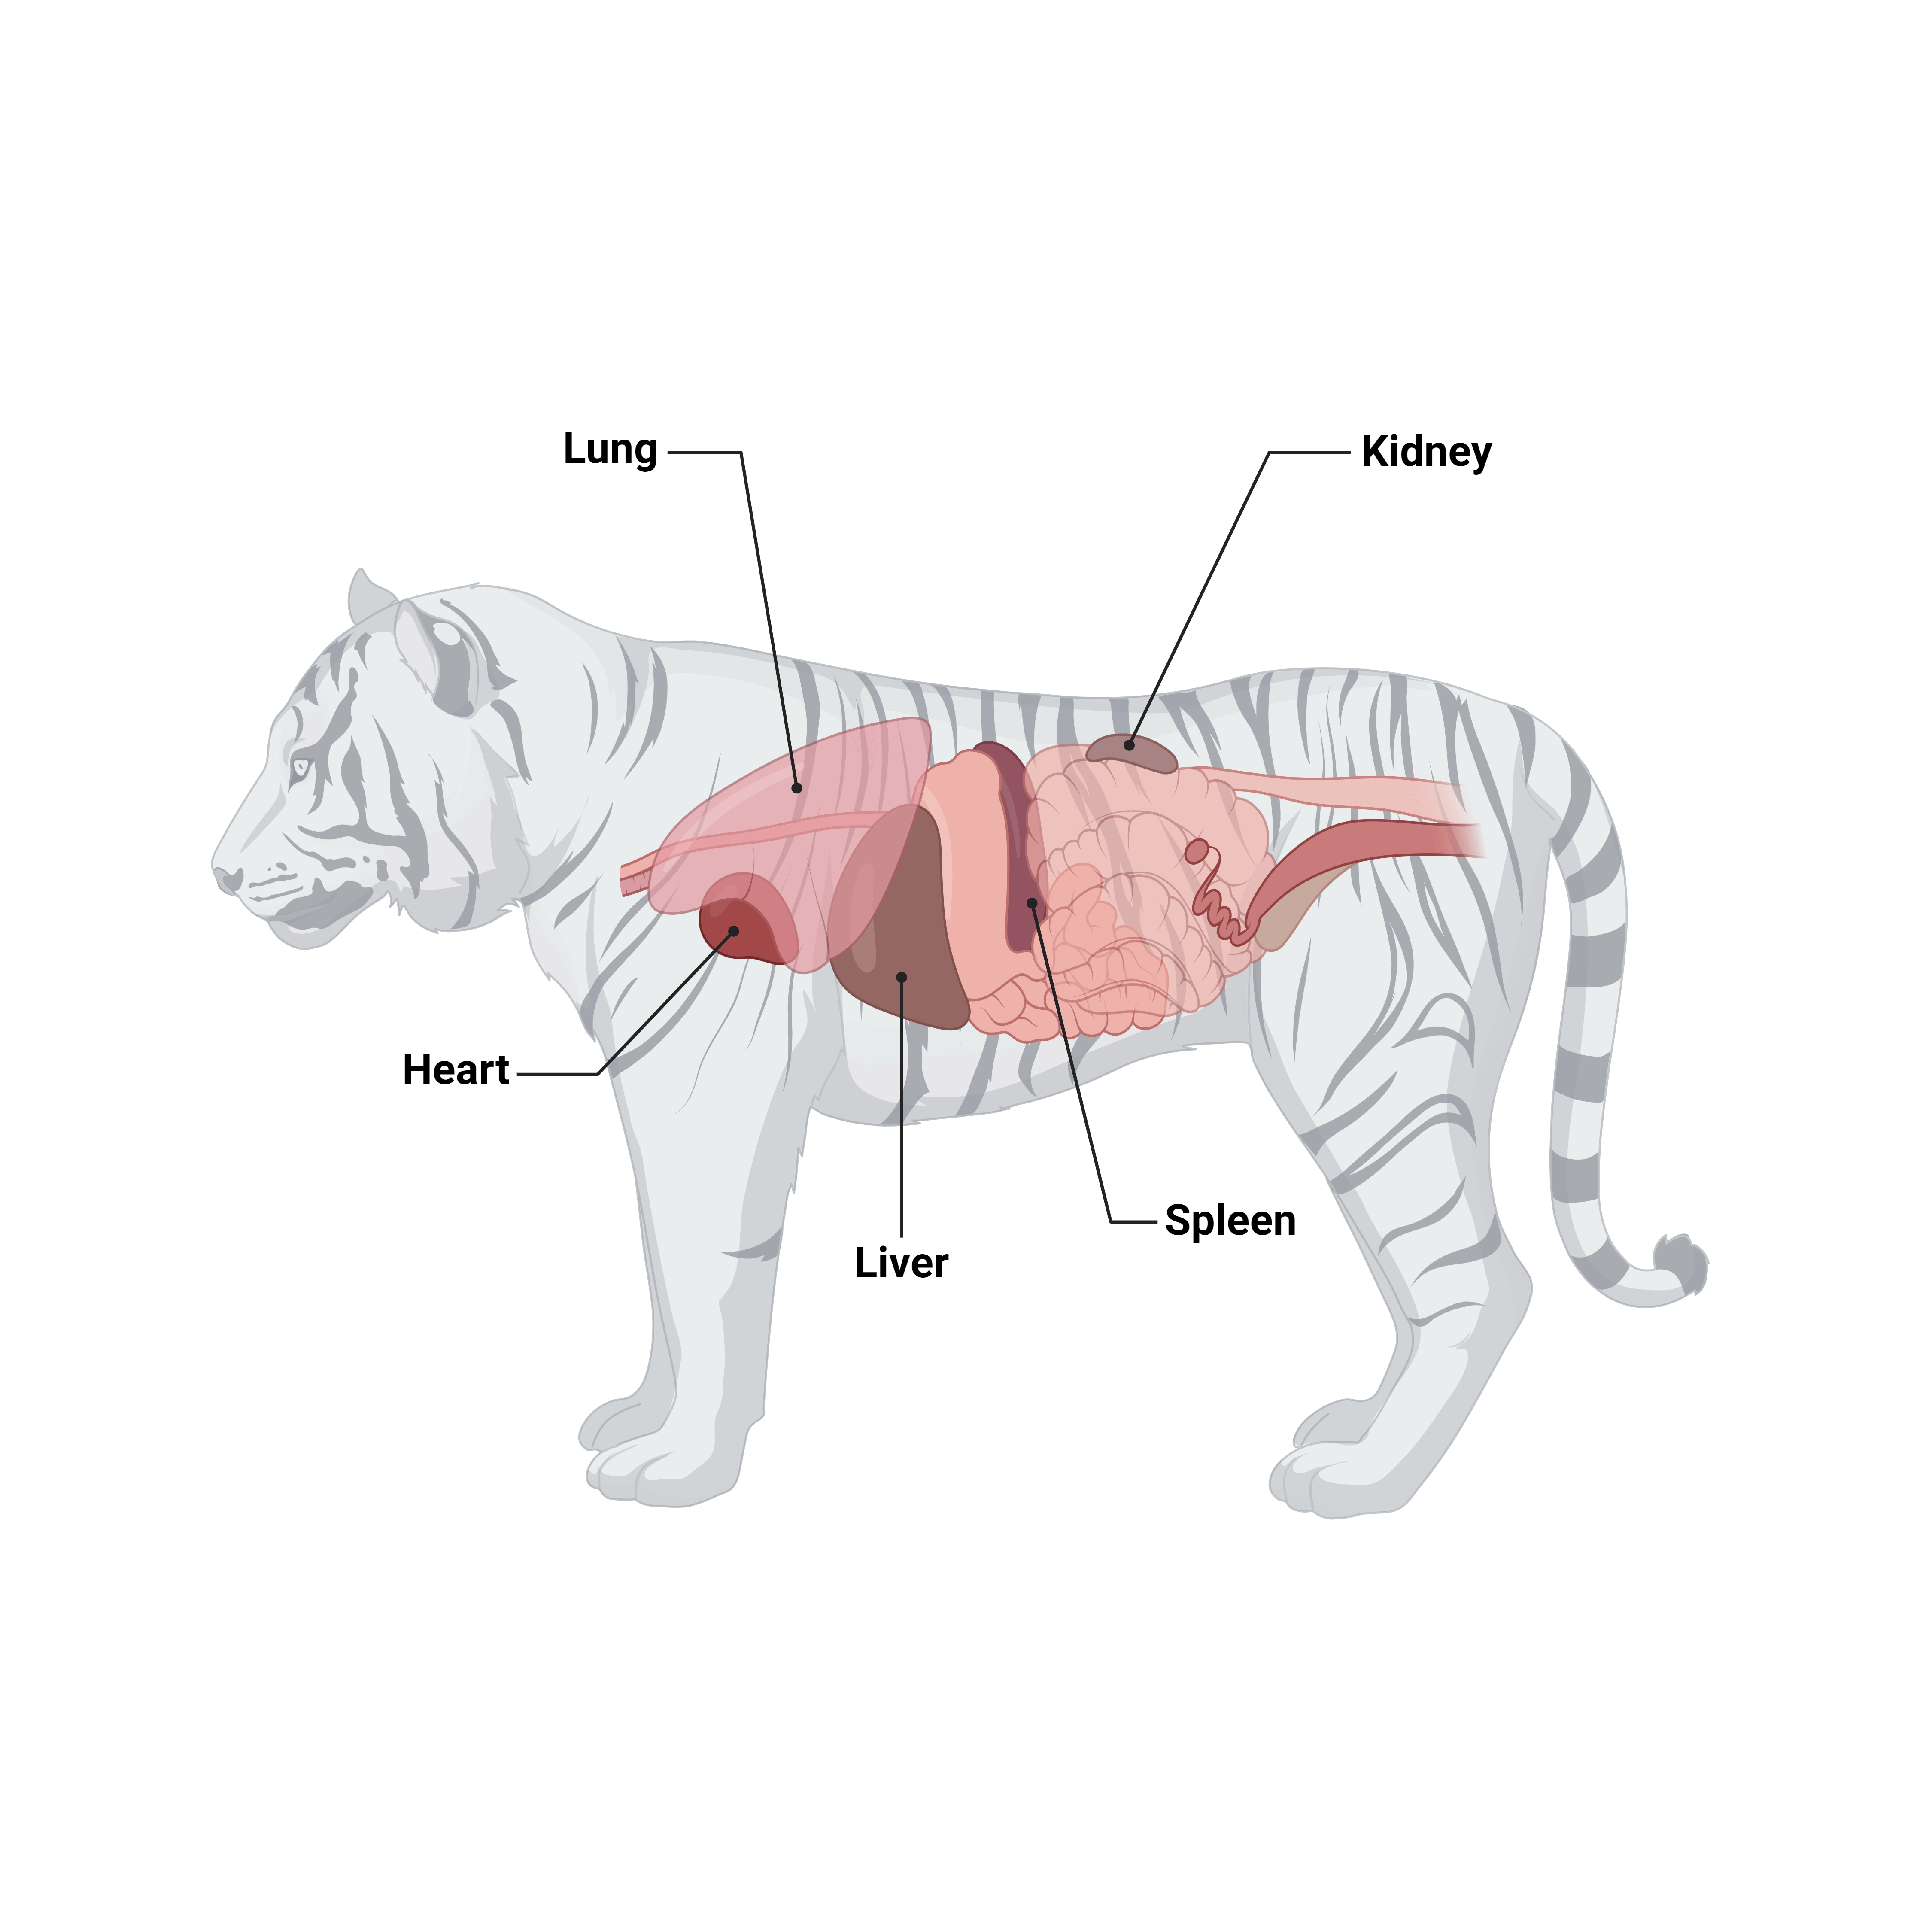
Tiger atlas from PMID:
34873160
Expressed in Cells (%)
- 100
- 0
Step 2i: Gene Sets Score of Cat Atlas
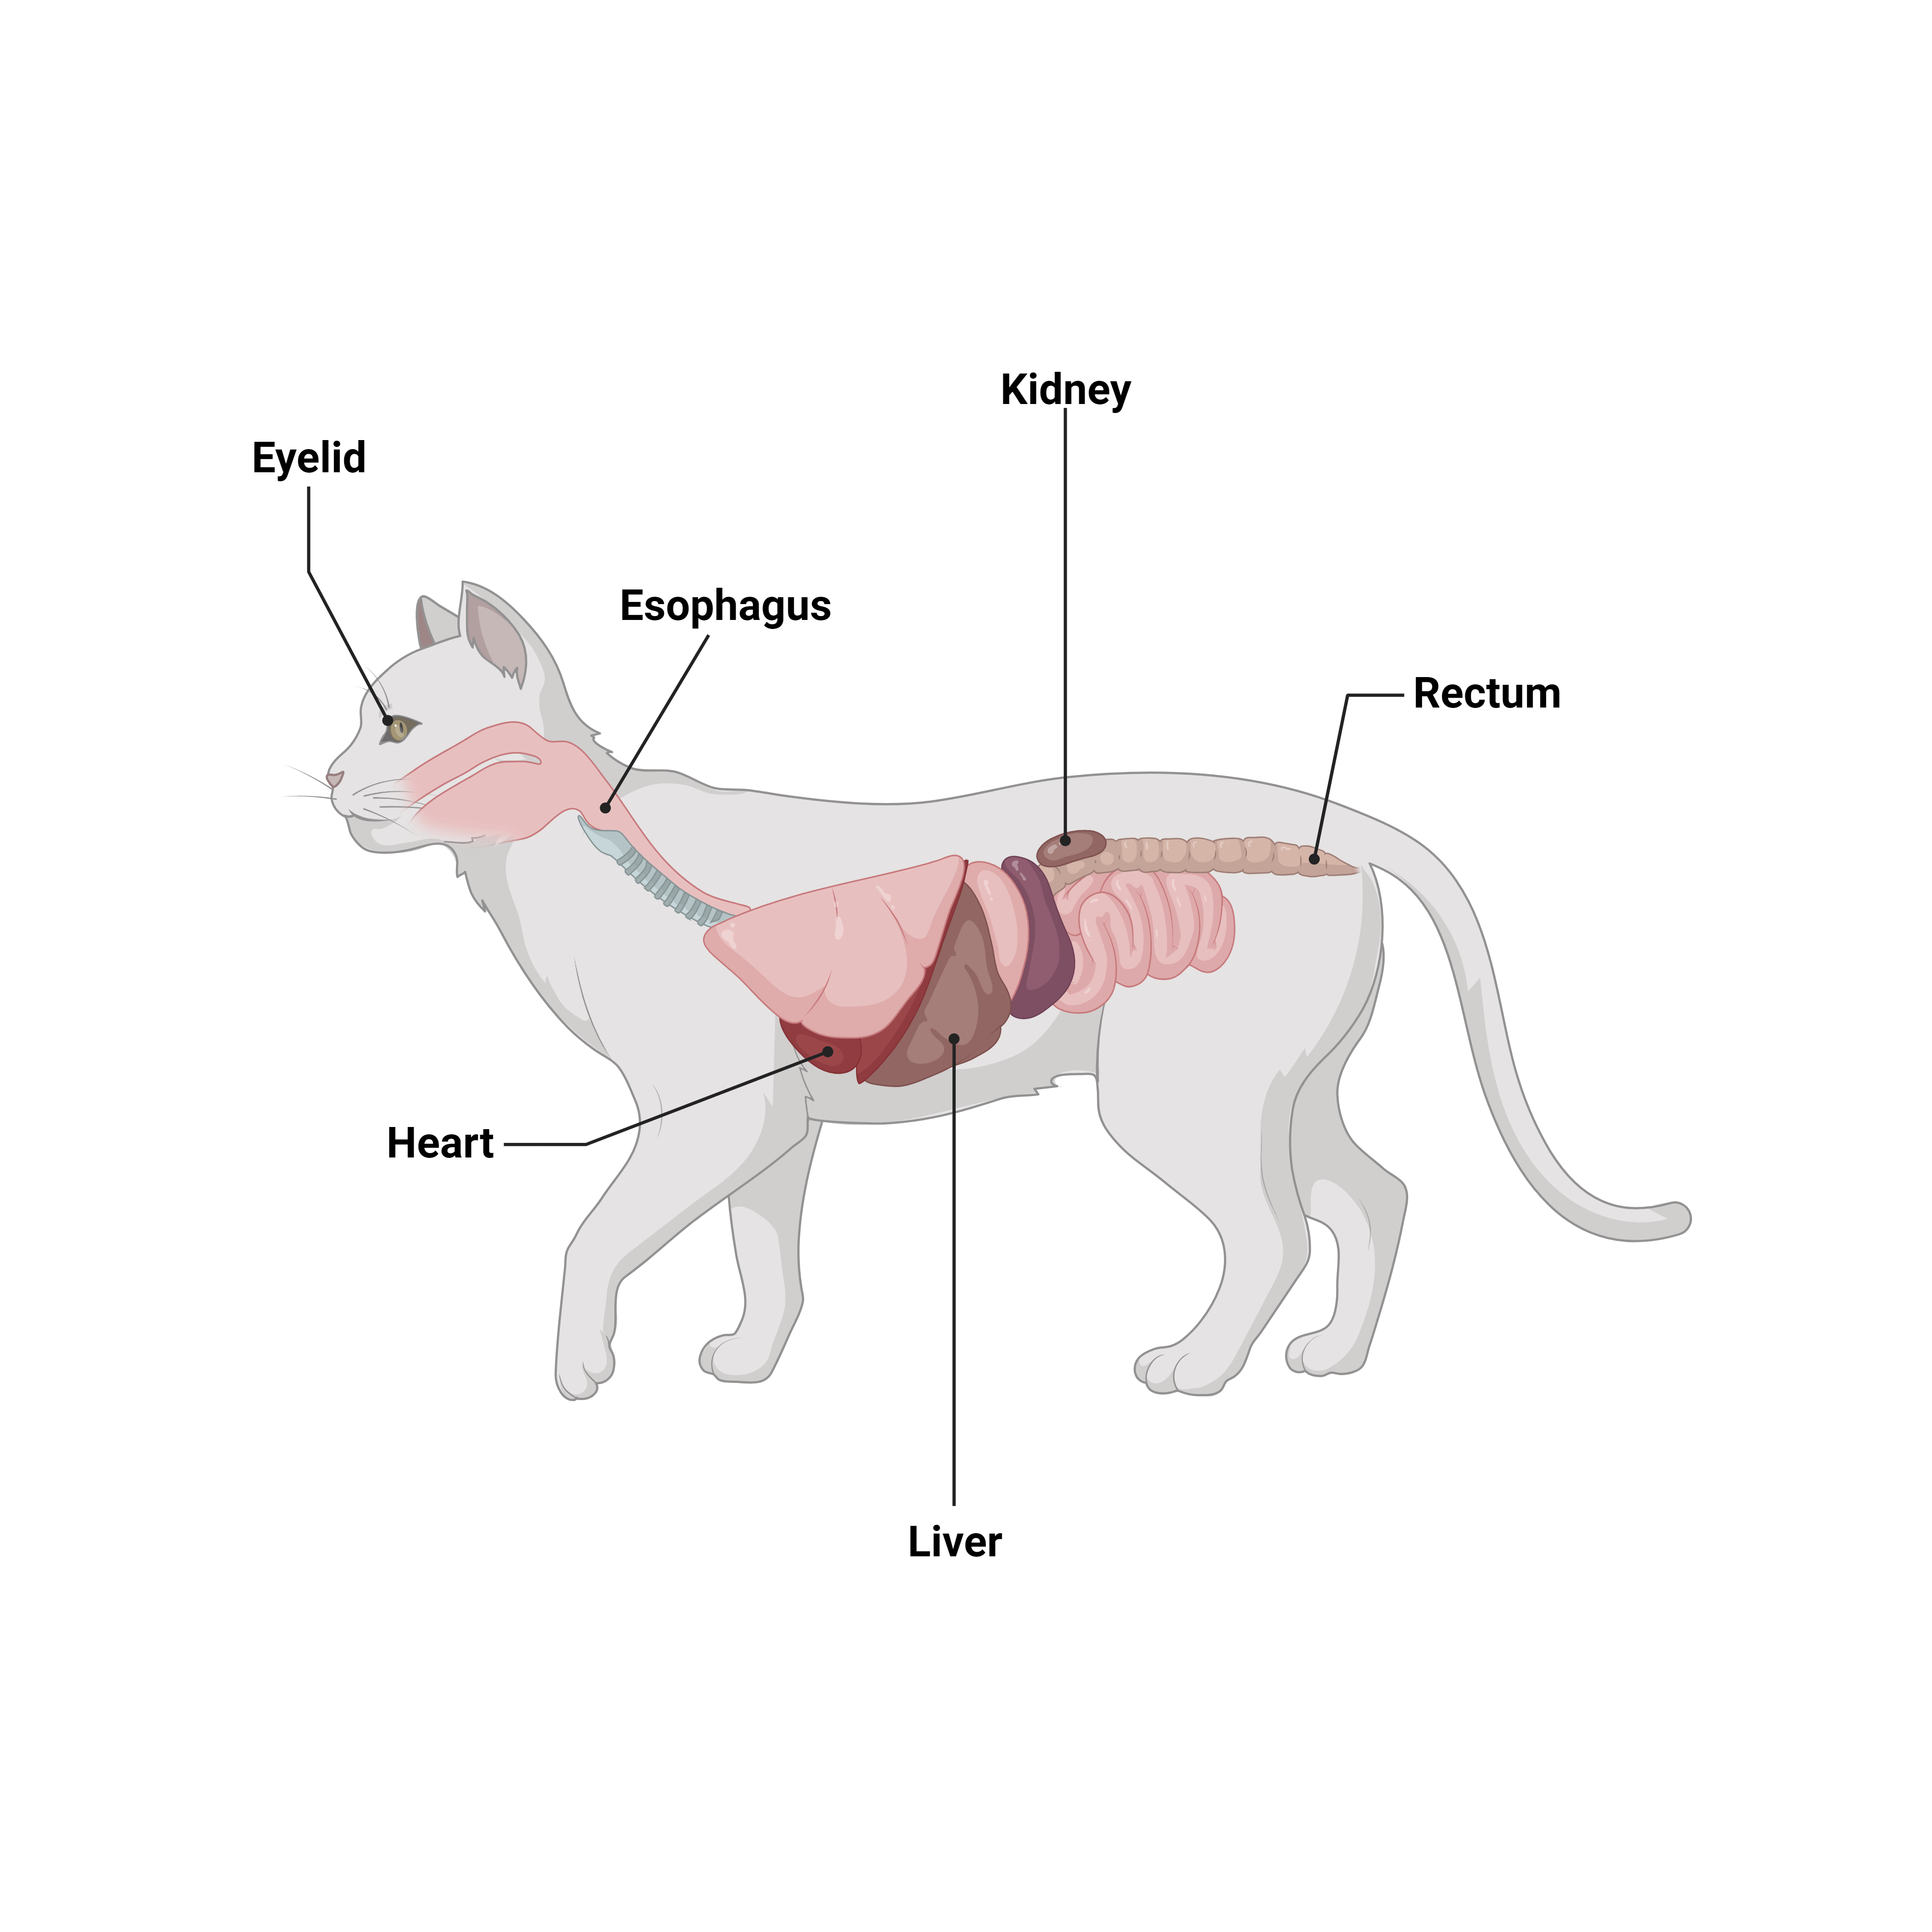
Cat atlas from PMID:
34873160
Expressed in Cells (%)
- 100
- 0
Step 2j: Gene Sets Score of Pangolin Atlas
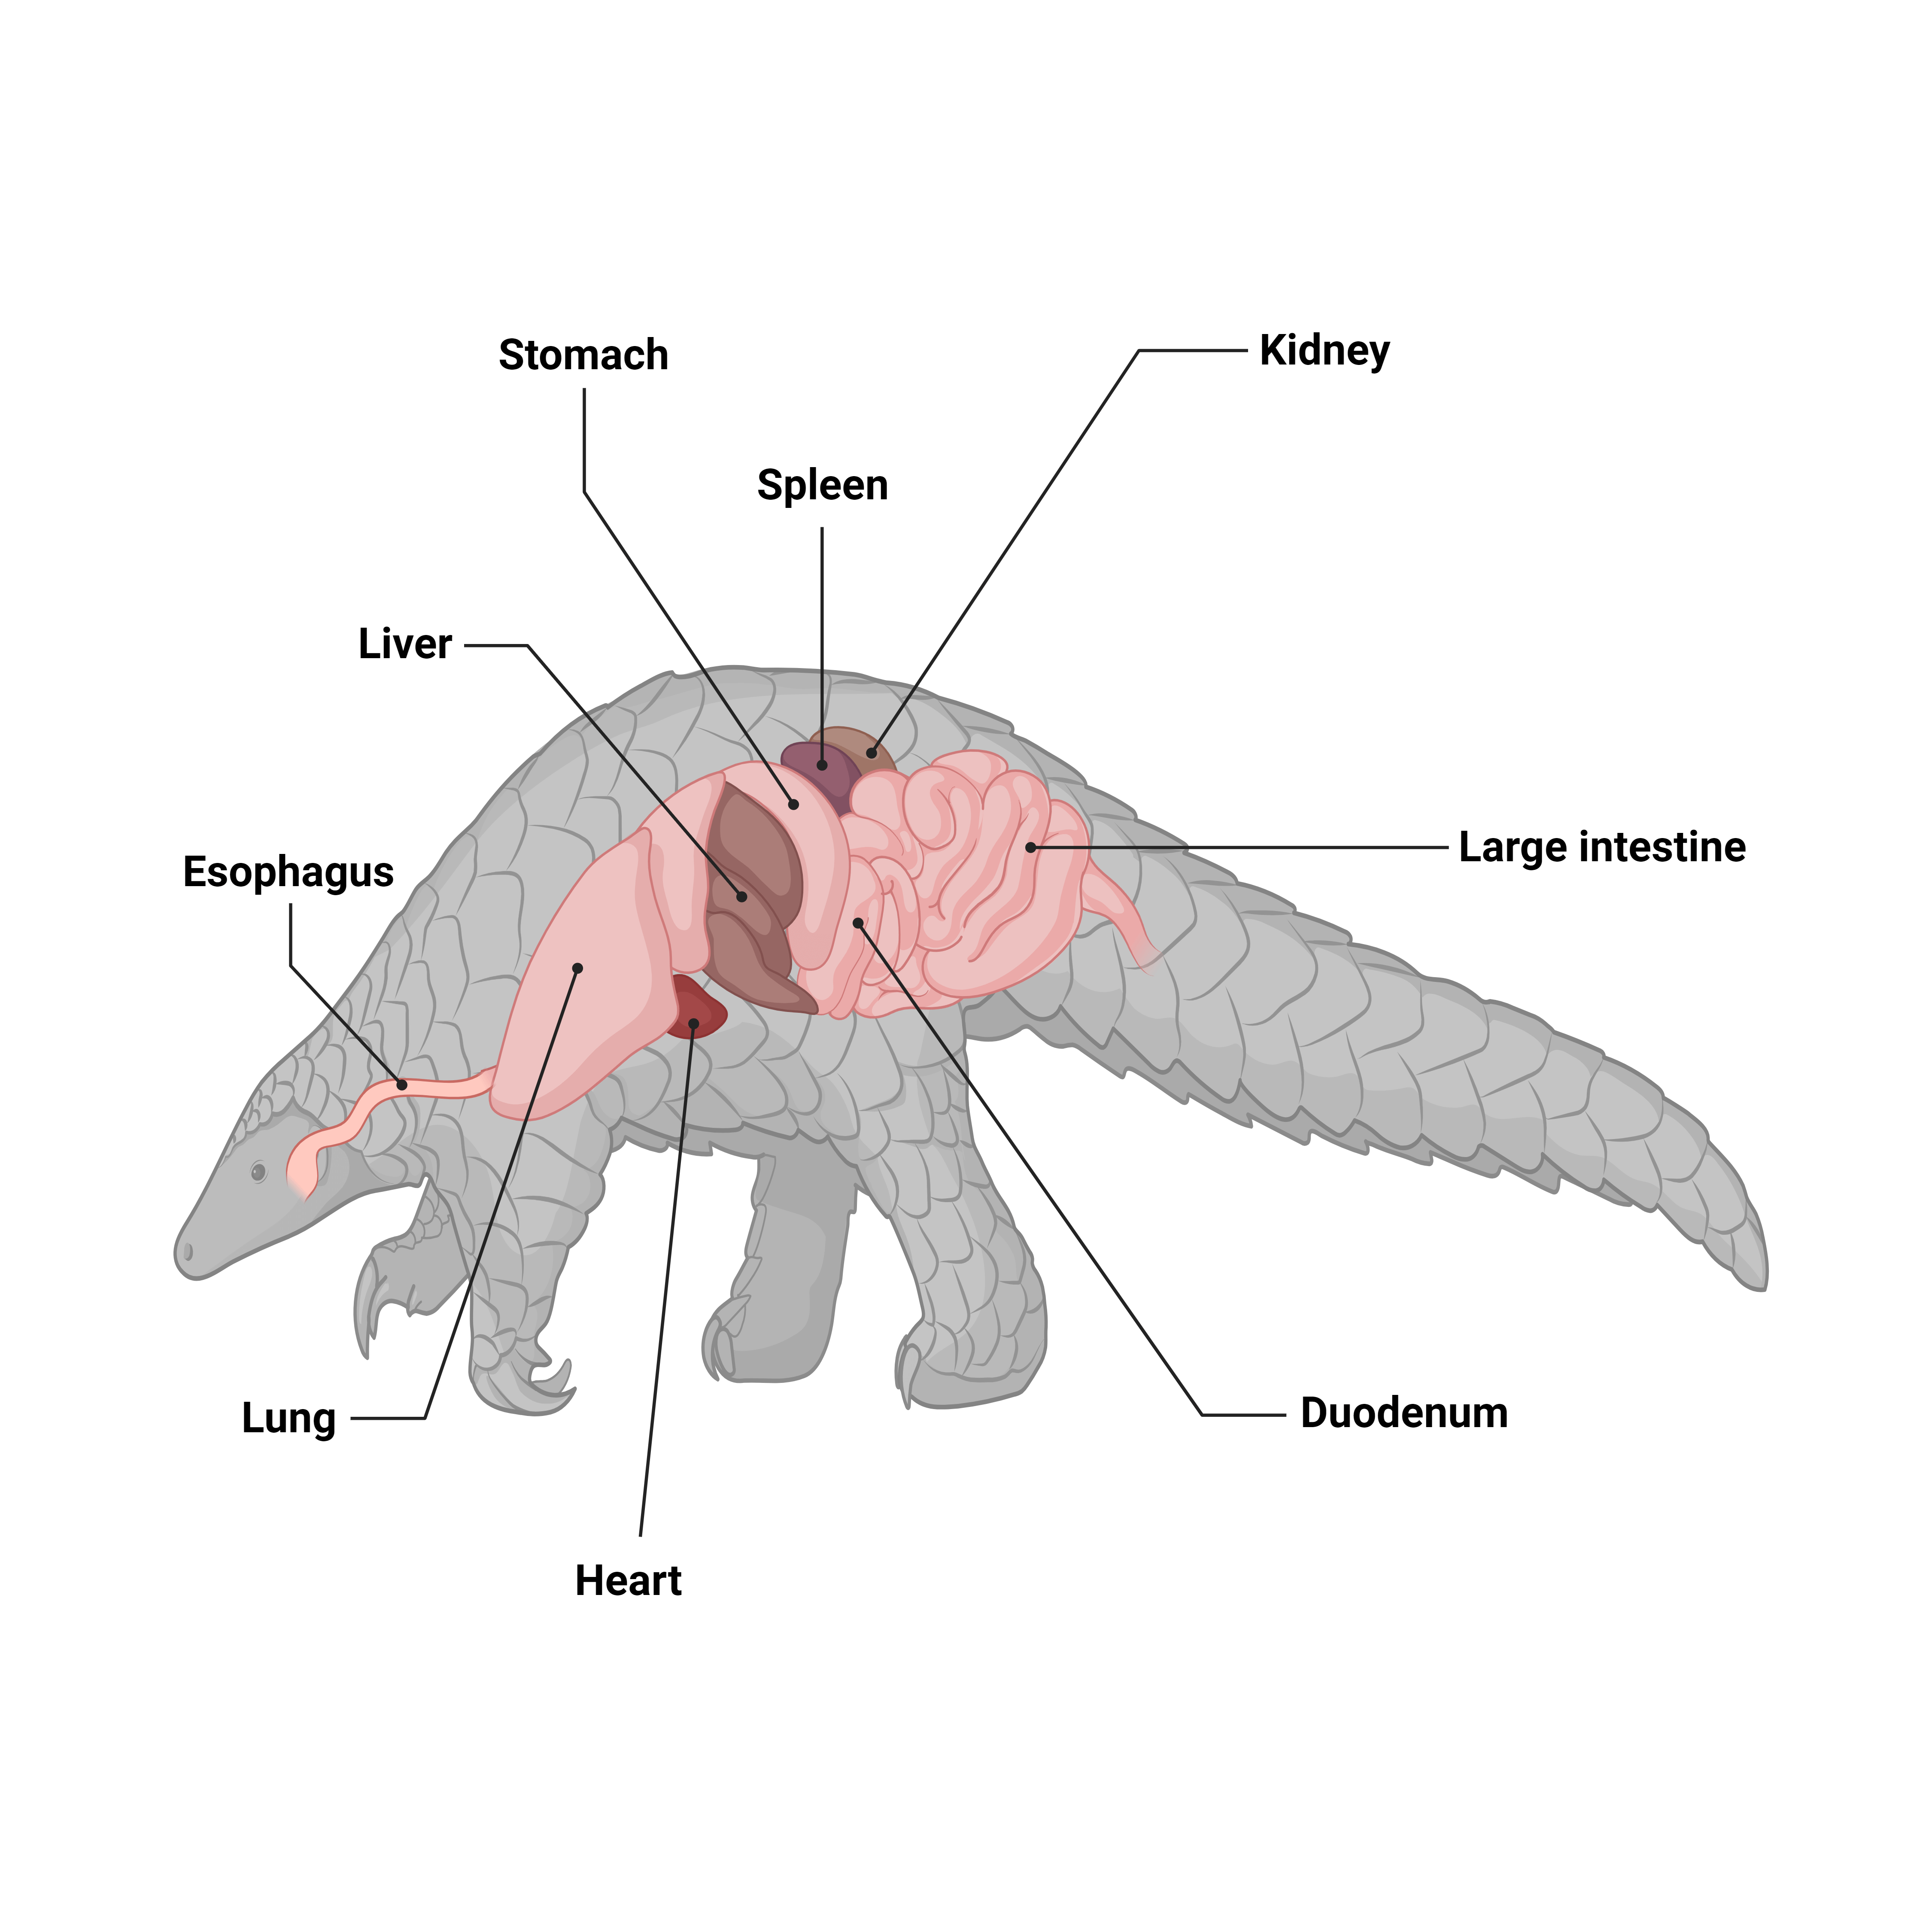
Pangolin atlas from PMID:
34873160
Expressed in Cells (%)
- 100
- 0
Step 2k: Gene Sets Score of Frog Atlas
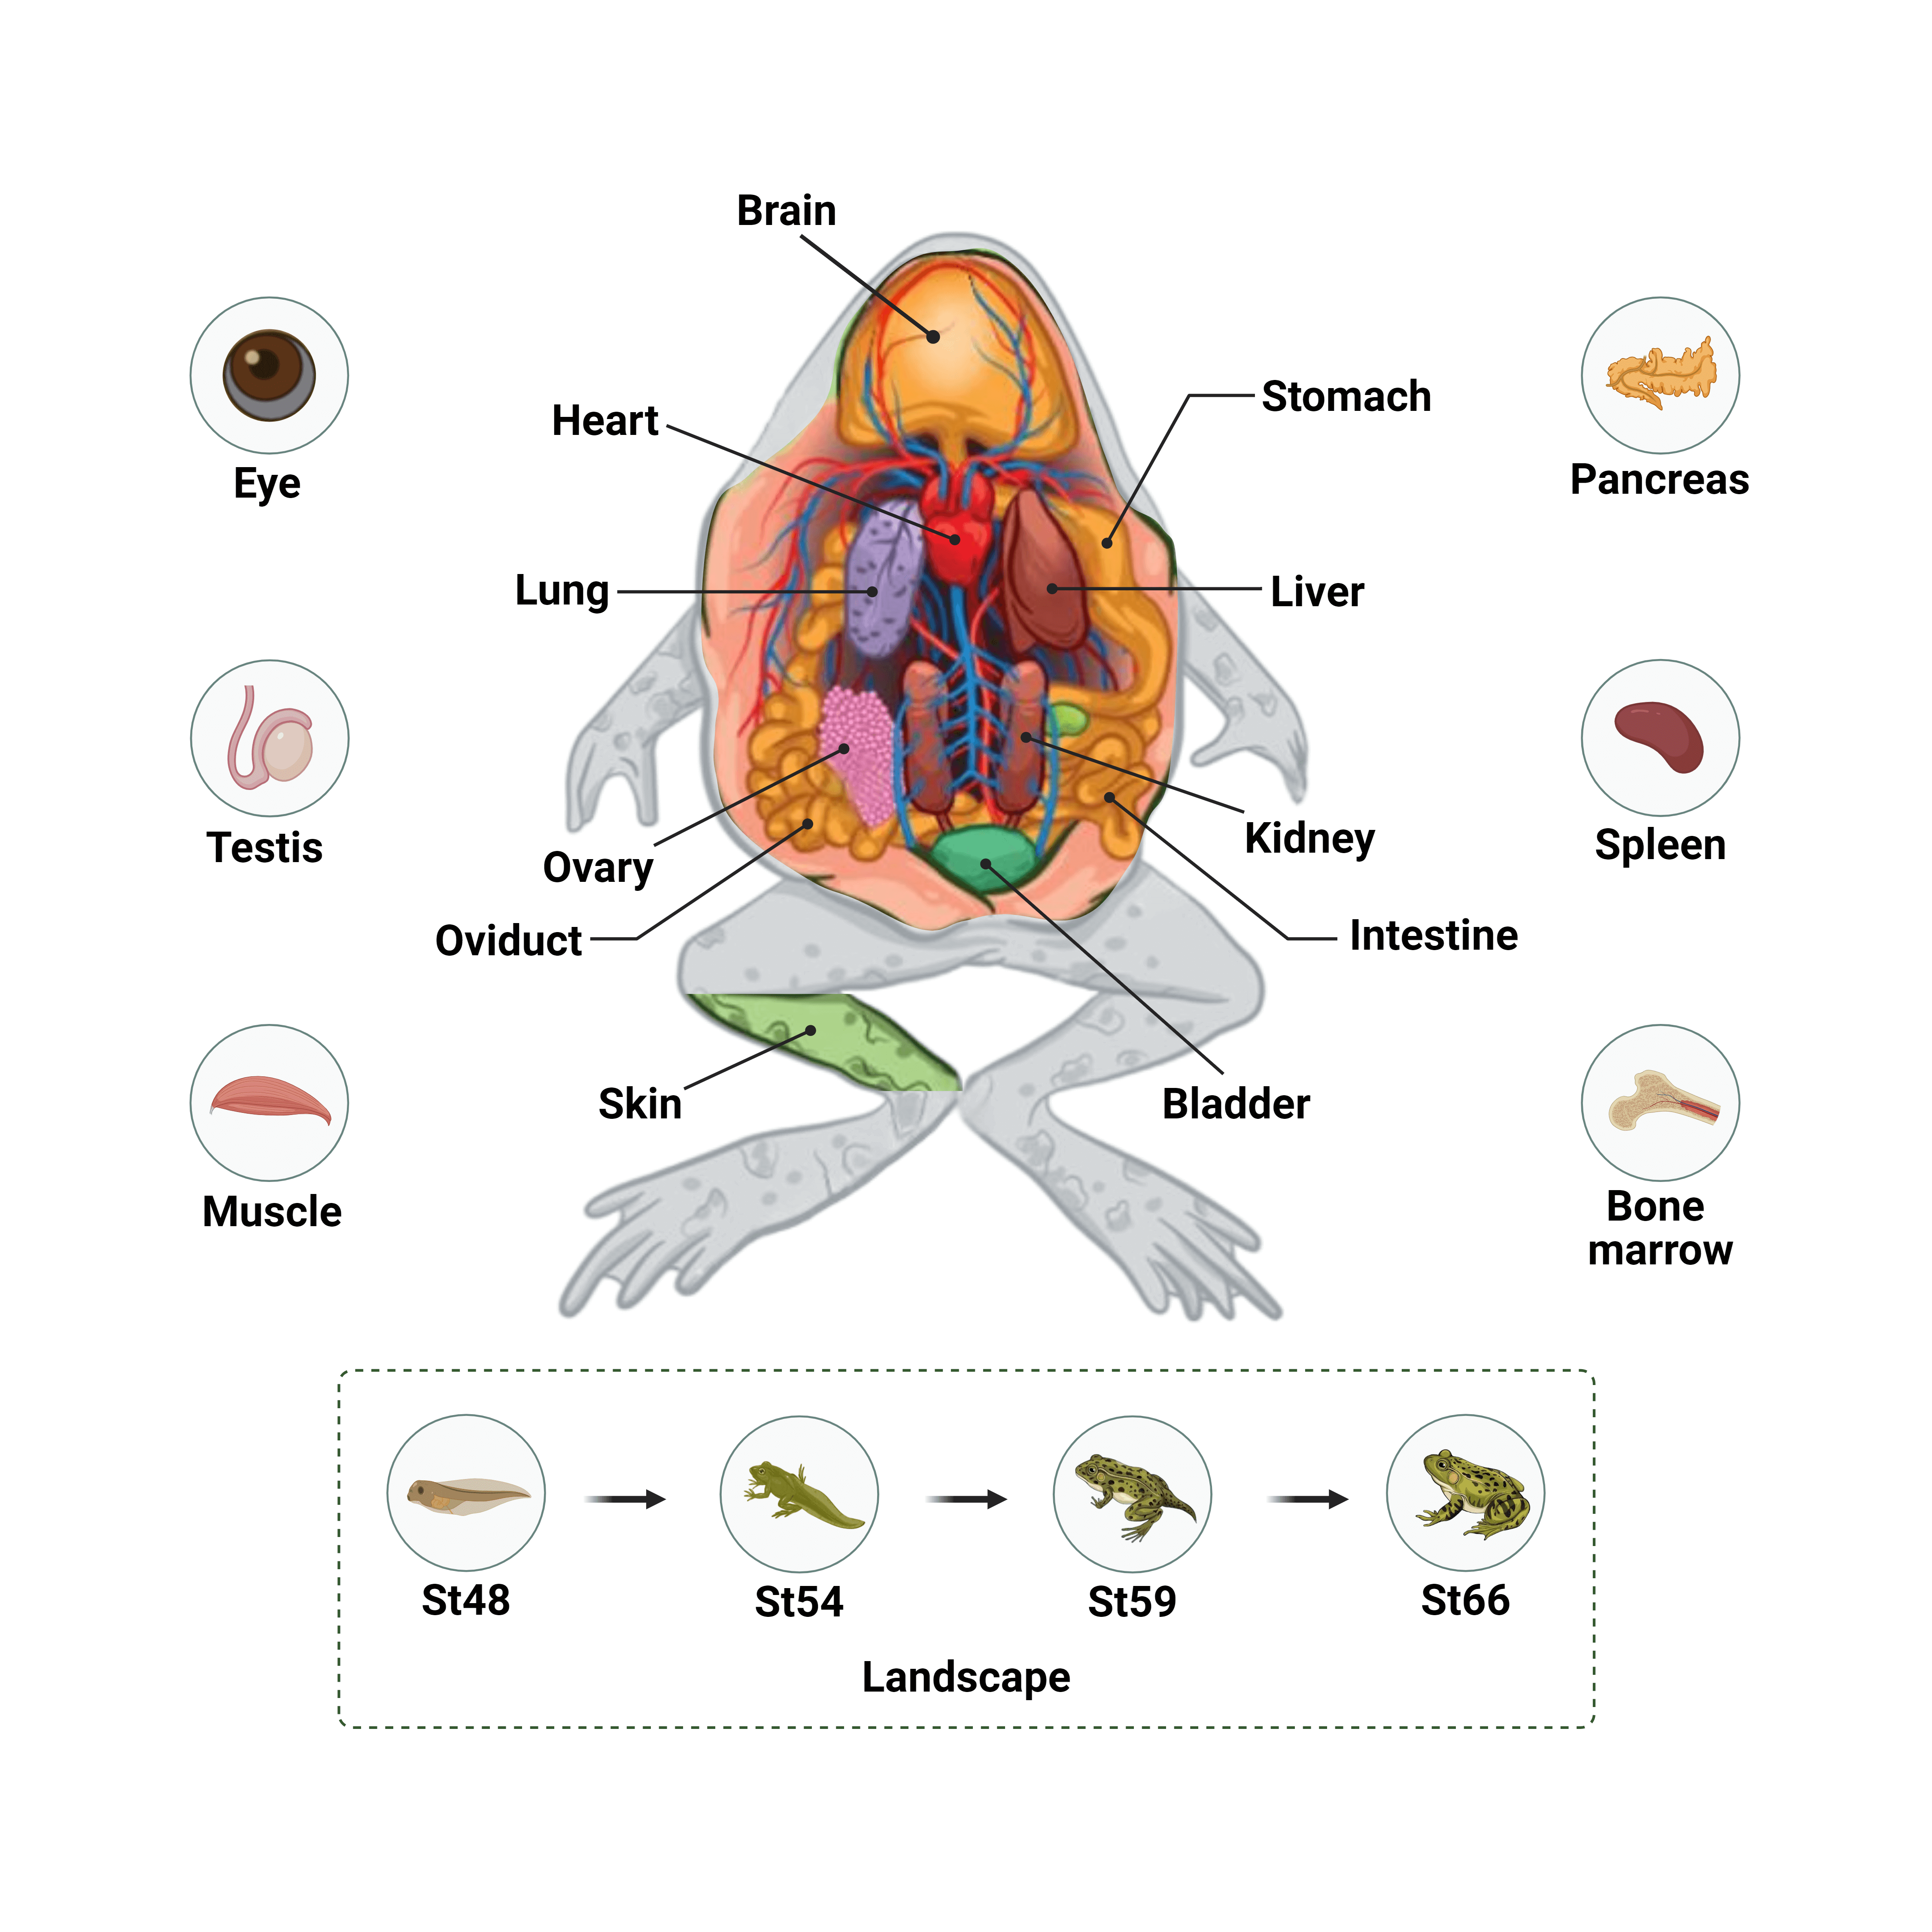
Frog atlas from PMID:
35879314
Expressed in Cells (%)
- 100
- 0
Step 2l: Gene Sets Score of Zebrafish Atlas
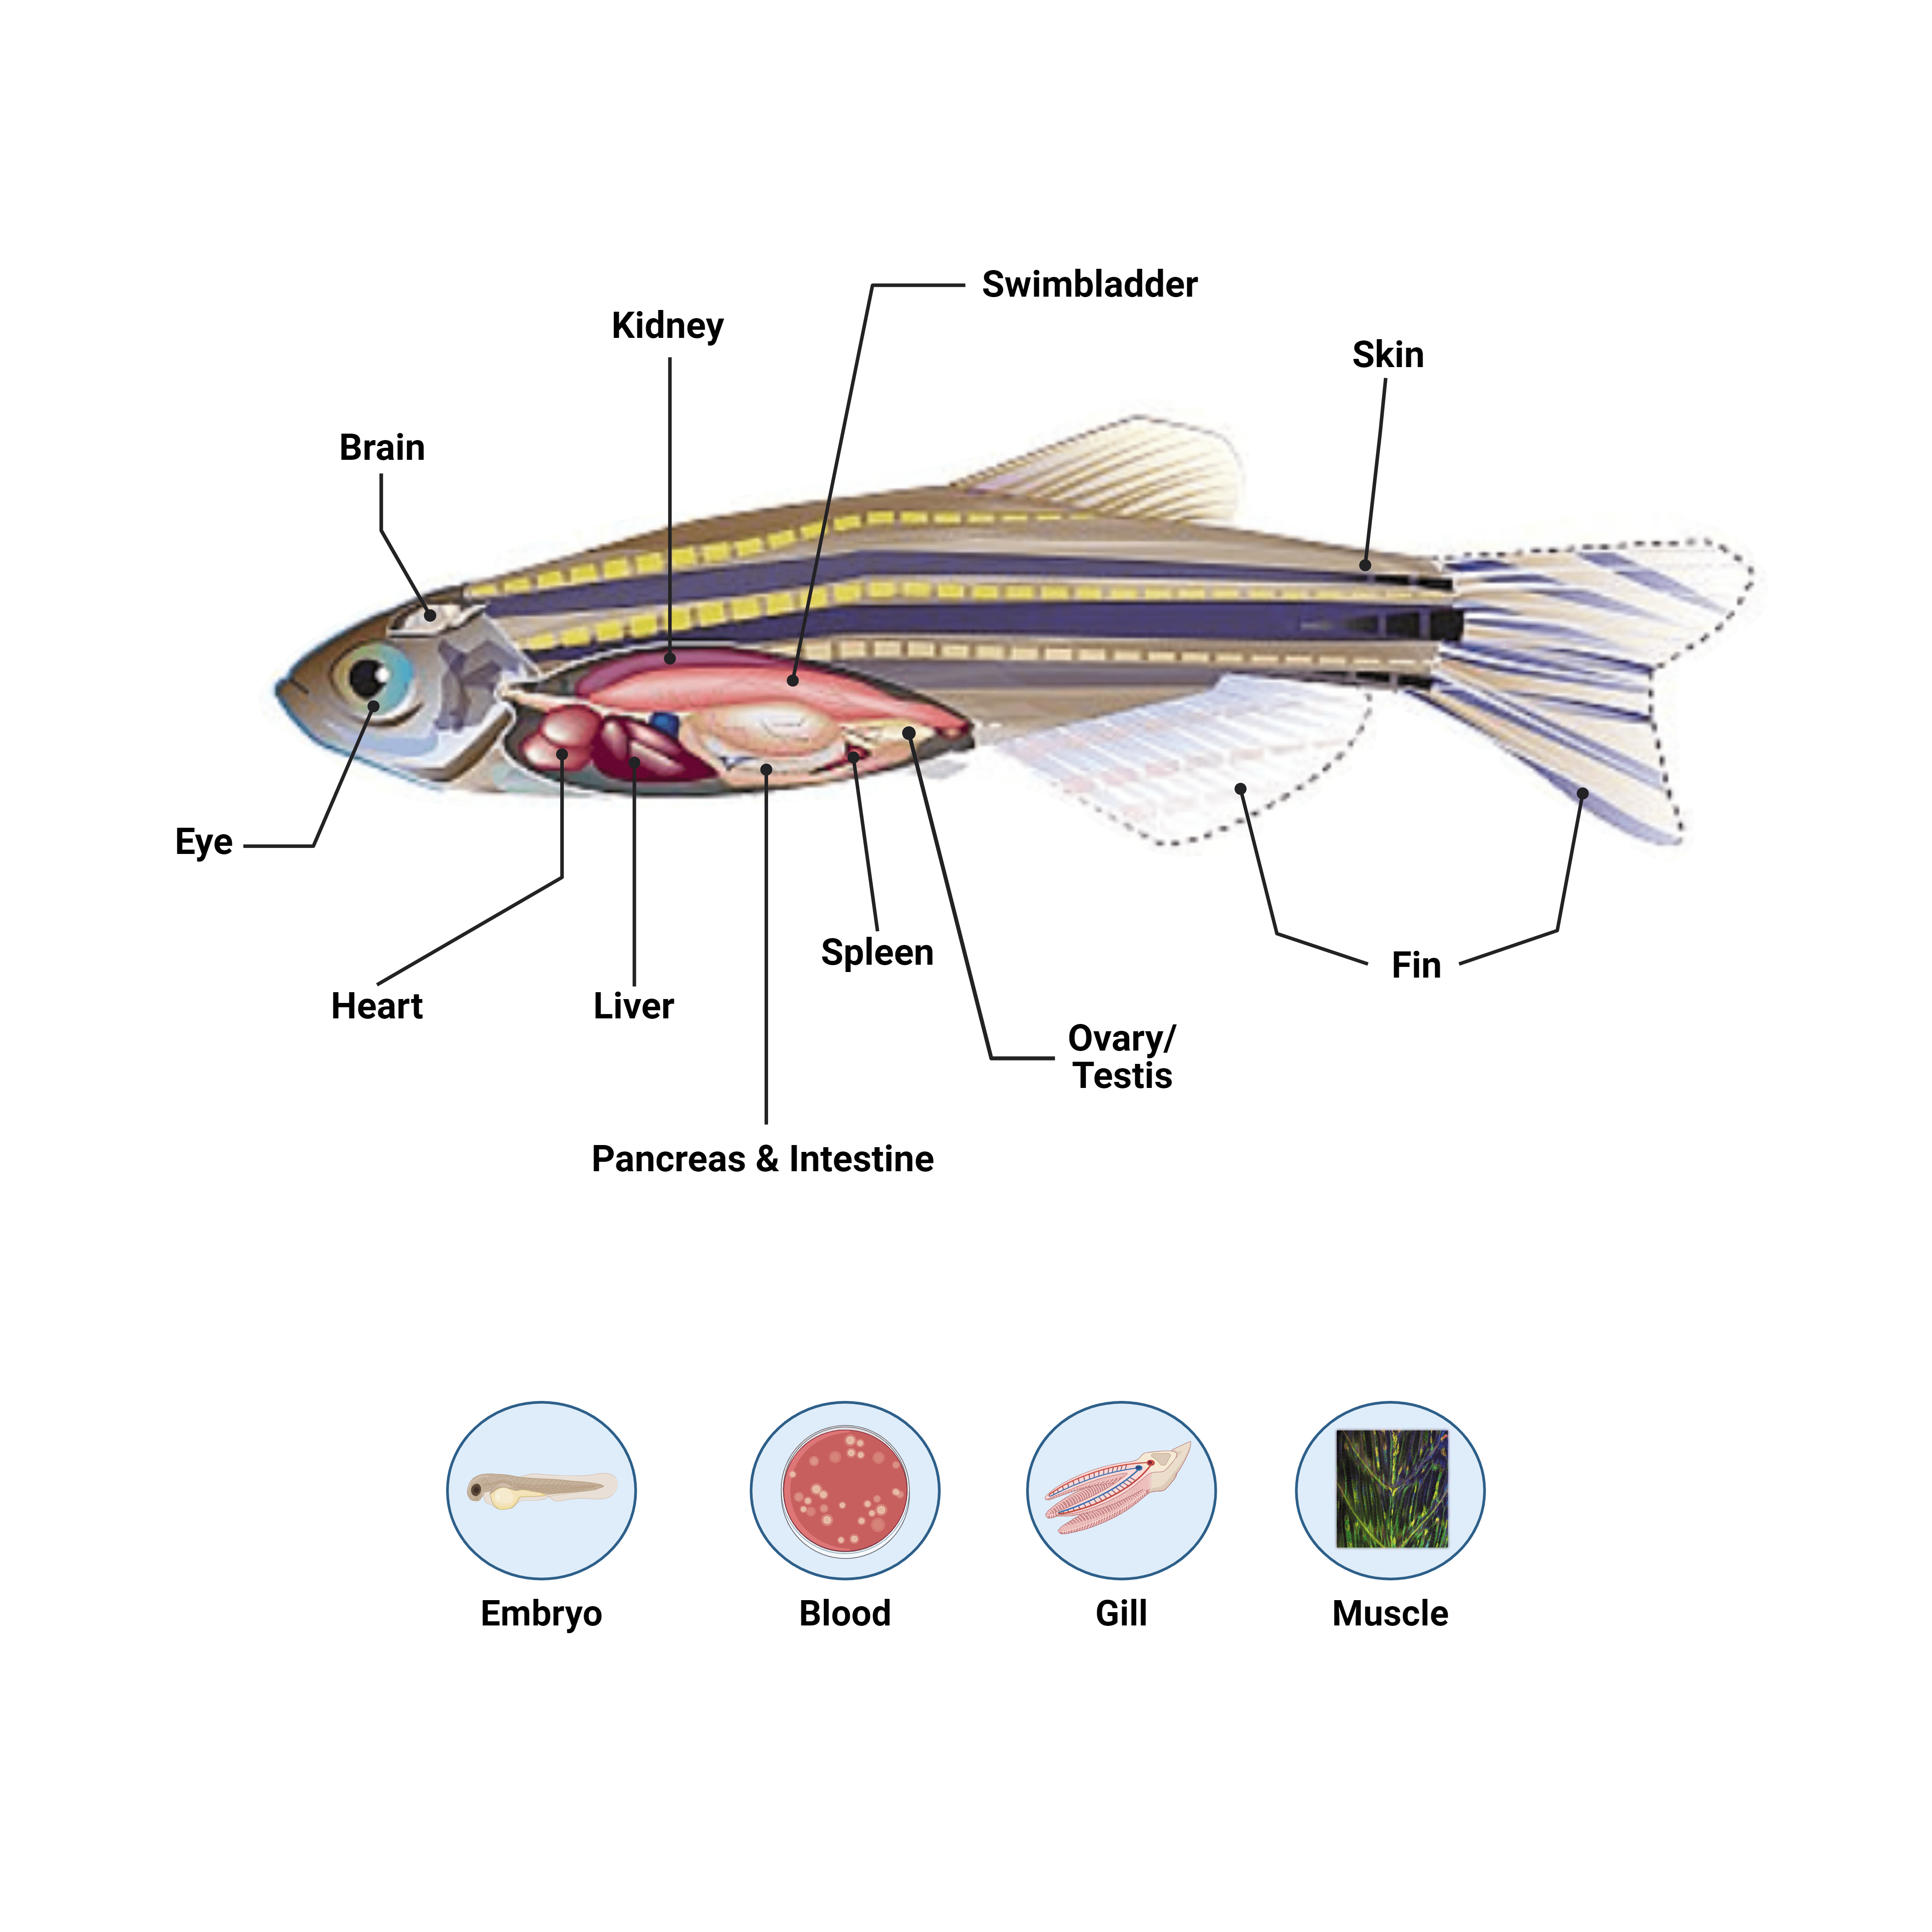
Zebrafish atlas from PMID: 34660600
Expressed in Cells (%)
- 100
- 0