BrainOmics includes 17 sub-modules: BrainRegion, BrainDev, BrainAtlas, BrainCellMarker, BrainST, BrainGWAS, BrainSplicing, BrainAcetylation, BrainProteomics, BrainNcRNA, eQTL, isoQTL, sQTL, Enhancers, and BrainMethylation. This section provides comprehensive multi-dimensional data analysis at the single-cell level for brain tissues, encompassing gene regulatory networks, spatial transcriptomics, proteomics, DNA methylation, and various QTL analyses. These tools help researchers gain deeper insights into the gene expression and regulatory mechanisms in brain tissues, facilitating advanced research in neuroscience.
The BrainRegion module provides the distribution of functional areas in the brain. It categorizes the brain into six tiers, ranging from simple to detailed subdivisions. Users can select their region and tier of interest directly via a sunburst chart or search for brain regions using common names.
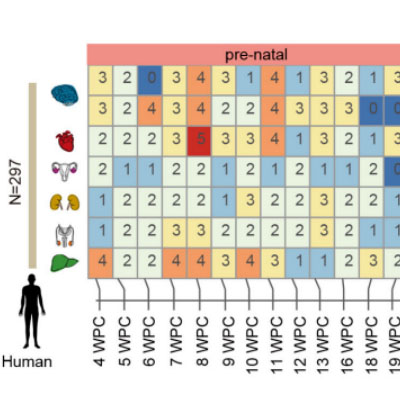
The BrainDev module focuses on evolutionary developmental data across different species. It includes single-cell data from 693 developmental time points across 33 species. Users can explore single-cell developmental atlas data, examining gene expression and cell type changes throughout the developmental process for various species.

The BrainAtlas module compiles scRNA-seq datasets from 310 brain tissues. Using Shiny for interactive visualization, users can select datasets and click on corresponding Shiny links to view cell clustering information, expression data, and gene regulatory network analysis results based on SCENIC. This module allows users to interactively explore all visualized images and data tables.
The brain is composed of various cell types with unique morphological and molecular characteristics. The BrainCellMarker module compiles markers for various brain cell types, including glial cells, neurons, cycling cells, progenitor cells, and endothelial cells, under normal physiological conditions and various neurological disease states. This module provides an interactive tool for users to categorize and query biomarker information for these cell types.
The BrainST module collects 137 spatial transcriptomics datasets from brain tissues. Using shiny for interactive visualization, users can select interested dataset and corresponding Shiny links to view cell clustering information and gene expression data. This module allows users to interactively explore all visualized image and data tables.
Genome-Wide Association Studies (GWAS) are essential tools for understanding the genetic basis of brain diseases. They play a crucial role in disease prediction and the identification of potential therapeutic targets. The BrainGWAS module allows users to query various GWAS datasets related to different brain diseases.
Alternative splicing is dynamic and can produce specific isoforms in different tissues or developmental stages. The BrainSplicing module collects alternative splicing data from the brains of 24-month-old and 6-month-old mice. Alternative splicing events are categorized into eight types: transcription start or termination sites (ATSS, ATTS), 5′ acceptor 3′ donor splice sites (A5, A3), exon skipping (ES), intron retention (IR), multiple exon skipping (MES), and insertion of mutually exclusive exons (MEE). A higher log2_fold_change value indicates higher expression in 24-month-old mice.
H3K27ac is a well-known marker associated with enhancers and chromatin features, playing a crucial role in determining enhancer activity. This is vital for the spatial and temporal regulation of gene expression. The BrainAcetylation module allows users to freely explore the expression of H3K27ac in various brain diseases, providing insights into its regulatory impact on gene expression across different pathological states.
The development of proteomics tools is crucial for neuroscience, as these tools unveil the highly complex biochemical pathways and neurotransmitter networks in the brain. The BrainProteomics module allows users to explore proteomic network data in brain tissues. Users can also access specific dataset details, including article PMIDs and titles.
Non-coding RNAs (ncRNAs) make up over 90% of the human genome's RNA and are involved in various physiological processes such as transcription and post-transcriptional modifications. They play crucial roles in cell metabolism, apoptosis, and biological development. The BrainNcRNA module provides information on the interactions between mRNA, miRNA, and lncRNA in the brain. This helps researchers study the functional networks of non-coding RNAs, offering insights into brain development and brain diseases.
Expression Quantitative Trait Loci (eQTLs)identify genomic regions that influence gene expression levels. They connect genetic variants in noncoding regions to their effects on mRNA production, providing insights into gene regulation during brain development. This is essential for understanding the genetic basis of neuropsychiatric disorders.
Isoform Quantitative Trait Loci (isoQTLs)reveal how genetic variants impact the expression of different mRNA isoforms through alternative splicing. IsoQTLs help elucidate the regulatory mechanisms at play during brain development, which are crucial for understanding neurodevelopmental disorders.
Splicing Quantitative Trait Loci (sQTLs)pinpoint genomic regions that affect the splicing of pre-mRNA. They help map how genetic variants influence splicing patterns, providing a deeper understanding of the genetic regulation in brain development and its implications for neuropsychiatric disorders.
Enhancers are crucial regulatory elements that control gene expression in a lineage- and region-specific manner, especially during human cortex development. Understanding enhancers is essential for deciphering the complex regulatory networks in cortical development and for advancing knowledge of neurodevelopmental and neuropsychiatric disorders.

DNA methylation plays a crucial role in genomic changes during development, making it essential for brain science research. The BrainMethylation module provides methylation data from 35 species, enabling users to explore DNA methylation regulatory patterns across different species.
BrainDisease includes 8 sub-modules: BrainLandscape, BrainDiz, BrainScMarker, BrainTargetDiscovery, BrainDrugScreening, BrainDrugGenome, BrainbioMarker, and BrainDiseaseEnrichment. This section explores neurological diseases from a multi-omics perspective, covering single-cell landscapes, biomarkers, therapeutic target genes, drug discovery based on target genes, and disease status assessment using single-cell expression data.
The BrainLandscape module provides information on genes associated with 48 brain diseases across 7 phenotype categories: neurodegenerative diseases, psychiatric disorders, movement disorders, developmental disorders, brain tumors, substance abuse, and brain-related conditions (PMID: 37079537). The BrainLandscape page includes two panels: the "Disease Selection" panel and the "Landscape" panel. Diseases are categorized by phenotype and highlighted in different colors. Users can click on a disease button to obtain molecular characteristics in the "Landscape" panel, which includes six tabs: "Genes," "Gene Families," "GO," "Pathways," "Drugs," and "Diseases," for functional annotation of disease-related genes.
The BrainDiz module focuses on disease data in brain-related tissues. It collects scRNA-seq disease datasets from 100 brain-related tissue samples, categorizing diseases into nine detailed classes. Users can select a disease category to view corresponding disease abbreviations and access specific disease information, including article PMIDs and titles.
The BrainbioMarker module offers biomarkers for various brain disease. Users can filter biomarker based on five categories: Clinical features、Metabolites、miRNA、ncRNA、Protein. By clicking on a specific biomarker category, users can access a list of biomarkers that includes information on disease type, molecular type, and data source.
The BrainScMarker module compiles scRNA-seq datasets for common brain diseases. Users can click on disease tags on the module page to view lists of single-cell RNA sequencing data for the selected disease. The list displays brief information about each dataset and provides a "Details" link to access more in-depth information. Additionally, users can view visualizations of the data on the detailed information pages.
The BrainTargetDiscovery module compiles predicted target gene data for common brain diseases. Users can click on disease cards to view the corresponding predicted target genes, including detailed information such as gene names and protein classifications. This module plays a crucial role in precision medicine for brain diseases, aiding in the identification of potential therapeutic targets.

In the era of precision medicine, developing targeted drugs is a key approach to addressing disease treatment challenges. Research on disease-associated differential proteins on cell surfaces can provide crucial targets for therapeutic drug development. The BrainDrugScreening module enables users to query information on targeted drugs for predicted brain disease targets, facilitating the discovery of potential therapeutic agents.
Pharmacogenomics is an emerging interdisciplinary field that studies the relationship between human genome information and drug responses, built on the foundations of genetics, genomics, and pharmacology. It guides personalized medicine, assesses the risk of severe drug adverse reactions, and informs new drug development and evaluation. The BrainDrugGenome module allows users to access available pharmacogenomics data, including specific drug names, information sources, and related articles. This module supports users in their pharmacogenomics research, enhancing the understanding of drug responses in brain diseases.
The BrainDiseaseEnrichment module translates brain tissue single-cell sequencing data into clinically relevant information. Users can view clinical insights derived from single-cell data across various species, facilitating in-depth research on neurological diseases.
GutOmics includes 8 sub-modules: GutAtlas, GutST, GutMethylation, GutCellMarker, PanCancerMeta, MetaDistribution, MetaDiseaseMarker, and MetaDynamics. This section offers extensive data analysis at the single-cell level for gut tissues, including gene regulatory networks, spatial transcriptomics, DNA methylation, and cell type markers. Additionally, it covers microbiome distribution and disease markers across species, providing valuable insights into gut biology and disease mechanisms.
The GutAtlas module compiles 137 scRNA-seq datasets from gut tissues. Using Shiny for interactive visualization, users can select datasets and click on corresponding Shiny links to view cell clustering information, expression data, and gene regulatory network analysis results based on SCENIC. This module allows users to interactively explore all visualized images and data tables.
The GutST module compiles 12 spatial transcriptomics datasets from gut tissues. Using Shiny for interactive visualization, users can select datasets and click on corresponding Shiny links to view cell clustering information and expression data. This module allows users to interactively explore all visualized images and data tables.
During development, DNA methylation plays a crucial role in genomic regulation, making it essential for studying neuronal activity. The GutMethylation module provides methylation data for gut-related tissues from three species. This module enables users to explore DNA methylation regulatory patterns in the gut.
The gut is composed of various cell types with unique morphological and molecular characteristics. The GutCellMarker module collects datasets for different gut cell types, including epithelial cells, immune cells, stem cells, mesenchymal cells, neural cells, endothelial cells, and cancer cells, under both normal physiological conditions and various pathological states. This module also offers an interactive tool for users to categorize and query biomarker information for these cell types.
The tumor microbiome has gained significant attention as emerging biomarkers. The PanCancerMeta collects microbiome biomarkers from seven types of cancer: breast cancer, lung cancer, ovarian cancer, pancreatic cancer, melanoma, bone cancer, and brain tumors, along with their adjacent normal tissues. This module aims to provide insights into the microbiome profiles associated with these cancers.
The MetaDistribution module analyzes gut microbiome biomarkers across species. It includes data from 10 species: Human、Crab-eating macaque、Ferret、Marmoset、Mini pig、Woodchuck、Tree shrew、Bat、Panda,Honeybee. Different species exhibit distinct gut microbiome distribution patterns. Users can utilize this module to study the specific distribution patterns of gut microbiomes in various species and their changes throughout developmental stages.
MetaDiseaseMarker includes data from 2,320 individuals with nine conditions: colorectal cancer, colorectal adenoma, Crohn's disease, ulcerative colitis, irritable bowel syndrome, obesity, cardiovascular disease, post-acute COVID-19 syndrome, and healthy controls. Users can explore the relationships between gut microbiota and these diseases.
The gut microbiome changes throughout human development, providing valuable insights into developmental processes. The MetaDynamics module includes a cohort of 98 mothers and their fetuses at different developmental stages, focusing on the gut microbiome. Users can explore dominant microbial species at various developmental points and examine how different delivery methods affect the newborn's gut microbiome.
Brain2Gut includes 9 sub-modules: BrainGRN, GutGRN, TFshare, BrainGutAxis, HostMicrobeInter, BrainTropism, GutTropism, BrainCellDeathSig, and GutCellDeathSig. This section investigates the regulatory pathways of the brain-gut axis, viral receptor expression patterns, shared regulatory factors, and cell death pathways in both brain and gut tissues. It helps researchers understand the complex interactions and communication between the brain and gut, crucial for studying related diseases and conditions.
Gene regulatory networks (GRNs) determine and maintain cell-type-specific transcriptional states, forming the basis of cellular morphology and function. The BrainGRN module uses single-cell RNA-seq data and SCENIC to study gene regulatory networks at the cell type level in brain tissue. It identifies the top 20 transcription factors and their target genes in each cell type. Additionally, it provides GO and KEGG enrichment analysis for the target genes of each transcription factor.
Gene regulatory networks (GRNs) determine and maintain cell-type-specific transcriptional states, forming the basis of cellular morphology and function. The GutGRN module uses single-cell RNA-seq data and SCENIC to study gene regulatory networks at the cell type level in gut tissue. It identifies the top 20 transcription factors and their target genes in each cell type. Additionally, it provides GO and KEGG enrichment analysis for the target genes of each transcription factor.
Transcription factors (TFs) are proteins with specific structures that regulate gene expression, playing key roles in the development of multicellular organisms. In the TFshare module, we analyzed the specific expression of regulons in 21 brain cell types and 61 gut cell types. We classified all identified differentially expressed regulons into three categories: SharedTF, BrainSpecific, and GutSpecific. This module allows users to identify regulons that regulate expression across both brain and gut cell types, as well as to filter for tissue-specific and cell type-specific regulons.
The brain-gut axis plays a crucial role in maintaining homeostasis. In the BrainGutAxis module, we have compiled regulatory pathways of the brain-gut axis extracted from extensive literature, including the effects of gut microbiota and gut immune cell homeostasis disruption on the central nervous system. Users can select specific GutFactors or BrainTargets to view their associated brain-gut regulatory pathways or filter by disease to explore pathways related to specific conditions.
Host-microbe interactions are often crucial for vector-borne disease transmission. The HostMicrobeInter module includes 1,303 microbe-host protein interaction pairs extracted from literature, covering 82 pathogens and microbes and 713 unique human proteins. Users can explore specific microbes or human proteins to study their associated host-microbe interaction relationships.
Predicting potential host and target tissues for viruses across species is a critical research area. Studying viral receptor expression patterns using single-cell data is an emerging method for predicting potential viral infection targets. In the BrainTropism module, we have collected single-cell data from brain of 14 species to study the receptor expression patterns of viruses. This module aims to predict potential virus-host infection relationships based on these expression patterns.
Predicting potential host and target tissues for viruses across species is a critical research area. Studying viral receptor expression patterns using single-cell data is an emerging method for predicting potential viral infection targets. In the GutTropism module, we have collected single-cell data from gut tissues of 3 species to study the receptor expression patterns of viruses. This module aims to predict potential virus-host infection relationships based on these expression patterns.
Cell death is essential for organism development and homeostasis.The BrainCellDeathSig module visualizes the expression patterns of genes from 18 cell death-related clusters in brain single-cell data using violin plots (VlnPlot) and feature plots (FeaturePlot). This module helps identify potential cell death targets.
Cell death is essential for organism development and homeostasis.The GutCellDeathSig module visualizes the expression patterns of genes from 18 cell death-related clusters in gut single-cell data using violin plots (VlnPlot) and feature plots (FeaturePlot). This module helps identify potential cell death targets.
CrossSpecies includes 4 sub-modules: Couple, BrainEvolution, GutEvolution, and TFevo. This section provides cross-species gene evolution analysis, homologous gene conversion data, and comprehensive atlases of brain and gut tissues across different species. These tools enable researchers to compare and understand biological mechanisms and evolutionary processes across species, fostering a deeper understanding of genetic and molecular conservation and divergence.
Cross-species homologous gene conversion is essential in biological research. It allows scientists to identify and compare functionally similar genes across different species, revealing gene function conservation and evolutionary processes. This conversion is crucial for understanding complex biological mechanisms, developing new therapies, and validating gene functions in various model organisms. The Couple module converts genes from over 1,000 common species to their human homologs, providing conversion tables for users to query and download.
The BrainEvolution module provides an atlas of brain-related tissues across species. Users can select datasets from different articles by clicking on folder icons on the page, then choose the species of interest. UMAP images and charts showing the number of cells and genes for each cell type will be displayed automatically.
The GutEvolution module provides an atlas of gut-related tissues across species. Users can select datasets from different articles by clicking on folder icons on the page, then choose the species of interest. UMAP images and charts showing the number of cells and genes for each cell type will be displayed automatically.
Changes in transcription factors (such as gene duplication, mutation, and recombination) can drive new gene regulatory patterns and evolutionary innovation. In the TFevo module, we analyze species-specific regulons in microglial cells from brain tissues of eight species: humans, macaques, marmosets, sheep, mice, hamsters, chickens, and zebrafish. We collected the top 50 transcription factors for microglial cells in each species. Across the eight species, we identified 400 regulons, with 200 shared and 200 species-specific. This module allows users to compare the similarities and differences in transcription factor expression in microglial cells across species, identifying conserved and species-specific transcription factors in evolutionary processes.
OnlineTools includes 8 sub-modules: SCAN_Cerebro, SCAN_SVA, SCAN_Methylscaper, SCAN_Circos, SCAN_RNAseqTool, SCAN_Association, SCAN_WGCNA, and SCAN_Heatmap. This section offers a suite of powerful tools for data analysis and visualization, supporting a wide range of research needs. These tools facilitate the analysis of single-cell RNA sequencing data, methylation patterns, genetic associations, and network analyses, providing robust support for complex data interpretation and discovery in brain and gut research.
With the continuous development of single cell sequencing technology, more and more researchers begin to regard single cell sequencing technology as an important research method. The emergence of interactive visualization tools that can be used for single-cell sequencing data has reduced the difficulty of researchers interpreting data. As a powerful single-cell data display tool, Cerebro has the ability to complete interactive dimensionality reduction results display, differential gene display, pathway enrichment analysis results display, gene and gene set score display, and quasi-temporal analysis. The SCAN_Cerebro module provides a convenient window to help researchers better apply Cerebro.(PMID: 31764967)
Identifying and annotating the sources of hidden variants in scRNA-seq data is an important task in single-cell sequencing data analysis because it is a challenge to explain whether gene expression variables have biological significance. The emergence of V-SVA tools provides a key tool for solving this problem. The SCAN_SVA module provides an efficient interactive window for analysts to use V-SVA, which can help researchers better identify and annotate the hidden variation sources in sc RNA-seq data.(PMID: 32119082)
For a long time, how DNA methylation patterns at each site of the genome and in different tissues or cells are regulated is a basic question that needs to be answered in epigenetics. DNA methylation is a kind of epigenetic modification that occurs on the carbon atom of cytosine 5 and can be stably inherited, which is widely present in biological genomes. The establishment and pattern of DNA methylation in different tissues and cells are essential for gene regulation, transposon silencing and gene imprinting. SCAN_Methylscaper integrates the currently completed DNA methylation profiles, which can provide epigenetic information for species evolution research.(PMID: 34125875)
Data visualization is a key step in the process of data analysis, and the creation of Circos is one of the most effective methods to realize genome data visualization. Therefore, how to draw the Circos diagram simply and efficiently is a very important issue for some researchers who lack experience in code writing. Therefore, in the SCAN_Circos module, we provide an interactive interface that can be used to make Circos diagrams to help researchers efficiently make and modify various types of Circos diagrams.(doi:https://doi.org/10.1002/imt2.109)
RNAseqTool provides an interactive and user-friendly method for users to analyze RNAseq data, and provides a good solution for RNAseq data analysis and visualization. Its functions include : interactive visualization, principal component analysis ( PCA ), gene differential expression analysis, gene annotation and function analysis, gene trend analysis, WGCNA analysis, data export: PDF & XLSX, continuous development and improvement. In the SCAN_RNAseqTool module, we provide a convenient way for users to use RNAseqTool, enabling users to use the tool more efficiently.(https://github.com/ChaoXu1997/RNAseqTool#h2)
Genome wide association study ( GWAS ) is a research method that detects the genetic variation ( marker ) polymorphism of multiple individuals on a genome-wide basis, obtains genotypes, and then associates genotypes with observable traits. It has received more and more attention. However, GWAS usually produces a large number of output files, which poses a great challenge to the interpretation and visualization of data. Therefore, efficient, dynamic and integrated data visualization tools are crucial for biologists to interpret longitudinal GWAS results. In the SCAN_Association module, we provide a convenient GWAS data visualization tool to help researchers interpret GWAS data more efficiently.(PMID: 31245691)
Weighted gene co-expression network analysis ( WGCNA ) is an analysis method suitable for complex transcriptome data. It can be used to study the development regulation of different organs or tissue types, the different development regulation of the same tissue, the response of abiotic stress at different time points, and the response at different time points after pathogen infection. Through WGCNA analysis, we can not only find out the co-expressed gene modules, but also explore the relationship between the gene network and the concerned phenotypes and the core genes in the network. In the SCAN_WGCNA module, we provide an interactive interface for WGCNA, which can help researchers better analyze complex transcriptome data.(https://github.com/ShawnWx2019/WGCNA-shinyApp)
Heatmap is a research method that visualizes data by mapping each value in the data matrix to a color display according to a certain rule and using color changes. This method can visually present the global expression changes of multiple genes in multiple samples, and can also show the clustering relationship of multiple samples or multiple gene expression. In the SCAN_Heatmap module, we provide an online tool that can efficiently make Heatmap.(PMID: 34864868)