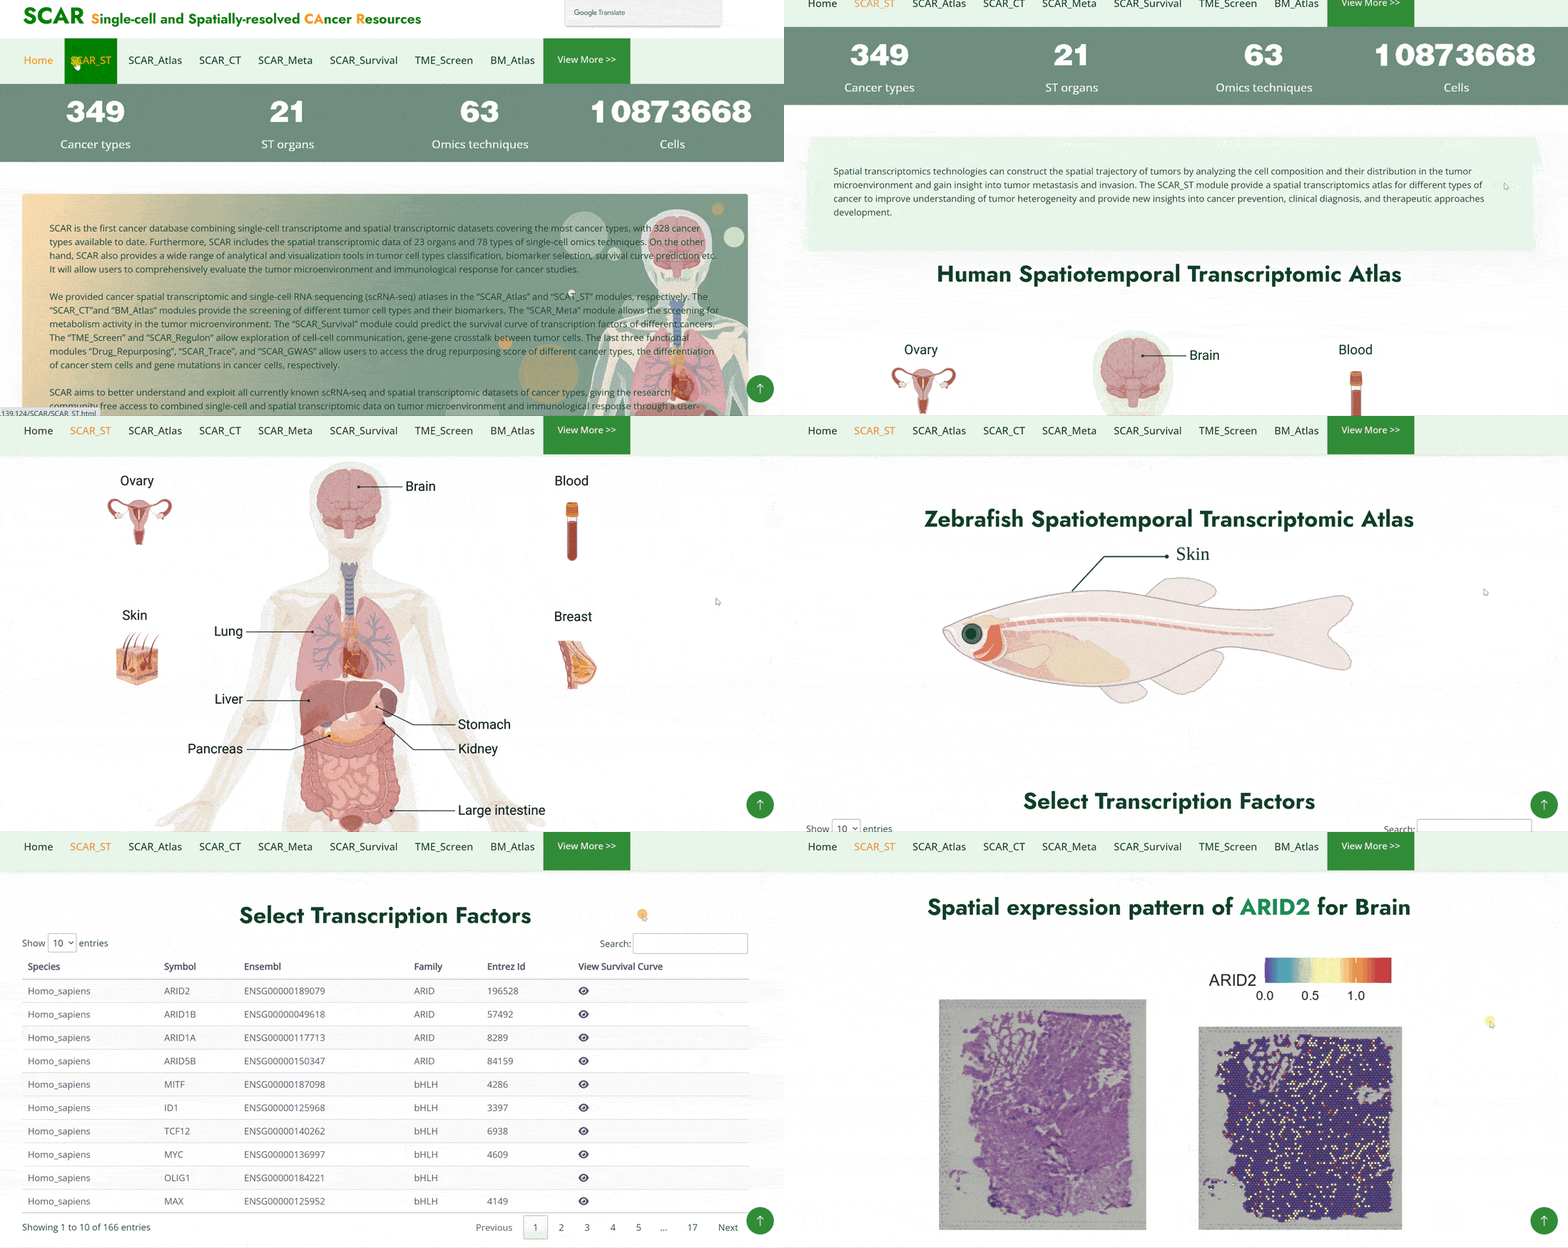
Within the SCAR_ST module, we provide cancer spatial transcriptomic atlases of the human, mouse and zebrafish including 24 datasets. The spatial expression pattern of transcription factors (TF) in these datasets can be viewed by clicking on the anatomical labels on the human, mouse and zebrafish anatomies, or by searching in the underlying tables individually. After clicking the label on the anatomy, it will direct to the underlying table and present all transcription factors of that organ. By clicking the “little eye” icon in the transcription factor information column, the spatial expression pattern graph and source information of that TF will be displayed as follows.
SCAR_Atlas
The SCAR_Atlas module provides four types of cancer single-cell atlases of human, mouse, organoids, and cell lines. A total of xx datasets from over one hundred single-cell multi-omics techniques are included. In each cancer atlas, the single-cell datasets can be quired by two ways. The first one is by hierarchically selecting cancer types, cancer subtypes and data IDs in the column. The second one is by clicking cancer type pictures under the hierarchical column or the name in the word cloud graph. Then the users will be directed to the bottom table with the information on datasets. Click on 'Single Cell Atlas' in green font to view details of the dataset in ShinyCell, and on 'Detail' in green font to display categories of the dataset. In ShinyCell, cell information, gene expression, graph visualizations and data sources can be further queried.

SCAR_CT
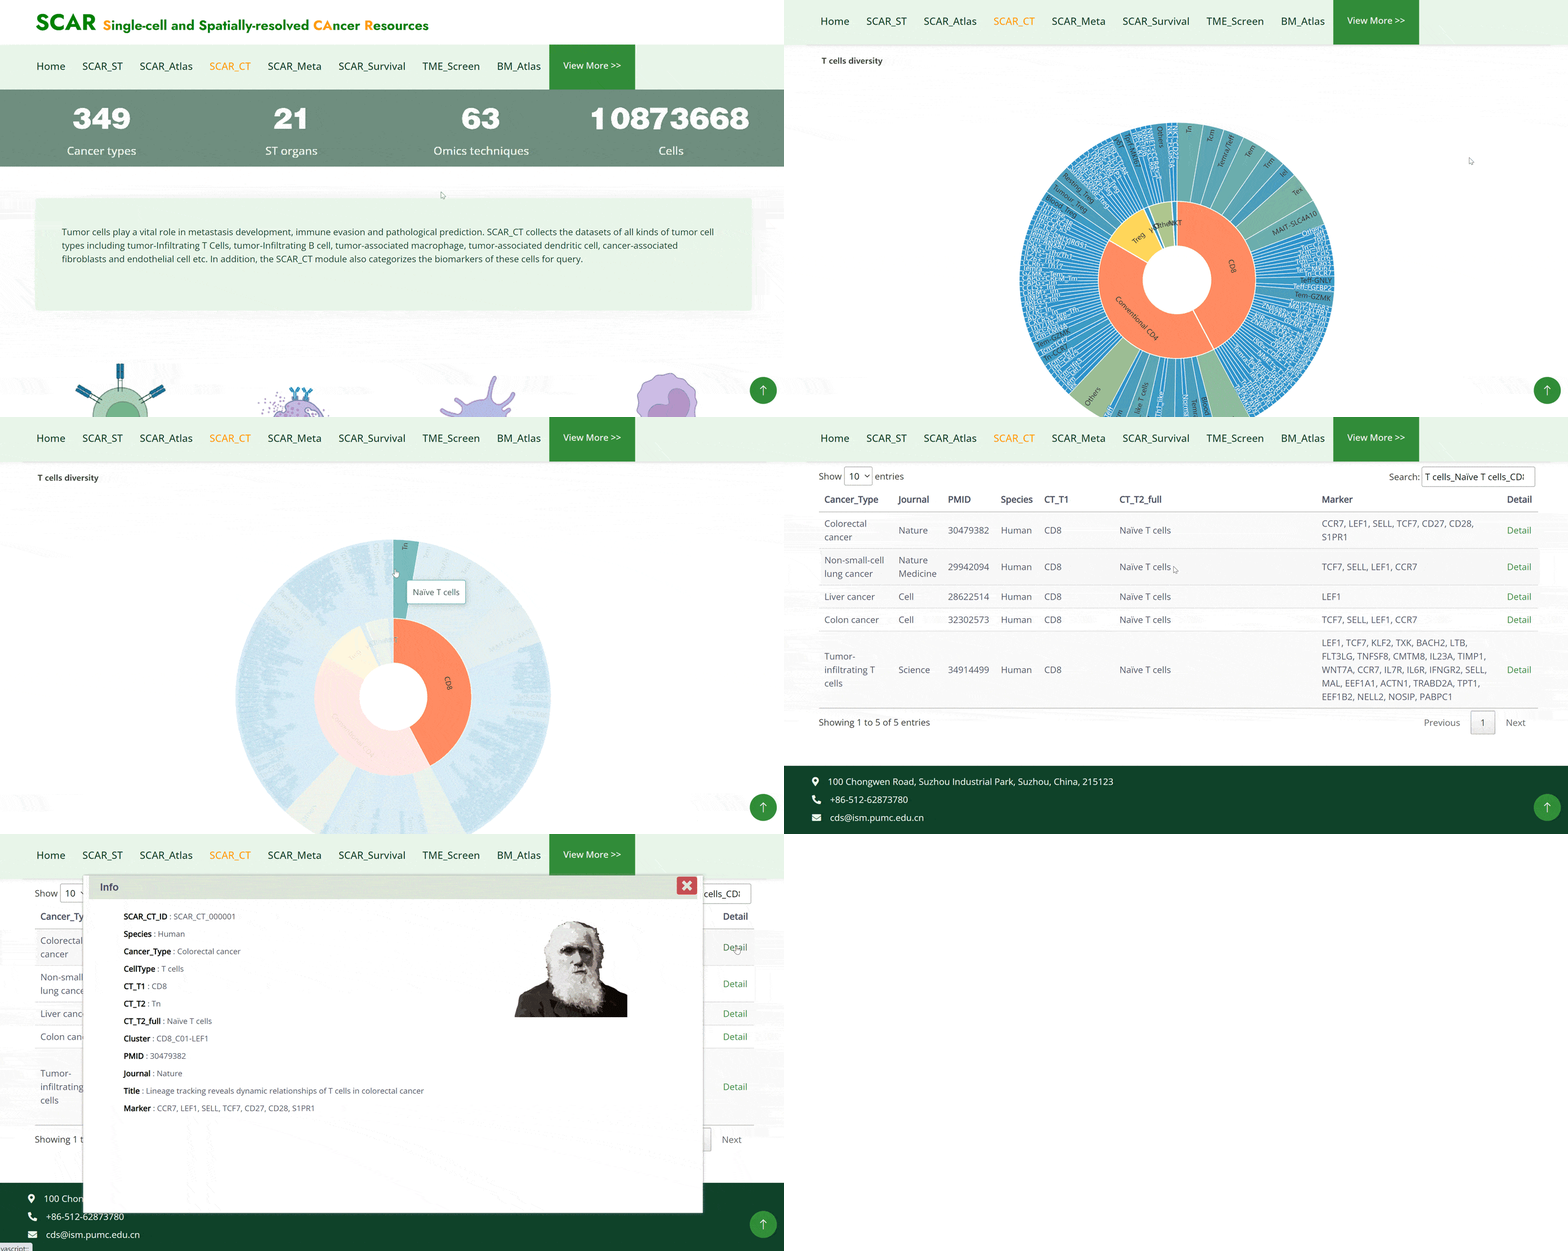
The SCAR_CT module collects 10 cell types that are strongly associated with cancer development: T cells, B cells, dendritic cells, monocytes, macrophages, neutrophils, basophils, mast cells, fibroblasts and endothelial cells. Users can click on the pictures of each cell type and get a doughnut chart of the further classifications of the cell types. By moving the cursor on specific cell subtypes on the doughnut chart, that section of the chart will be highlighted. When the cursor is positioned on different cell subtypes, the left corner bar will consequently show the number of datasets for that cell subtype. After clicking on the cell types in the doughnut chart, the detail of the dataset will be displayed in the table below. Tracing the source of the dataset can be accessed by clicking on the 'Details' button in green font.
SCAR_Meta
The SCAR_Meta module provides a visualization of metabolic activity in the tumor microenvironment in single-cell atlases and presents all cancer types in 28 categories. By applying the search on a cancer type, more cancer subtypes included in that cancer type will be listed in the following table. Once clicked on the 'Metabolism activity' button in green font in the table, the metabolic pathways of all cell types in the dataset are displayed below via a series of violin plots. Note that more graphs of the metabolic pathway are on the next few pages, to be viewed by clicking on the 'Next' button. All graphs are available to download by selecting the ‘Download’ button in green font in the upper righthand corner of the image section.

SCAR_Survival
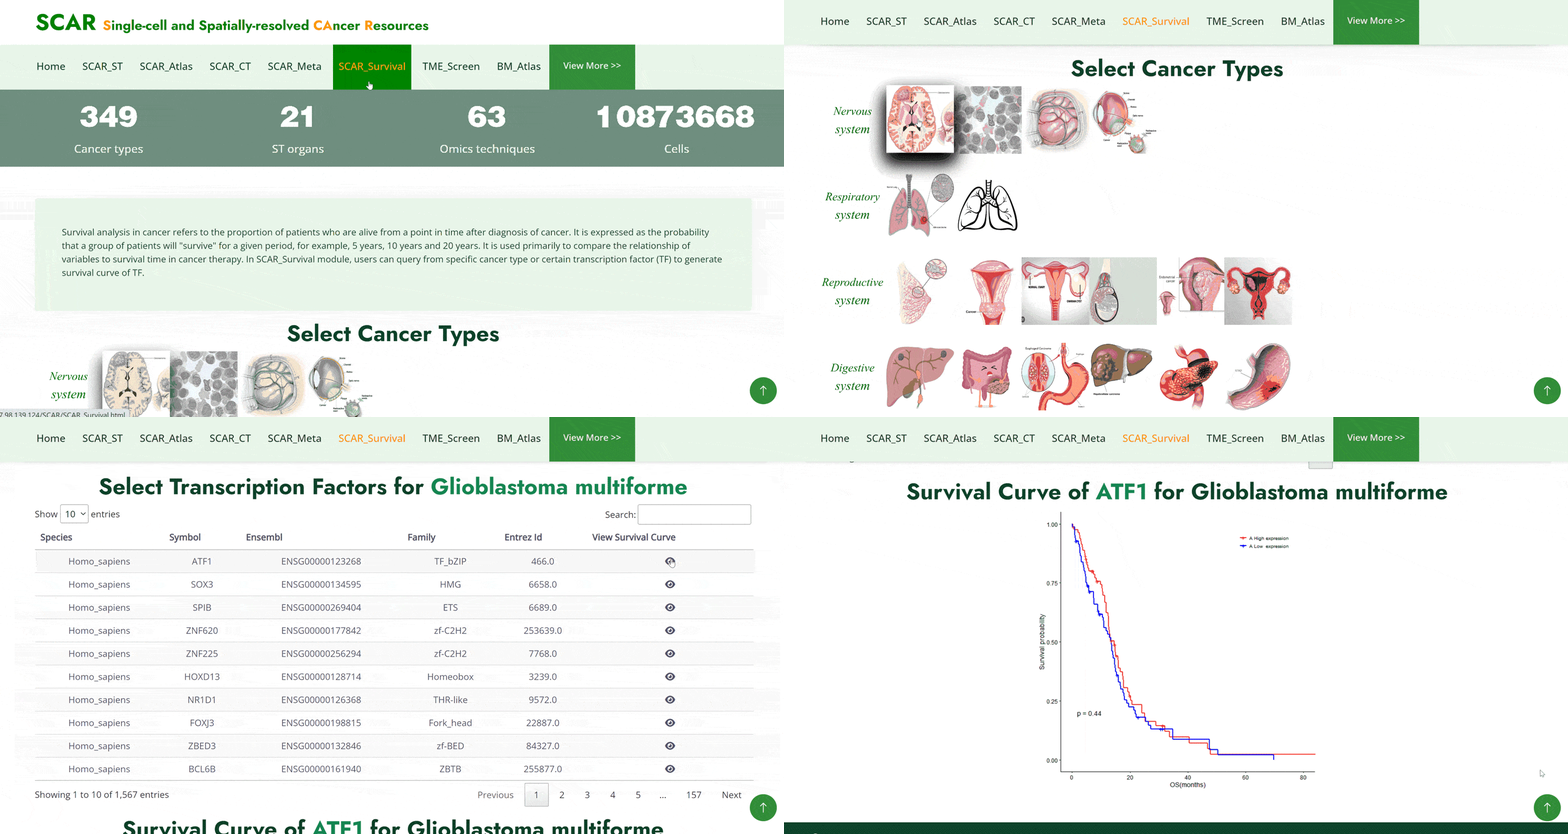
The SCAR_Survival module provides the survival curve prediction for each transcription factor of cancer single-cell RNA sequencing datasets in 31 cancer types. Users require two steps to select the specific transcription factor: firstly, choose the cancer type from the eight system categories, and secondly, select the transcription factor according to the transcription factor details table shown in the table below by clicking on the "small eye" icon in the "View Survival Curve" column. The survival curve for the selected transcription factor for that cancer will be shown below.
TME_Screen
The TME_Screen module allows users to access predicted cell communication of ligands and corresponding receptors between different cell types in the human and mouse single cell transcriptomic atlases. To view by hierarchically selecting the specie, cancer types, cancer subtypes and dataset IDs in the column. The “View cell interaction network between different cell types” panel is a visualization of the interactions of the main cell types. In each image, lines between cell types from light to dark represent weak to strong connections, and blanks represent no connections. The last image is a summary of all the previous cell interaction networks. The ‘signaling pathway between different cell types’ panel displays signaling pathways between certain cell types included in a range of heatmaps. Click on each heatmap to view the signaling pathway network among particular cell types. Then, a table at the bottom summarizes every ligand-receptor interaction and related signaling pathway between all cell types. Users could also search for the keywords in the box directly and get customized cellular information.

BM_Atlas
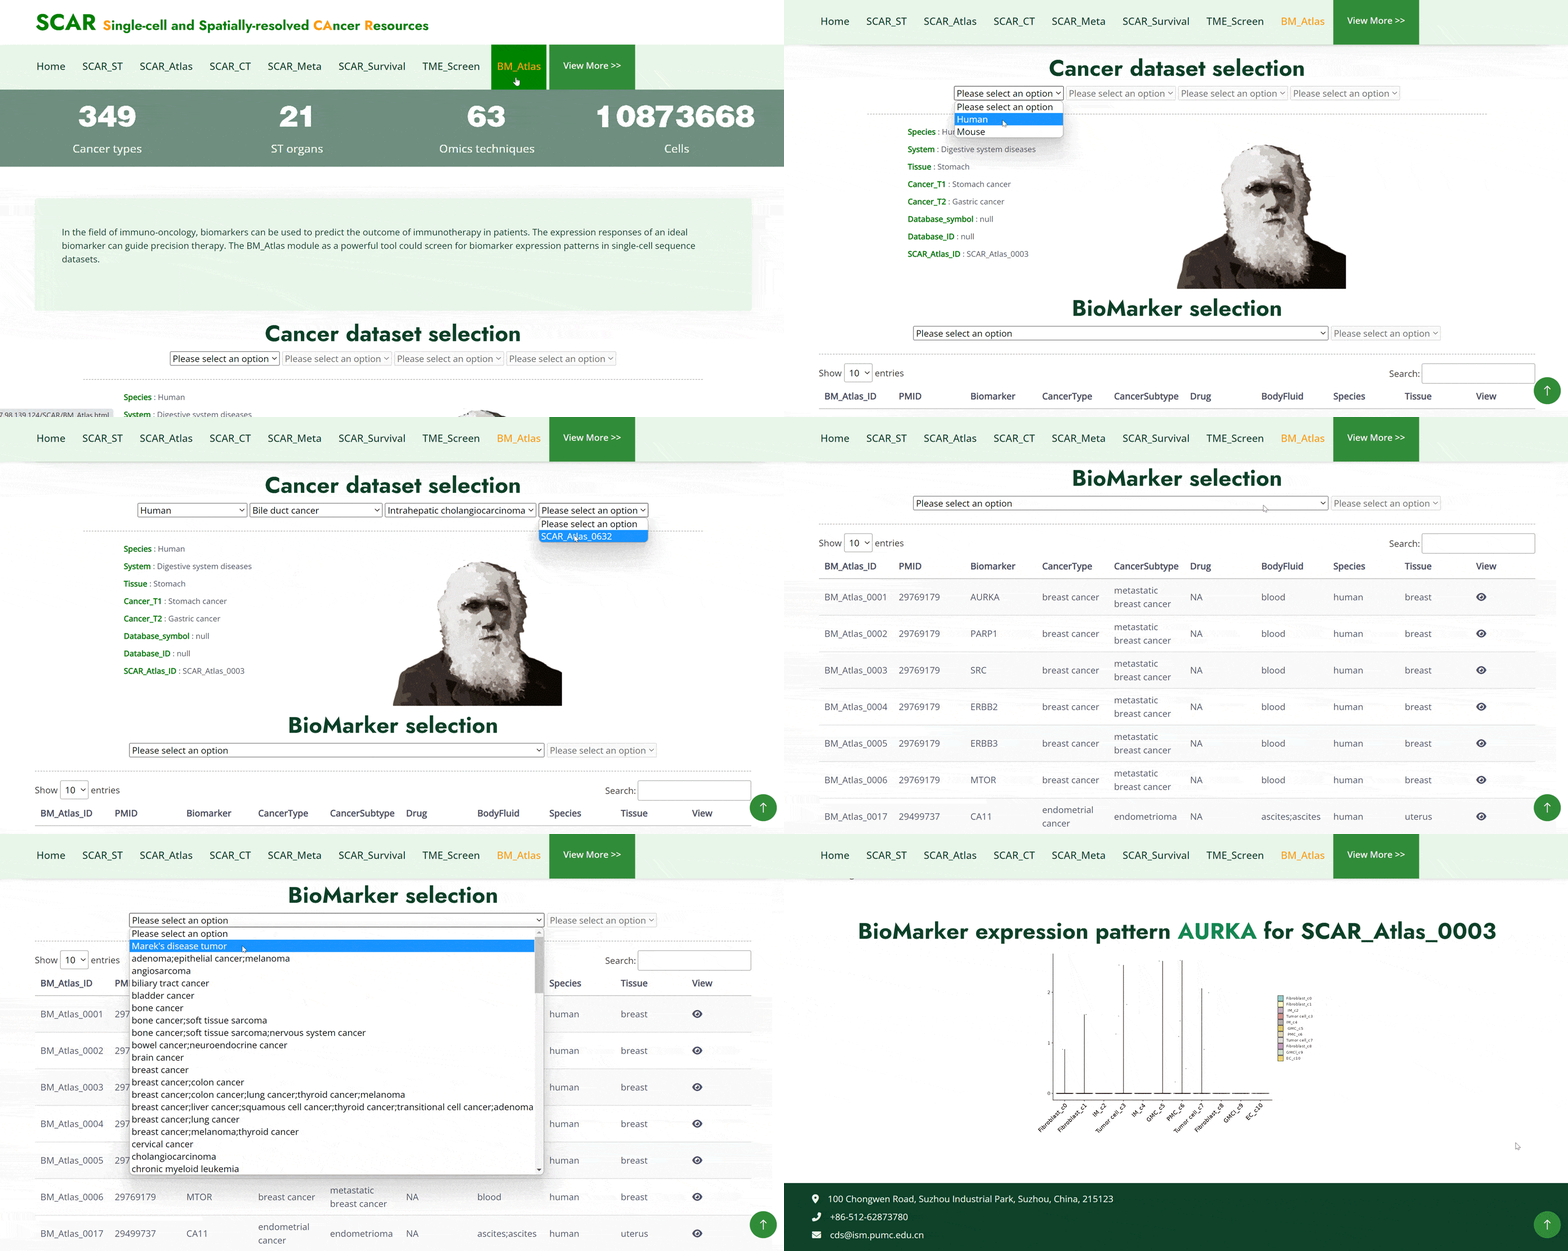
The BM_Atlas module collects a range of biomarkers in single-cell sequence datasets of human and mouse cancers. Users can search for biomarkers in different cancer types in two ways in this module. The first one is to search biomarkers by hierarchically selecting cancer types in cancer datasets, then details information about biomarkers and the dataset will show below. The second one is to select cancer types directly and a table including all biomarkers of the cancer is then subsequently displayed below. After choosing a biomarker in the table, the biomarker expression pattern of the selected biomarker will be generated later.
SCAR_Regulon
The SCAR_Regulon module allows users to screen the genetic regulatory networks of cell types in single-cell RNA sequence datasets of human and mouse cancers. Users can query datasets by hierarchically selecting species, cancer types, cancer subtypes, dataset IDs, and cell types. Once the cell types are identified, a series of pictures of gene regulatory networks (GRNs) for transcription factors of the cancer is generated below. The transcription factor name in red font is located in the hub of GRNs, around which candidate target genes are scattered. When moving down to the next category, Gene Ontology (GO) term enrichment analysis on candidate target genes of each regulon of the cancer is also to be viewed. In the end, a table also summarizes all genes in each cell of the selected cancer that allows a future search on one specific gene name.

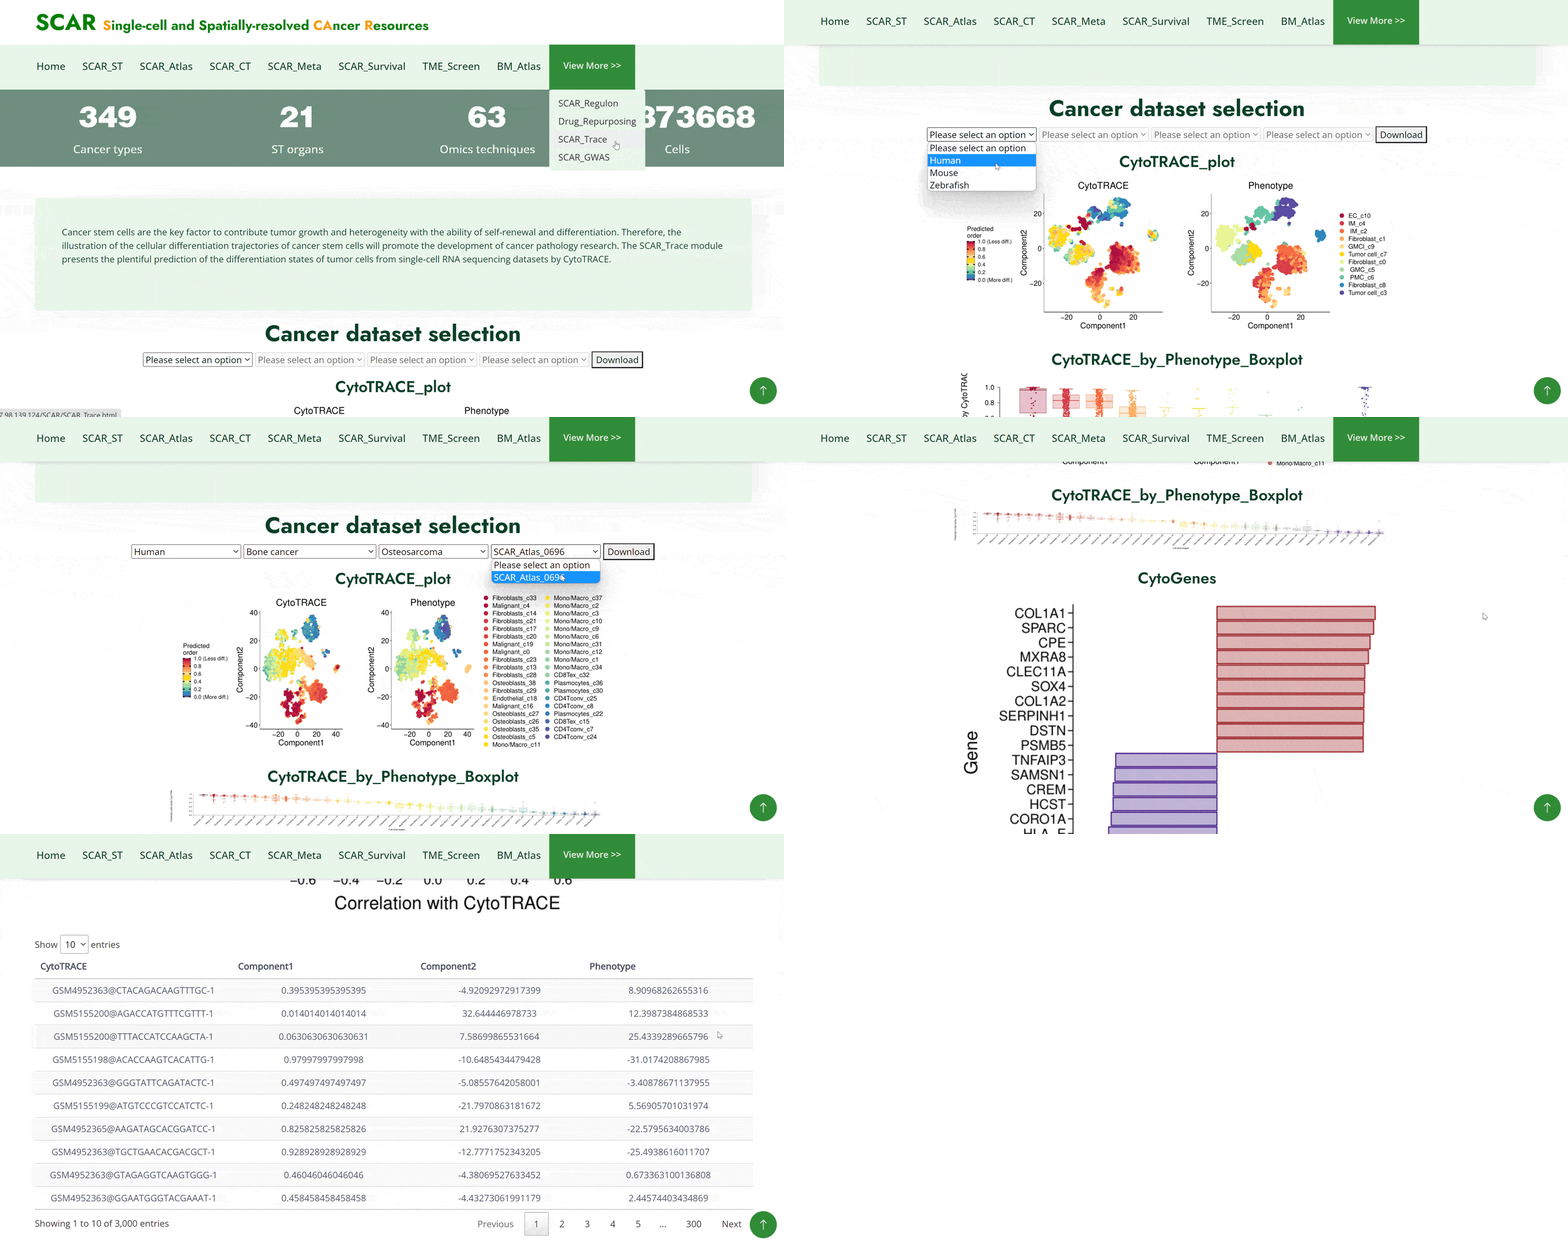
SCAR_Trace
The SCAR_Trace module presents the prediction of differentiation states of cancer stem cells from cancer single-cell RNA sequence datasets in four graphs. After selecting a cancer type hierarchically on the top bar, the first one is a cytoTRACE_plot showing the predicted extent of differentiation for that cancer cell type. The second boxplot shows more specifically the differentiation extent of each cell type. The third bar chart illustrates the correlation between genes and differentiation states. The last table concludes the details information on all involved genes.
